. 2022 Oct 27;11(21):3404.
doi: 10.3390/cells11213404.

High Accuracy Classification of Developmental Toxicants by In Vitro Tests of Human Neuroepithelial and Cardiomyoblast Differentiation

Affiliations

High Accuracy Classification of Developmental Toxicants by In Vitro Tests of Human Neuroepithelial and Cardiomyoblast Differentiation

Florian Seidel et al. Cells. .

Abstract

Human-relevant tests to predict developmental toxicity are urgently needed. A currently intensively studied approach makes use of differentiating human stem cells to measure chemically-induced deviations of the normal developmental program, as in a recent study based on cardiac differentiation (UKK2). Here, we (i) tested the performance of an assay modeling neuroepithelial differentiation (UKN1), and (ii) explored the benefit of combining assays (UKN1 and UKK2) that model different germ layers. Substance-induced cytotoxicity and genome-wide expression profiles of 23 teratogens and 16 non-teratogens at human-relevant concentrations were generated and used for statistical classification, resulting in accuracies of the UKN1 assay of 87-90%. A comparison to the UKK2 assay (accuracies of 90-92%) showed, in general, a high congruence in compound classification that may be explained by the fact that there was a high overlap of signaling pathways. Finally, the combination of both assays improved the prediction compared to each test alone, and reached accuracies of 92-95%. Although some compounds were misclassified by the individual tests, we conclude that UKN1 and UKK2 can be used for a reliable detection of teratogens in vitro, and that a combined analysis of tests that differentiate hiPSCs into different germ layers and cell types can even further improve the prediction of developmental toxicants.

Keywords: alternative testing strategies; developmental and reproductive toxicity; drug screening; gene expression; in vitro test; induced pluripotent stem cells; toxicogenomics; transcriptomics.


Conflict of interest statement

The authors declare no conflict of interest.

Figures

Figure 1
Figure 1
Schematic representation of the UKN1-test (modified from [20,37]). The overview scheme depicts the differentiation protocol, important experimental steps, and the principal of the toxicity assay. In the pluripotency phase (day −3 to 0), hiPSCs were cultured in a pluripotent stem cell (PSC) medium to maintain their pluripotent state. Factors that inhibited Rho-kinase (ROCKi) were additionally given on the day of seeding (day −3) to support the survival of hiPSCs seeded as single cells on extracellular matrix proteins. From day 0 onwards, the change to a differentiation medium spiked with SB431542, dorsomorphin, and noggin initiated neuroectodermal differentiation of the cells. Simultaneously, cells were exposed to test compounds for a total of 96 h. On day 4, substances were withdrawn and addition of 25% N2-S further enhanced the neural differentiation process. On day 6, compound-induced cytotoxicity was determined and the cells were harvested for gene array analysis. Media changes were conducted as indicated (double arrows) on the days −2, −1, 0, 1, 2, and 4.
Figure 2
Figure 2
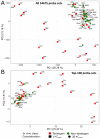
Principal component analysis (PCA) of the teratogenic and non-teratogenic compounds in the UKN1 test. Two PCA-Plots are presented of (A) all 54,675 probe sets and (B) the 100 probe sets with the highest variance across the mean of the condition-wise samples. Green and red tags represent in vivo non-teratogens and teratogens, respectively. 1-fold Cmax and 20-fold Cmax concentrations are indicated by squares and circles, respectively. The distribution of the data points on the x-axis is given by the principal component (PC) 1 and on the y-axis by PC2. The percentages in parentheses denote the proportion of explained variance for the respective PC. Compound abbreviations are explained in Table 1.
Figure 3
Figure 3
Volcano plots of deregulated probe sets of selected test compounds in the UKN1 test. Volcano plots show genome-wide gene expression changes in substance-exposed SBAD2 cells for a representative subset of known teratogens and non-teratogens at therapeutic 1-fold Cmax concentrations. Each dot represents one out of 54,675 probe sets from the Affymetrix gene chips. The fold-change of the differentially-expressed probe sets in substance-exposed cells is given on the x-axis in log2-values, and the corresponding p-values of the limma-analyses are given on the y-axis in negative log10-values. Red dots represent probe sets with a statistically significant, FDR-adjusted p-value < 0.05 and an absolute fold-change > 2. The numbers of up- and downregulated red-dot-probe sets are indicated.
Figure 4
Figure 4
Classification of the teratogenic and non-teratogenic compounds by the SPS-procedure, a method based on the number of significantly deregulated probe sets (SPS), and the top-1000-procedure, a penalized logistic regression-based technique using the 1000 probe sets with the highest variance. (AC) SPS-procedure. The number of SPS for each test condition is given on the y-axis and the x-axis marks non-teratogens and teratogens (compound abbreviations are explained in Table 1). 1-fold-Cmax conditions are indicated with black dots, 20-fold Cmax conditions with black triangles. Grey dots represent the numbers of SPS at 1-fold Cmax of LFL, PHE, TER, and VIS, which were compared to 20-fold Cmax thresholds. For the UKK2 test, SPS numbers were adapted from Cherianidou et al. 2022, but retinol at 20-fold Cmax was considered as a teratogen. SPS numbers above or below the thresholds T and T20× (red dashed lines) for 1-fold and 20-fold Cmax conditions, respectively, were considered to be test-positive or test-negative. Cytotoxic conditions were considered to be test-positive and were assigned with a high number of SPS (UKN1: 4318; UKK2: 4257). Thresholds UKN1 (A): 1-fold-Cmax: 1 SPS; 20-fold-Cmax: 1000 SPS; UKK2 (B): 1-fold-Cmax: 270 SPS; 20-fold-Cmax: 360 SPS; combination ‘mean’ (C): 1-fold-Cmax: 130 SPS; 20-fold-Cmax: 500 SPS. (DF) Top-1000-procedure. The predicted probability for teratogenicity is given on the y-axis, and the x-axis marks non-teratogens and teratogens. Cytotoxic conditions were considered to be 100% test-positive (predicted probability of 1.0). Thresholds UKN1 (D): 1-fold-Cmax: 0.2; 20-fold-Cmax: 0.4; UKK2 (E): 1-fold-Cmax: 0.25; 20-fold-Cmax: 0.15; combination ‘mean’ (F): 1-fold-Cmax: 0.36; 20-fold-Cmax: 0.29.
Figure 4
Figure 4
Classification of the teratogenic and non-teratogenic compounds by the SPS-procedure, a method based on the number of significantly deregulated probe sets (SPS), and the top-1000-procedure, a penalized logistic regression-based technique using the 1000 probe sets with the highest variance. (AC) SPS-procedure. The number of SPS for each test condition is given on the y-axis and the x-axis marks non-teratogens and teratogens (compound abbreviations are explained in Table 1). 1-fold-Cmax conditions are indicated with black dots, 20-fold Cmax conditions with black triangles. Grey dots represent the numbers of SPS at 1-fold Cmax of LFL, PHE, TER, and VIS, which were compared to 20-fold Cmax thresholds. For the UKK2 test, SPS numbers were adapted from Cherianidou et al. 2022, but retinol at 20-fold Cmax was considered as a teratogen. SPS numbers above or below the thresholds T and T20× (red dashed lines) for 1-fold and 20-fold Cmax conditions, respectively, were considered to be test-positive or test-negative. Cytotoxic conditions were considered to be test-positive and were assigned with a high number of SPS (UKN1: 4318; UKK2: 4257). Thresholds UKN1 (A): 1-fold-Cmax: 1 SPS; 20-fold-Cmax: 1000 SPS; UKK2 (B): 1-fold-Cmax: 270 SPS; 20-fold-Cmax: 360 SPS; combination ‘mean’ (C): 1-fold-Cmax: 130 SPS; 20-fold-Cmax: 500 SPS. (DF) Top-1000-procedure. The predicted probability for teratogenicity is given on the y-axis, and the x-axis marks non-teratogens and teratogens. Cytotoxic conditions were considered to be 100% test-positive (predicted probability of 1.0). Thresholds UKN1 (D): 1-fold-Cmax: 0.2; 20-fold-Cmax: 0.4; UKK2 (E): 1-fold-Cmax: 0.25; 20-fold-Cmax: 0.15; combination ‘mean’ (F): 1-fold-Cmax: 0.36; 20-fold-Cmax: 0.29.
Figure 5
Figure 5
Biological interpretation of genes differentially expressed after exposure of hiPSC to teratogens at 20-fold Cmax. (A) Number of significant probe sets (log2 fold change > 1; adjusted p-value < 0.05) induced by non-teratogens and teratogens at the 20-fold Cmax (including also 10-fold Cmax carbamazepine and 1.67-fold Cmax VPA). (B) Top-10 genes from the 7647 SPS deregulated by teratogens. The number in the bar indicates the number of compounds that deregulated the specific gene. The absolute mean log2 fold-change of each gene is given on the x-axis. A comprehensive gene list is given in the Supplementary Excel-file 1. (C) KEGG pathway enrichment analysis of the 7647 SPS deregulated by teratogens. The ten KEGG pathways with the lowest adj. p-values are given. Full names and complete KEGG-pathway lists are given in the Supplementary Excel-file 2. ‘‘Count:’’ number of significant genes from A linked to the KEGG pathway. ‘‘Gene Ratio:’’ percentage of significant genes associated with the pathway compared to the number of all significant genes associated with any pathway. (D) The ten GO groups with the lowest adj. p-values from all significantly (adj. p-value < 0.05) overrepresented GO groups in the 7647 SPS deregulated by teratogens. The names of the GO groups have been shortened. Full names and complete GO group lists can be found in the Supplementary Excel-file 3. ‘Count:’ number of significant genes from A linked to the GO group. ‘Hits:’ percentage of significant genes compared to all genes assigned to the GO group.
Figure 6
Figure 6
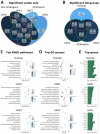
Biological interpretation and comparison of genes differentially expressed in the UKN1 and UKK2 test after exposure of hiPSC to teratogens at 20-fold Cmax. (A) Number of significant probe sets (log2 fold change >1; adjusted p-value < 0.05) induced by non-teratogens and teratogens at the 20-fold Cmax (including also 10-fold Cmax carbamazepine and 1.67-fold Cmax VPA). The following gene sets were defined: ‘Overlap:’ SPS that were deregulated by teratogens in UKN1 and UKK2 (3634 SPS); ‘UKN1′ and ‘UKK2:’ SPS that were deregulated by teratogens exclusively in UKN1 (4013 SPS) and UKK2 (4885 SPS), respectively. (B) Number of significantly (adj. p-value < 0.05) overrepresented GO groups in the gene sets ‘Overlap,’ ‘UKN1,’ and ‘UKK2.’ (C) KEGG pathway enrichment analysis of the gene sets ‘Overlap,’ ‘UKN1,’ and ‘UKK2.’ The ten KEGG pathways with the lowest adj. p-values are given. Full names and complete KEGG-pathway lists are given in the Supplementary Excel-file 4. ‘‘Count:’’ number of significant genes from A linked to the KEGG pathway. ‘‘Gene Ratio:’’ percentage of significant genes associated with the pathway compared to the number of all significant genes associated with any pathway. (D) The ten GO groups with the lowest adj. p-values from all significantly (adj. p-value <0.05) overrepresented GO groups in each gene set. The following adjustments applied here: ‘Overlap’ included all GO groups encompassed by the overlap-circle in B (442 GO groups); ‘UKN1′ (65 GO groups) and ‘UKK2′ (19 GO groups) only considered remained GO groups. The names of the GO groups were shortened. Full names and complete GO group lists can be found in the Supplementary Excel-file 5. ‘‘Count:’’ Number of significant genes from A linked to the GO group. ‘‘Hits:’’ percentage of significant genes compared to all genes assigned to the GO group. (E) Top-10 genes deregulated by teratogens within each gene set. The number in the bar indicates the number of compounds that deregulated the specific gene. The absolute mean log fold-change of each gene is given on the x-axis. A comprehensive gene list is provided in the Supplementary Excel-file 6.

Similar articles

Cited by

  • G × E interactions as a basis for toxicological uncertainty.
    Suciu I, Pamies D, Peruzzo R, Wirtz PH, Smirnova L, Pallocca G, Hauck C, Cronin MTD, Hengstler JG, Brunner T, Hartung T, Amelio I, Leist M. Suciu I, et al. Arch Toxicol. 2023 Jul;97(7):2035-2049. doi: 10.1007/s00204-023-03500-9. Epub 2023 Jun 1. Arch Toxicol. 2023. PMID: 37258688 Free PMC article.

References

    1. Seiler A., Oelgeschläger M., Liebsch M., Pirow R., Riebeling C., Tralau T., Luch A. Developmental toxicity testing in the 21st century: The sword of Damocles shattered by embryonic stem cell assays? Arch. Toxicol. 2011;85:1361–1372. doi: 10.1007/s00204-011-0767-1. - DOI - PubMed
    1. Meigs L., Smirnova L., Rovida C., Leist M., Hartung T. Animal testing and its alternatives—The most important omics is economics. ALTEX. 2018;35:275–305. doi: 10.14573/altex.1807041. - DOI - PubMed
    1. Luz A.L., Tokar E.J. Pluripotent Stem Cells in Developmental Toxicity Testing: A Review of Methodological Advances. Toxicol. Sci. 2018;165:31–39. doi: 10.1093/toxsci/kfy174. - DOI - PMC - PubMed
    1. Sachinidis A., Albrecht W., Nell P., Cherianidou A., Hewitt N.J., Edlund K., Hengstler J.G. Road Map for Development of Stem Cell-Based Alternative Test Methods. Trends Mol. Med. 2019;25:470–481. doi: 10.1016/j.molmed.2019.04.003. - DOI - PubMed
    1. Horzmann K.A., Freeman J.L. Making Waves: New Developments in Toxicology With the Zebrafish. Toxicol. Sci. 2018;163:5–12. doi: 10.1093/toxsci/kfy044. - DOI - PMC - PubMed

Publication types