. 2022 Oct 31;11(21):3449.
doi: 10.3390/cells11213449.

Phenotypical and Functional Alteration of γδ T Lymphocytes in COVID-19 Patients: Reversal by Statins

Affiliations

Phenotypical and Functional Alteration of γδ T Lymphocytes in COVID-19 Patients: Reversal by Statins

Marta Di Simone et al. Cells. .

Abstract

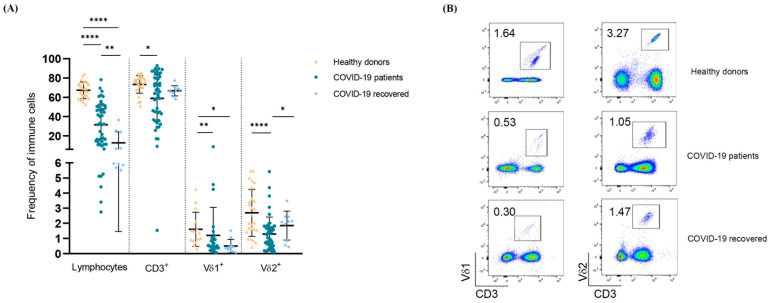
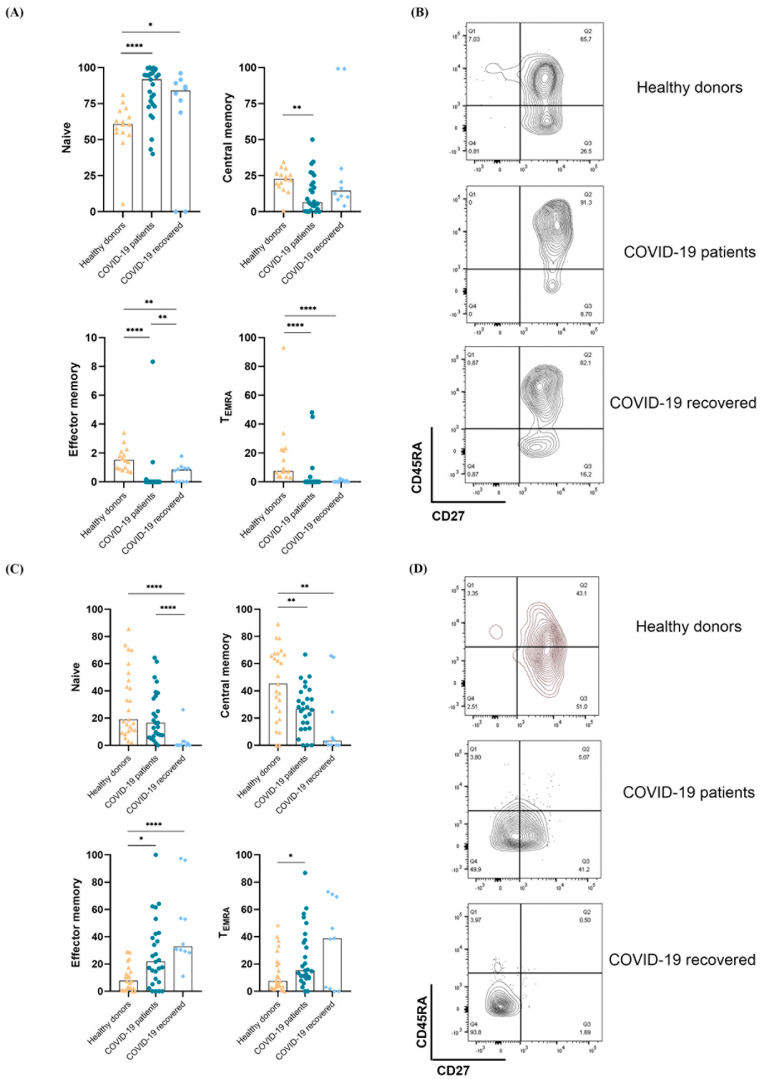
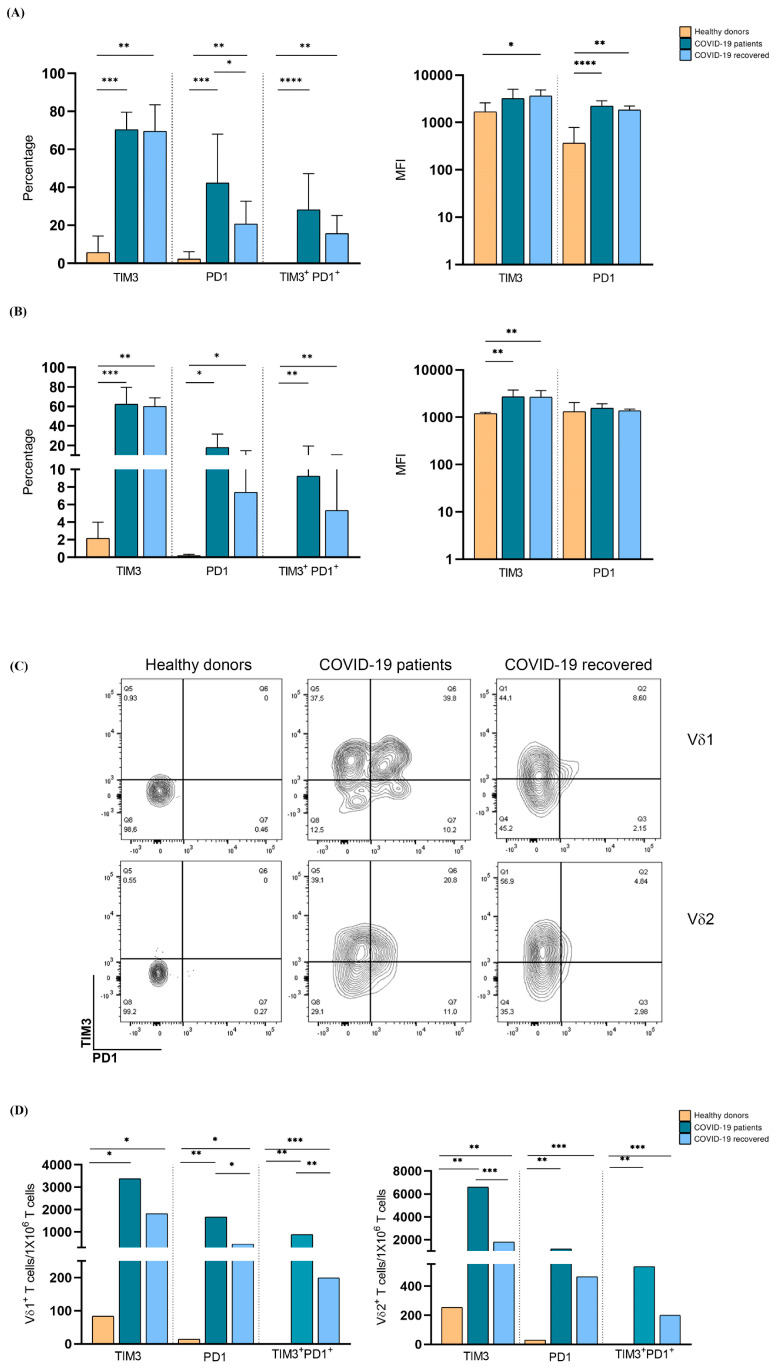
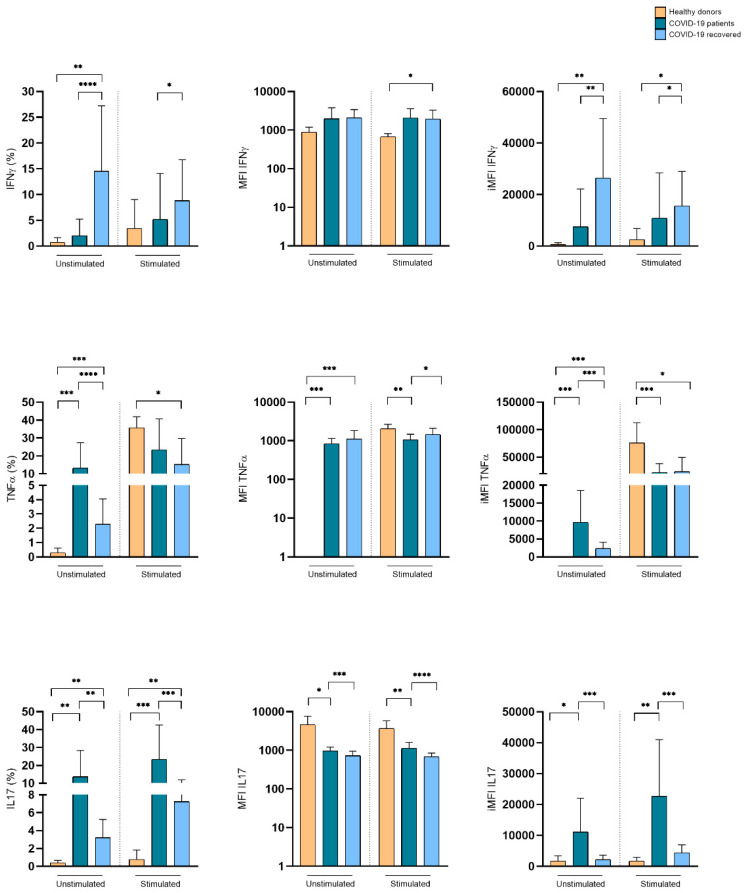
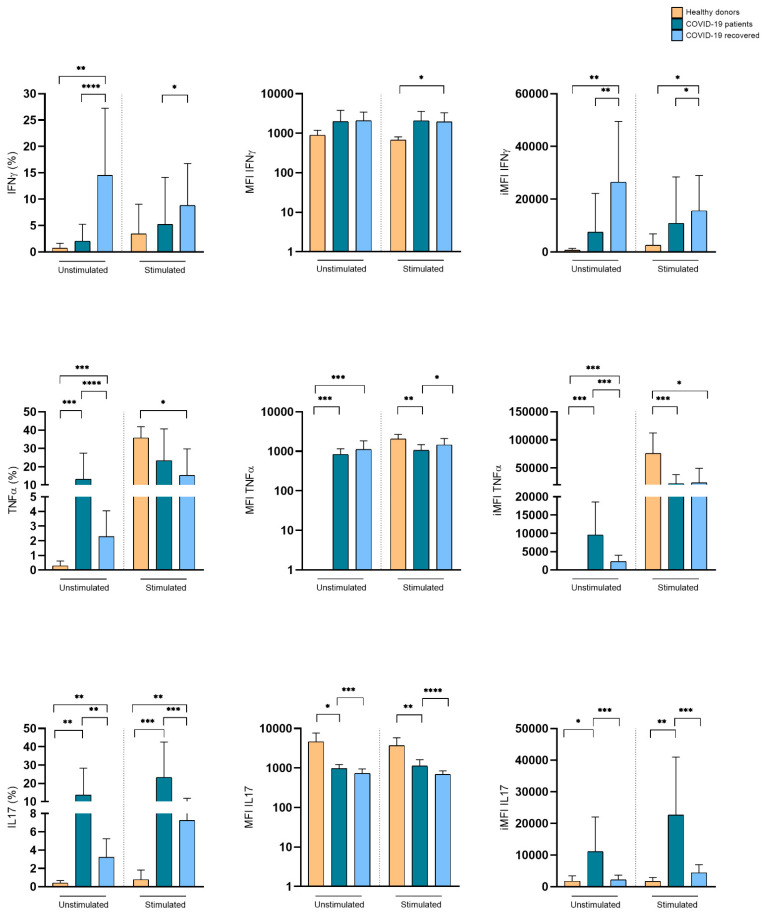
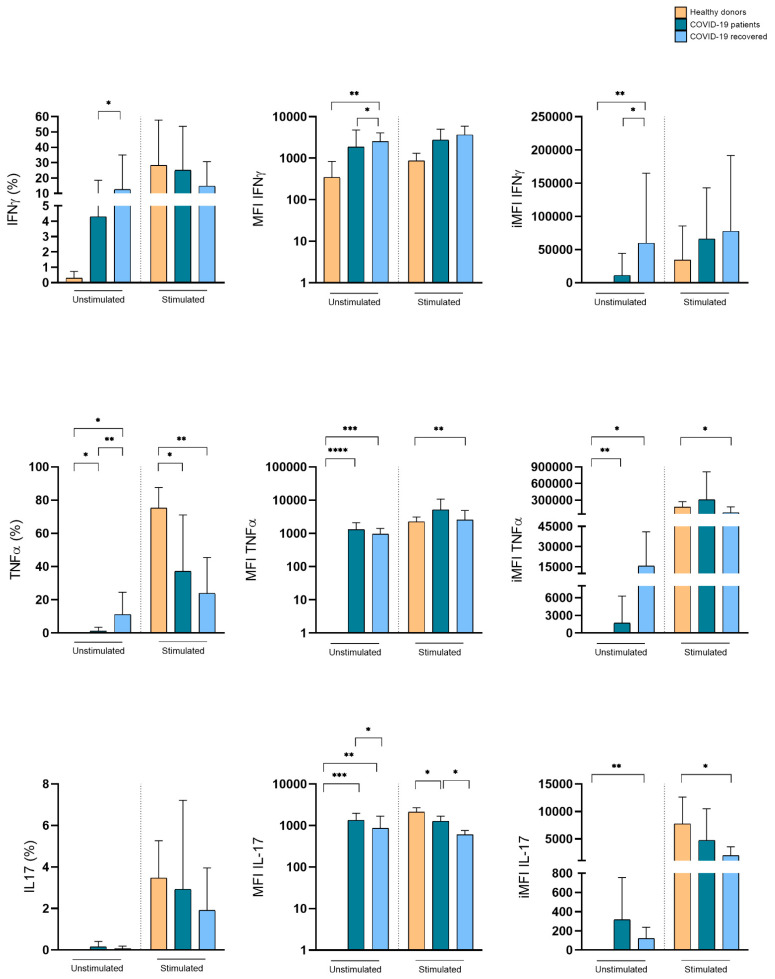
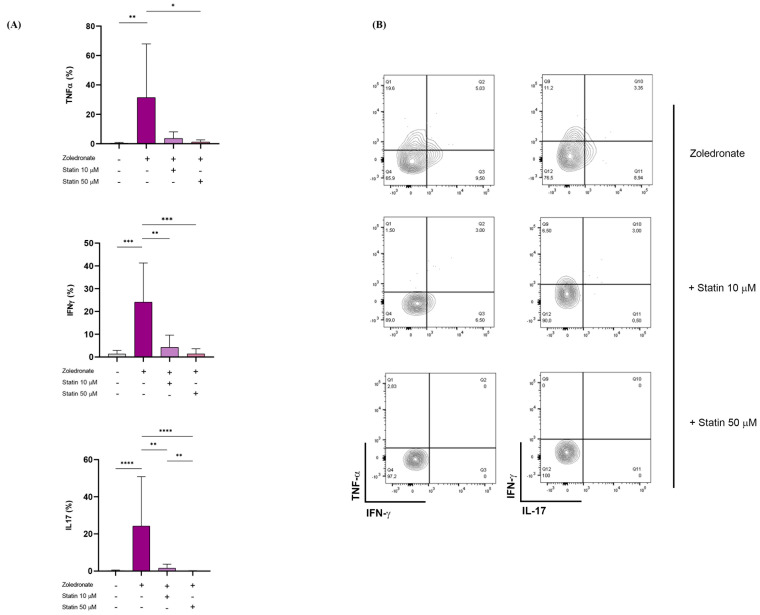
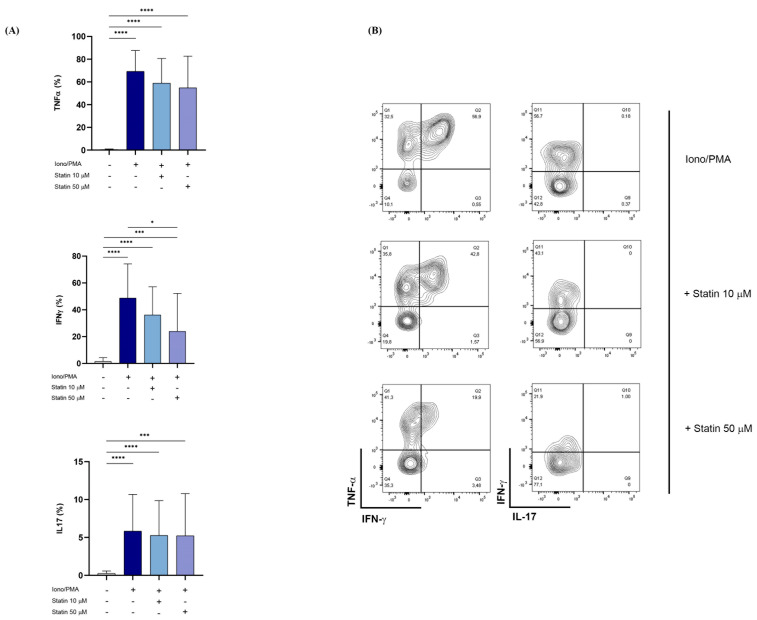
(1) Background: statins have been considered an attractive class of drugs in the pharmacological setting of COVID-19 due to their pleiotropic properties and their use correlates with decreased mortality in hospitalized COVID-19 patients. Furthermore, it is well known that statins, which block the mevalonate pathway, affect γδ T lymphocyte activation. As γδ T cells participate in the inflammatory process of COVID-19, we have investigated the therapeutical potential of statins as a tool to inhibit γδ T cell pro-inflammatory activities; (2) Methods: we harvested peripheral blood mononuclear cells (PBMCs) from COVID-19 patients with mild clinical manifestations, COVID-19 recovered patients, and healthy controls. We performed ex vivo flow cytometry analysis to study γδ T cell frequency, phenotype, and exhaustion status. PBMCs were treated with Atorvastatin followed by non-specific and specific stimulation, to evaluate the expression of pro-inflammatory cytokines; (3) Results: COVID-19 patients had a lower frequency of circulating Vδ2+ T lymphocytes but showed a pronounced pro-inflammatory profile, which was inhibited by in vitro treatment with statins; (4) Conclusions: the in vitro capacity of statins to inhibit Vδ2+ T lymphocytes in COVID-19 patients highlights a new potential biological function of these drugs and supports their therapeutical use in these patients.

Keywords: COVID-19; SARS-CoV-2 infection; mevalonate pathway; statin; γδ T cells.


Conflict of interest statement

The authors declare no conflict of interest.

Figures

Figure 1
Figure 1
Frequency of Vδ1+ and Vδ2+ T lymphocytes in hospitalized and recovered COVID-19 patients and in healthy subjects. (A) Distribution of percentages of total lymphocytes, T (CD3+), Vδ1+ and Vδ2+ T lymphocytes in hospitalized and recovered COVID-19 patients, compared to healthy subjects. Shown is mean ± SD. (B) Representative dot-plots showing the frequency of Vδ1+ and Vδ2+ T lymphocytes in hospitalized and recovered COVID-19 patients and healthy subjects. * p < 0.05, ** p < 0.01, **** p < 0.0001.
Figure 2
Figure 2
Phenotypic analysis of circulating Vδ1+ and Vδ2+ T lymphocytes in hospitalized and recovered COVID-19 patients and in healthy subjects. Distribution of ex vivo memory subsets of Vδ1+ (A) and Vδ2+ (C) T lymphocytes based on the expression of CD27 and CD45RA in hospitalized and recovered COVID-19 patients, compared to healthy donors. Median is shown. Healthy donors were represented as triangle, COVID-19 patients as circle and COVID-19 recovered as rhombus. Representative dot-plots showing Vδ1+ (B) and Vδ2+ (D) T lymphocyte memory subset distribution in hospitalized, recovered, and healthy subjects. * p < 0.05, ** p < 0.01, **** p < 0.0001.
Figure 3
Figure 3
Analysis of exhaustion-marker expression by circulating Vδ1+ and Vδ2+ T lymphocytes in hospitalized and recovered COVID-19 patients and healthy subjects. Expression of TIM-3 and PD-1 on Vδ1+ (A) and Vδ2+ (B) T lymphocytes in hospitalized and recovered COVID-19 patients, compared to healthy donors. Shown are percentage (left panels) and MFI (right panels) ± SD. (C) Representative dot-plots of exhaustion-marker expression by Vδ1+ and Vδ2+ T lymphocytes from hospitalized and recovered COVID-19 patients, compared to healthy donors. (D) Frequency of exhausted Vδ1+ and Vδ2+ T cells per 1 × 10⁶ T lymphocytes. * p < 0.05, ** p < 0.01, *** p < 0.001, and **** p < 0.0001.
Figure 4
Figure 4
Expression of pro-inflammatory cytokines by Vδ1+ T lymphocytes in hospitalized and recovered COVID-19 patients, compared to healthy subjects. Cumulative histograms representing the expression of pro-inflammatory cytokines by Vδ1+ T lymphocyte. Shown are percentage (left panels), MFI (central panel, log10 scale), and iMFI (right panels) ± SD. * p < 0.05, ** p < 0.01, *** p < 0.001, and **** p < 0.0001.
Figure 5
Figure 5
Expression of pro-inflammatory cytokines by Vδ2+ T lymphocytes in hospitalized and recovered COVID-19 patients, compared to healthy subjects. Cumulative histograms representing the expression of pro-inflammatory cytokines. Shown are percentage (left panels), MFI (central panel, log10 scale), and iMFI (right panels) ± SD. * p < 0.05, ** p < 0.01, *** p < 0.001, and **** p < 0.0001.
Figure 6
Figure 6
Intracellular cytokine expression by Vδ2+ T lymphocytes in COVID-19 patients and healthy donors upon zoledronate stimulation. Intracellular levels of IFN-γ, TNF-α, and IL-17, in terms of percentage and iMFI, expressed by Vδ2+ T cells, are represented as histogram plots. Shown is mean ± SD. * p < 0.05, ** p < 0.01, *** p< 0.001, and **** p < 0.0001.
Figure 7
Figure 7
Inhibition of Vδ2+ T cell cytokine expression by atorvastatin upon zoledronate stimulation (A) Intracellular levels of TNF-α, IFN-γ, and IL-17 expressed by Vδ2+ T cells from COVID-19 patients upon stimulation with zoledronate in presence of atorvastatin. Data are represented as histogram plots. Each histogram shows mean ± SD. Purple histogram represented Zoledronate condition, lilac histogram represented Zoledronate + 10 μM statin condition, and pink histogram represented Zoledronate + 50 μM statin condition. (B) Representative counterplots showing pro-inflammatory cytokine expression by Vδ2+ T lymphocytes. * p < 0.05, ** p < 0.01, *** p< 0.001, and **** p < 0.0001.
Figure 8
Figure 8
Inhibition of Vδ2+ T cell cytokine expression by atorvastatin upon Iono/PMA stimulation. (A) Intracellular levels of TNF-α, IFN-γ, and IL-17 expressed by Vδ2+ T cells from COVID-19 patients upon stimulation with Iono/PMA in presence of atorvastatin. Data are represented as histogram plots, showing mean ± SD. Blue histogram represented Iono/PMA condition, light blue histogram represented Iono/PMA + 10 μM statin condition, and light blue powder histogram represented Iono/PMA + 50 mM statin condition. (B) Representative counterplots showing pro-inflammatory cytokine expression by Vδ2+ T lymphocytes. * p < 0.05, *** p< 0.001, and **** p < 0.0001.

Similar articles

References

    1. Melenotte C., Silvin A., Goubet A.-G., Lahmar I., Dubuisson A., Zumla A., Raoult D., Merad M., Gachot B., Hénon C., et al. Immune responses during COVID-19 infection. OncoImmunology. 2020;9:1807836. doi: 10.1080/2162402X.2020.1807836. - DOI - PMC - PubMed
    1. Kashour T., Halwani R., Arabi Y.M., Sohail M.R., O’Horo J.C., Badley A.D., Tleyjeh I.M. Statins as an adjunctive therapy for COVID-19: The biological and clinical plausibility. Immunopharmacol. Immunotoxicol. 2021;43:37–50. doi: 10.1080/08923973.2020.1863984. - DOI - PubMed
    1. Gupta A., Madhavan M.V., Poterucha T.J., DeFilippis E.M., Hennessey J.A., Redfors B., Eckhardt C., Bikdeli B., Platt J., Nalbandian A., et al. Association Between Antecedent Statin Use and Decreased Mortality in Hospitalized Patients with COVID-19. Res. Sq. 2021;12:1–9. doi: 10.1038/s41467-021-21553-1. - DOI - PMC - PubMed
    1. Oesterle A., Laufs U., Liao J.K. Pleiotropic Effects of Statins on the Cardiovascular System. Circ. Res. 2017;120:229–243. doi: 10.1161/CIRCRESAHA.116.308537. - DOI - PMC - PubMed
    1. Ridker P.M., Danielson E., Fonseca F.A., Genest J., Gotto A.M., Jr., Kastelein J.J., Koenig W., Libby P., Lorenzatti A.J., MacFadyen J.G., et al. Rosuvastatin to prevent vascular events in men and women with elevated C-reactive protein. N. Engl. J. Med. 2008;359:2195–2207. doi: 10.1056/NEJMoa0807646. - DOI - PubMed

Publication types

MeSH terms

Substances