. 2022 Oct 31;11(21):3452.
doi: 10.3390/cells11213452.

Precision Phenotyping of Nectar-Related Traits Using X-ray Micro Computed Tomography

Affiliations

Precision Phenotyping of Nectar-Related Traits Using X-ray Micro Computed Tomography

Laurent Begot et al. Cells. .

Abstract

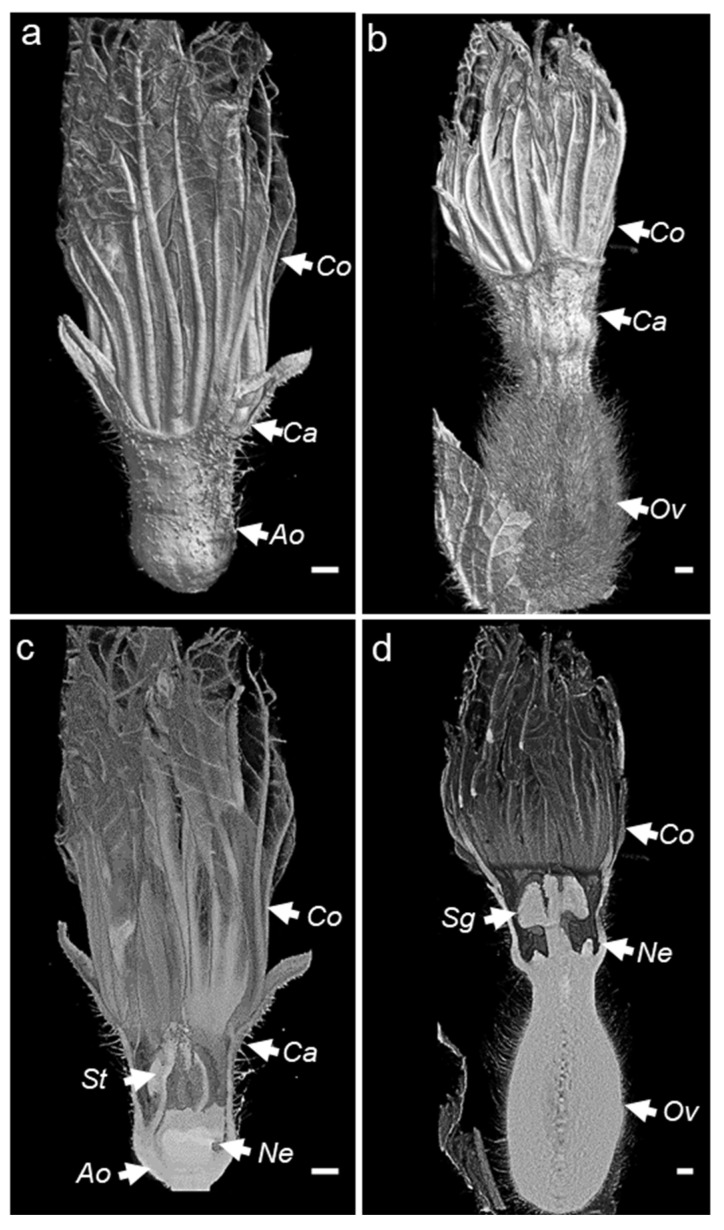
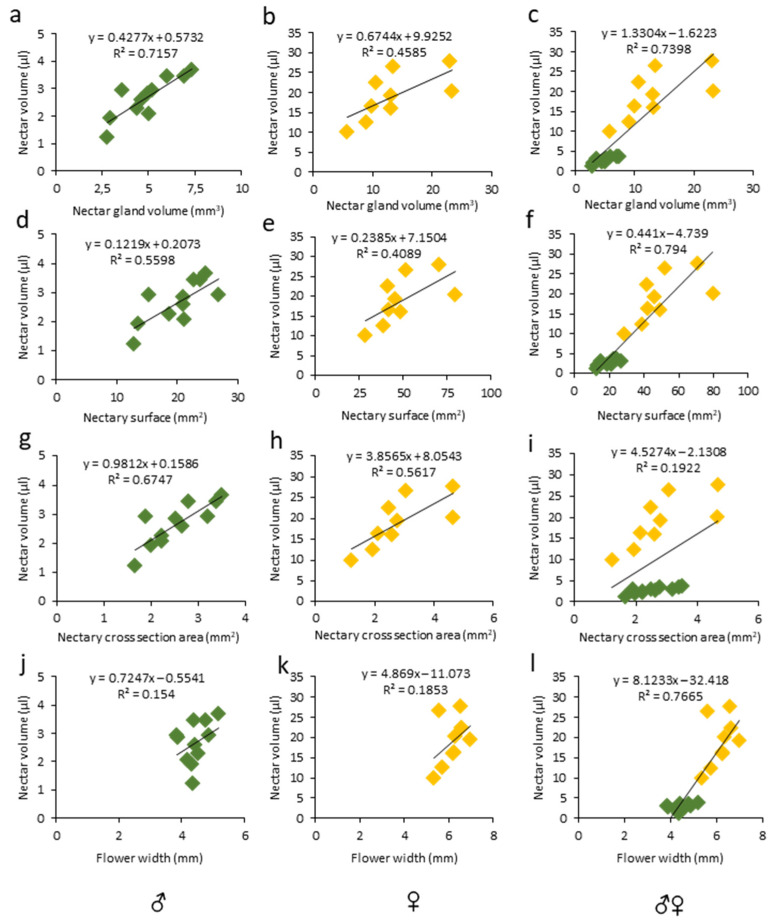
Flower morphologies shape the accessibility to nectar and pollen, two major traits that determine plant-pollinator interactions and reproductive success. Melon is an economically important crop whose reproduction is completely pollinator-dependent and, as such, is a valuable model for studying crop-ecological functions. High-resolution imaging techniques, such as micro-computed tomography (micro-CT), have recently become popular for phenotyping in plant science. Here, we implemented micro-CT to study floral morphology and honey bees in the context of nectar-related traits without a sample preparation to improve the phenotyping precision and quality. We generated high-quality 3D models of melon male and female flowers and compared the geometric measures. Micro-CT allowed for a relatively easy and rapid generation of 3D volumetric data on nectar, nectary, flower, and honey bee body sizes. A comparative analysis of male and female flowers showed a strong positive correlation between the nectar gland volume and the volume of the secreted nectar. We modeled the nectar level inside the flower and reconstructed a 3D model of the accessibility by honey bees. By combining data on flower morphology, the honey bee size and nectar volume, this protocol can be used to assess the flower accessibility to pollinators in a high resolution, and can readily carry out genotypes comparative analysis to identify nectar-pollination-related traits.

Keywords: Cucumis melo; X-ray microtomography (micro-CT); flower; honey bee; image analysis; nectar; nectary; pollinators.


Conflict of interest statement

The authors declare no conflict of interest.

Figures

Figure 1
Figure 1
Mind map of the methodology used in this study. Three independent samplings were carried out, the sampling and measurement of nectar and scanning of the flower and the honey bee. Three-dimensional volumetric data was obtained for the three samples which were used for geometric measurements of organs of interest. Finally, correlation analyses were performed between nectar volume and different nectary attributes. We modeled a honey bee visit by superimposing three data sets: the nectar volume, flower, and the honey bee.
Figure 2
Figure 2
Microcomputed tomography of melon flowers at anthesis stage. (a) Schematic diagram of an in vivo microcomputed tomography device. The X-Ray tube generates an X-rays conical beam. The sample, the flower, was placed inside a polystyrene chip and inserted into a water-filled microtube. The beam crossing the sample was collected by the X-ray detector leading to radiographic projections. Then, the projections were used to compute the three-dimensional structure of the sample. (b) Schematic representation of the bioinformatic pipeline used for acquisition of the 3D images.
Figure 3
Figure 3
(ad) External and cross-sectional 3D overview of male (a,c) and female (b,d) melon flowers generated using Bruker CTvox software. Ov, ovary; St, stamen; Sg, stigma; Ne, nectary; Co, corolla; Ca, calix; Ao, aborted ovary; VOI, volume of interest. The scale bar represents 1 mm.
Figure 4
Figure 4
(A) Analysis of melon flowers at anthesis stage using a stereomicroscope and microtomography. Transversal view of ♂ (a) and ♀ (b) flowers under a stereomicroscope. Microtomographic transversal and sagittal views of ♂ (c,e) and ♀ (d,f) flowers. Three-dimensional cross sectional views of total 2D nectary surface area (g,h) and 3D views of total nectary volumes (i,j) extracted from 3D models of flowers types (♂, ♀). St, stamen; Sg, stigma; Co, corolla; Opt, one pixel thickness; Ne, nectary; Nes, nectary surface; and Nev, nectary volume. The scale bar represents 1 mm. (B) comparison of 2D and 3D parameters between flower types (♂, ♀): flower width (k), cross-sectional nectary area (l), total 2D nectary surface area (m), and nectary volume (n) of ♂ and ♀ flowers calculated using microtomography. Male = M; female = F.; N.S. = not significant; *** = p < 0.001.
Figure 5
Figure 5
Linear regression and correlation analysis between nectar volume and (ac) nectar gland volume, (df) 2D nectary surface, (gi) nectary cross-section area, and (jl) flower width in the respective male, female, and pooled melon flowers. R2 coefficients with equations are shown above each slope. Number of samples (n) was 11 and 9 for male (green) and female (yellow) flowers, respectively.
Figure 6
Figure 6
Analysis of nectar volumes of male and female melon flowers at anthesis stage. (a) Nectar left in female flower after glass capillary pipetting is indicated by yellow arrows. (b) Nectar volume in male (M) and female (F) flowers measured using glass capillary pipettes with (M2 and F2) and without flower dissection (M1 and F1). St, stamen; Sg, stigma; Ne, nectary; and N.S., not significant; * = p < 0.05. Microtomographic transversal and semi-sagittal views of male (c,e) and female (d,f) flowers showing nectar volumes in yellow. The scale bar represents 1 mm.
Figure 7
Figure 7
Reconstruction of 3D images showing the head of a honeybee sucking nectar. External (a) and cross-sectional (b) 3D images of a honeybee. Three-dimensional image showing nectar volume (c) and honeybee proboscis with the sliding glossa (tongue) pumping nectar deep into the flower corolla (d). Ab, abdomen; Th, thorax; He, head; Ht, heart; Hs, honey stomach; Fm, flight muscles; Br, brain; In, intestine; Pr, proboscis and glossa; and Ne, nectary. The scale bar represents 1 mm.

References

    1. Borghi M., Fernie A.R., Schiestl F.P., Bouwmeester H.J. The Sexual Advantage of Looking, Smelling, and Tasting Good: The Metabolic Network That Produces Signals for Pollinators. Trends Plant Sci. 2017;22:338–350. doi: 10.1016/j.tplants.2016.12.009. - DOI - PubMed
    1. Muhlemann J.K., Klempien A., Dudareva N. Floral volatiles: From biosynthesis to function: Floral volatiles. Plant Cell Environ. 2014;37:1936–1949. doi: 10.1111/pce.12314. - DOI - PubMed
    1. Hermann K., Kuhlemeier C. The genetic architecture of natural variation in flower morphology. Curr. Opin. Plant Biol. 2011;14:60–65. doi: 10.1016/j.pbi.2010.09.012. - DOI - PubMed
    1. Dorado J., Vázquez D.P. The diversity-stability relationship in floral production. Oikos. 2014;123:1137–1143. doi: 10.1111/oik.00983. - DOI
    1. Kiill L.H.P., Feitoza E.D.A., Siqueira K.M.M.D., Ribeiro M.D.F., Silva E.M.S.D. Evaluation of Floral Characteristics of Melon Hybrids (Cucumis Melo L.) in Pollinator Attractiveness. Rev. Bras. Frutic. 2016;38:1–12. doi: 10.1590/0100-29452016531. - DOI

Publication types

LinkOut - more resources