. 2022 Nov 2;11(21):3461.
doi: 10.3390/cells11213461.

Analysis of Homologous Regions of Small RNAs MIR397 and MIR408 Reveals the Conservation of Microsynteny among Rice Crop-Wild Relatives

Affiliations

Analysis of Homologous Regions of Small RNAs MIR397 and MIR408 Reveals the Conservation of Microsynteny among Rice Crop-Wild Relatives

Prasanta K Dash et al. Cells. .

Abstract

MIRNAs are small non-coding RNAs that play important roles in a wide range of biological processes in plant growth and development. MIR397 (involved in drought, low temperature, and nitrogen and copper (Cu) starvation) and MIR408 (differentially expressed in response to environmental stresses such as copper, light, mechanical stress, dehydration, cold, reactive oxygen species, and drought) belong to conserved MIRNA families that either negatively or positively regulate their target genes. In the present study, we identified the homologs of MIR397 and MIR408 in Oryza sativa and its six wild progenitors, three non-Oryza species, and one dicot species. We analyzed the 100 kb segments harboring MIRNA homologs from 11 genomes to obtain a comprehensive view of their community evolution around these loci in the farthest (distant) relatives of rice. Our study showed that mature MIR397 and MIR408 were highly conserved among all Oryza species. Comparative genomics analyses also revealed that the microsynteny of the 100 kb region surrounding MIRNAs was only conserved in Oryza spp.; disrupted in Sorghum, maize, and wheat; and completely lost in Arabidopsis. There were deletions, rearrangements, and translocations within the 100 kb segments in Oryza spp., but the overall microsynteny of the region was maintained. The phylogenetic analyses of the precursor regions of all MIRNAs under study revealed a bimodal clade of common origin. This comparative analysis of miRNA involved in abiotic stress tolerance in plants provides a powerful tool for future Oryza research. Crop wild relatives (CWRs) offer multiple traits with potential to decrease the amount of yield loss owing to biotic and abiotic stresses. Using a comparative genomics approach, the exploration of CWRs as a source of tolerance to these stresses by understanding their evolution can be further used to leverage their yield potential.

Keywords: MIR397; MIR408; MIRNAs; Oryza; comparative genomics; crop wild relatives; microsynteny.


Conflict of interest statement

The authors declare no conflict of interest.

Figures

Figure 1
Figure 1
Genomic location of MIRNA homologs present on chromosomes of different poaceae members. Genomic location of (A) MIR397A, (B) MIR397B, and (C) MIR408 homologs present on chromosomes of different poaceae members. Pointed triangles mark the positions of respective MIRNAs on genus-specific chromosomes.
Figure 1
Figure 1
Genomic location of MIRNA homologs present on chromosomes of different poaceae members. Genomic location of (A) MIR397A, (B) MIR397B, and (C) MIR408 homologs present on chromosomes of different poaceae members. Pointed triangles mark the positions of respective MIRNAs on genus-specific chromosomes.
Figure 2
Figure 2
Multiple sequence alignment of mature MIR397 and MIR408 to detect the region of conservation and divergence. (A) Multiple sequence alignment of mature MIR397A showed that mature RNA of all poaceae members and Arabidopsis was highly conserved, except for Z. mays and T. aestivum. Similarly, multiple sequence alignment of mature MIR397A showed that mature RNA of all Oryza spp. was highly conserved. (B) Multiple sequence alignment of mature MIR408 showed that a genome-specific SNP was observed in Arabidopsis at the 1st position, where C was replaced with T. * denotes position of SNP. Osa—O. sativa; Oba—O. barthii; Ogl—O. glaberrima; Oglu—O. glumaepatula; Oru—O. rufipogon; Obr—O. brachyantha; Op1—O. punctata; Sbi—S. bicolor; Zma—Z. mays; Tae—T. aestivum; Ath—A. thaliana.
Figure 2
Figure 2
Multiple sequence alignment of mature MIR397 and MIR408 to detect the region of conservation and divergence. (A) Multiple sequence alignment of mature MIR397A showed that mature RNA of all poaceae members and Arabidopsis was highly conserved, except for Z. mays and T. aestivum. Similarly, multiple sequence alignment of mature MIR397A showed that mature RNA of all Oryza spp. was highly conserved. (B) Multiple sequence alignment of mature MIR408 showed that a genome-specific SNP was observed in Arabidopsis at the 1st position, where C was replaced with T. * denotes position of SNP. Osa—O. sativa; Oba—O. barthii; Ogl—O. glaberrima; Oglu—O. glumaepatula; Oru—O. rufipogon; Obr—O. brachyantha; Op1—O. punctata; Sbi—S. bicolor; Zma—Z. mays; Tae—T. aestivum; Ath—A. thaliana.
Figure 3
Figure 3
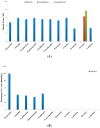
Graphical representation of (A) percentage of O. sativa homologs in 100 kb genomic segments harboring MIR397A/B conserved among O. sativa, other poaceae members, and Arabidopsis; (B) density of genes present in 100 kb genomic segments harboring MIR397A/B across different poaceae members and Arabidopsis.
Figure 3
Figure 3
Graphical representation of (A) percentage of O. sativa homologs in 100 kb genomic segments harboring MIR397A/B conserved among O. sativa, other poaceae members, and Arabidopsis; (B) density of genes present in 100 kb genomic segments harboring MIR397A/B across different poaceae members and Arabidopsis.
Figure 4
Figure 4
Graphical representation of (A) percentage of O. sativa homologs in 100 kb genomic segments harboring MIR408 conserved among O. sativa, other poaceae members, and Arabidopsis; (B) density of genes present in 100 kb genomic segments harboring MIR408 across different poaceae members and Arabidopsis.
Figure 5
Figure 5
Diagrammatic representation of microsynteny analysis of 100 kb genomic segments flanking MIR397A across different poaceae members. (A) Synteny block diagram for MIR397A with O. sativa as reference. The first column shows duplication depth at each gene locus; the second column shows the genes in reference chromosomes, and the following one show aligned collinear blocks where only match genes are displayed. The alignment among non-anchor genes was discarded in the output and was simply denoted with “||” in the multi-alignment of gene orders. (B) Circular plot showing patterns of synteny and collinearity. Os6—O. sativa chr 6; Ob6—O. barthii chr 6; Og6—O. glaberrima chr 6; Ou6—O. glumaepatula chr 6; Or6—O. rufipogon chr 6; Oa6—O. brachyantha chr 6; Op6—O. punctata chr 6; Sb4—S. bicolor chr 4; Zm3—Z. mays chr 3; Ta6A—T. aestivum chr 6A; Ta6B—T. aestivum chr 6B; Ta6D—T. aestivum chr 6D; At4—A. thaliana chr 4.
Figure 5
Figure 5
Diagrammatic representation of microsynteny analysis of 100 kb genomic segments flanking MIR397A across different poaceae members. (A) Synteny block diagram for MIR397A with O. sativa as reference. The first column shows duplication depth at each gene locus; the second column shows the genes in reference chromosomes, and the following one show aligned collinear blocks where only match genes are displayed. The alignment among non-anchor genes was discarded in the output and was simply denoted with “||” in the multi-alignment of gene orders. (B) Circular plot showing patterns of synteny and collinearity. Os6—O. sativa chr 6; Ob6—O. barthii chr 6; Og6—O. glaberrima chr 6; Ou6—O. glumaepatula chr 6; Or6—O. rufipogon chr 6; Oa6—O. brachyantha chr 6; Op6—O. punctata chr 6; Sb4—S. bicolor chr 4; Zm3—Z. mays chr 3; Ta6A—T. aestivum chr 6A; Ta6B—T. aestivum chr 6B; Ta6D—T. aestivum chr 6D; At4—A. thaliana chr 4.
Figure 6
Figure 6
Diagrammatic representation of microsynteny analysis of 100 kb genomic segments flanking MIR397B across different poaceae members. Synteny block diagram for MIR397B with Oryza sativa as reference. The first column shows duplication depth at each gene locus; the second column shows the genes in reference chromosomes, and the following ones show aligned collinear blocks where only match genes are displayed. The alignment among non-anchor genes was discarded in the output and was simply denoted with “||” in the multi-alignment of gene orders.
Figure 7
Figure 7
Diagrammatic representation of microsynteny analysis of 100 kb genomic segments flanking MIR408 across different poaceae members. Synteny block diagram for MIR408 with O. sativa as reference. The first column shows duplication depth at each gene locus; the second column shows the genes in reference chromosomes, and the following ones show aligned collinear blocks where only match genes are displayed. The alignment among non-anchor genes was discarded in the output and was simply denoted with “||” in the multi-alignment of gene orders.
Figure 8
Figure 8
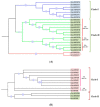
Phylogenetic relationship of MIR397 and MIR408 within poaceae members and Arabidopsis. (A) ML phylogenetic tree was constructed for the 22 MIR397 precursor and promoter (500 bp) sequences in O. sativa and its six wild relatives, S. bicolor, Z. mays, and T. aestivum. Arabidopsis was also included in the study as an outlier. Triangles denote the bootstrap values. Circles denote the bootstrap values ranging from 0.277 to 1.000. (B) ML phylogenetic tree was constructed for the 12 MIR408 precursor and promoter (500 bp) sequences in O. sativa and its six wild relatives, S. bicolor, Z. may, and T. aestivum. Arabidopsis was also included in the study as an outlier. Circles denote the bootstrap values ranging from 0.155 to 0.968. Osa—O. sativa; Oba—O. barthii; Ogl—O. glaberrima; ++++maepatula; Oru—O. rufipogon; Obr—O. brachyantha; Opu—O. punctata; Sbi—S. bicolor; Zma—Z. mays; Tae—T. aestivum; Ath—A. thaliana.
Figure 9
Figure 9
Differentially expressed MIR397 and MIR408 across different Oryza and poaceae species in tissue-specific manner. Expression pattern was obtained via qRT-PCR. Each block shows log2-fold expression in stem, leaf, root, and inflorescence.

References

    1. Kellogg E.A. Evolutionary History of the Grasses. Plant Physiol. 2001;125:1198–1205. doi: 10.1104/pp.125.3.1198. - DOI - PMC - PubMed
    1. Mammadov J., Buyyarapu R., Guttikonda S.K., Parliament K., Abdurakhmonov I.Y., Kumpatla S.P. Wild Relatives of Maize, Rice, Cotton, and Soybean: Treasure Troves for Tolerance to Biotic and Abiotic Stresses. Front. Plant Sci. 2018;9 doi: 10.3389/fpls.2018.00886. - DOI - PMC - PubMed
    1. Shanchez P., Wing R.A., Brar D. In: Genetics and Genomics of Rice. Zhang Q., Wing R., editors. Springer Science+Business Media, LLC; Berlin, Germany: 2013.
    1. Shakiba E., Eizenga G. In: Rice-Germplasm, Genetics and Improvement. Bao J., editor. IntechOpen; London, UK: 2014.
    1. Levy A.A., Feldman M. The Impact of Polyploidy on Grass Genome Evolution. Plant Physiol. 2002;130:1587–1593. doi: 10.1104/pp.015727. - DOI - PMC - PubMed

Publication types

LinkOut - more resources