

Integrated Analysis of the Fecal Metagenome and Metabolome in Bladder Cancer in a Chinese Population
- PMID: 36360204
- PMCID: PMC9690037
- DOI: 10.3390/genes13111967
Integrated Analysis of the Fecal Metagenome and Metabolome in Bladder Cancer in a Chinese Population
Abstract
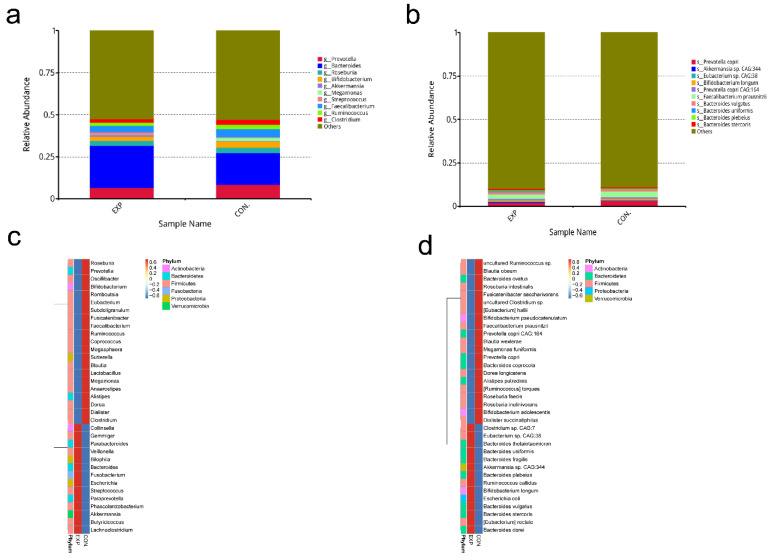
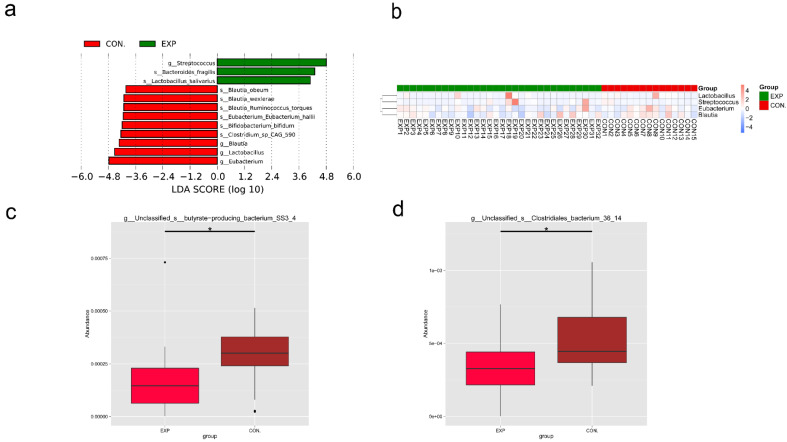
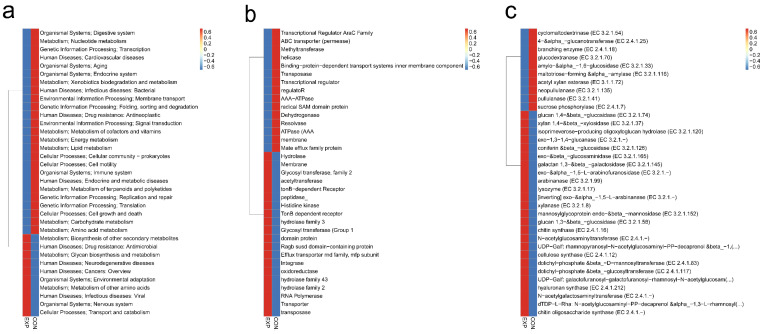
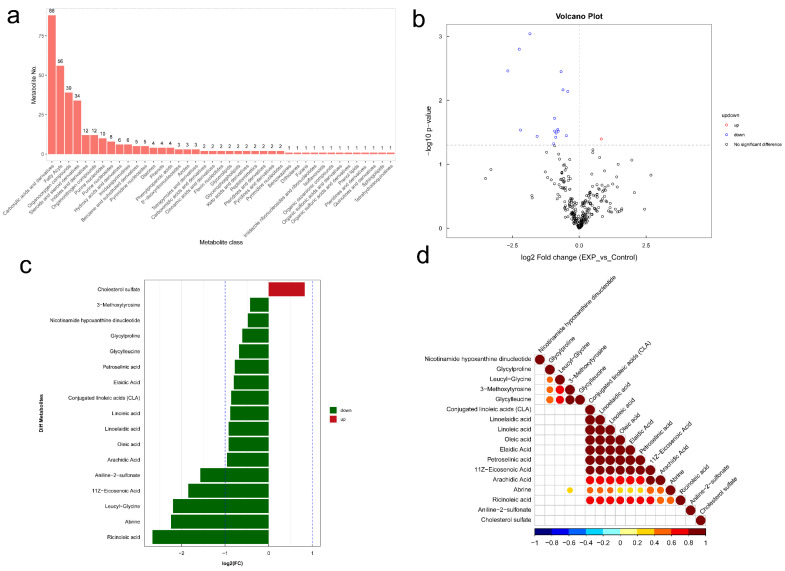
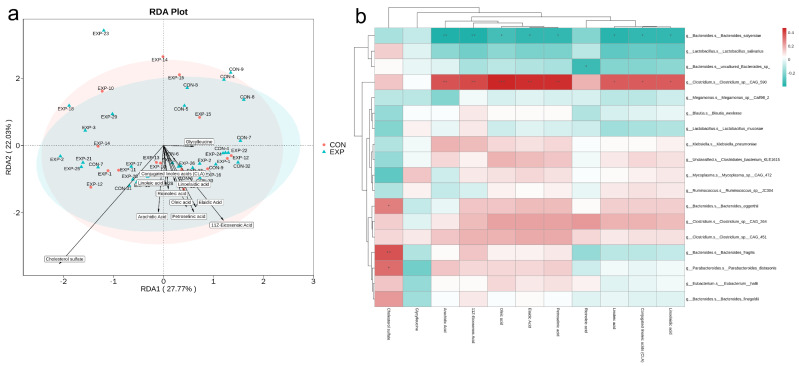
Bladder cancer (BLCA) is a common malignancy of the urinary system. The gut microbiome produces various metabolites that play functional roles in tumorigenesis and tumor progression. However, the integrative analysis of the gut microbiome and metabolome in BLCA has still been lacking. Thus, the aim of this study was to identify microbial and functional characteristics and metabolites in BLCA in a Chinese population. Metagenomics, targeted metabolomics, bioinformatics, and integrative analysis were used in fecal samples of BLCA patients and healthy individuals. We found gut microbiomes were significantly dysregulated in BLCA patients, including Bifidobacterium, Lactobacillus, Streptococcus, Blautia, and Eubacterium. We also found 11Z-eicosenoic acid, 3-methoxytyrosine, abrine, aniline-2-sulfonate, arachidic acid, conjugated linoleic acids, elaidic acid, glycylleucine, glycylproline, leucyl-glycine, linoelaidic acid, linoleic acid, nicotinamide hypoxanthine dinucleotide, oleic acid, petroselinic acid, and ricinoleic acid to be significantly decreased, while cholesterol sulfate was significantly increased in BLCA patients. Integration of metagenomics and metabolomics revealed interactions between gut microbiota and metabolites and the host. We identified the alterations of gut microbiomes and metabolites in BLCA in a Chinese population. Moreover, we preliminarily revealed the associations between specific gut microbiomes and metabolites. These findings determined potential causative links among gut dysbiosis, dysregulated metabolites, and BLCA.
Keywords: bladder cancer; gut microbiome; metabolomics; metagenomics; omics integration.
Conflict of interest statement
The authors declare no conflict of interest.
Figures
Similar articles
-
Pivotal interplays between fecal metabolome and gut microbiome reveal functional signatures in cerebral ischemic stroke.J Transl Med. 2022 Oct 8;20(1):459. doi: 10.1186/s12967-022-03669-0. J Transl Med. 2022. PMID: 36209079 Free PMC article.
-
Recent advances in the metabolomic study of bladder cancer.Expert Rev Proteomics. 2019 Apr;16(4):315-324. doi: 10.1080/14789450.2019.1583105. Epub 2019 Feb 26. Expert Rev Proteomics. 2019. PMID: 30773067 Free PMC article. Review.
-
Microbiome-metabolomic analysis of the impact of Zizyphus jujuba cv. Muzao polysaccharides consumption on colorectal cancer mice fecal microbiota and metabolites.Int J Biol Macromol. 2019 Jun 15;131:1067-1076. doi: 10.1016/j.ijbiomac.2019.03.175. Epub 2019 Mar 26. Int J Biol Macromol. 2019. PMID: 30926487
-
Multi-omics analyses reveal the specific changes in gut metagenome and serum metabolome of patients with polycystic ovary syndrome.Front Microbiol. 2022 Oct 19;13:1017147. doi: 10.3389/fmicb.2022.1017147. eCollection 2022. Front Microbiol. 2022. PMID: 36338055 Free PMC article.
-
An Integrated Outlook on the Metagenome and Metabolome of Intestinal Diseases.Diseases. 2015 Nov 6;3(4):341-359. doi: 10.3390/diseases3040341. Diseases. 2015. PMID: 28943629 Free PMC article. Review.
Cited by
-
Targeted plasma metabolomics reveals potential biomarkers of the elderly with mild cognitive impairment in Qingdao rural area.Front Aging Neurosci. 2024 Dec 18;16:1511437. doi: 10.3389/fnagi.2024.1511437. eCollection 2024. Front Aging Neurosci. 2024. PMID: 39744523 Free PMC article.
-
Genetically Predicted 3-Methoxytyrosine Mediates the Causal Association between Fibroblast Growth Factor 21 and Glioblastoma Multiforme.J Cancer. 2025 Jan 1;16(2):680-688. doi: 10.7150/jca.98035. eCollection 2025. J Cancer. 2025. PMID: 39744501 Free PMC article.
-
A Large Genetic Causal Analysis of the Gut Microbiota and Urological Cancers: A Bidirectional Mendelian Randomization Study.Nutrients. 2023 Sep 21;15(18):4086. doi: 10.3390/nu15184086. Nutrients. 2023. PMID: 37764869 Free PMC article.
-
Genetically determined metabolites in allergic conjunctivitis: A Mendelian randomization study.World Allergy Organ J. 2024 Mar 31;17(4):100894. doi: 10.1016/j.waojou.2024.100894. eCollection 2024 Apr. World Allergy Organ J. 2024. PMID: 38590722 Free PMC article.
-
From dysbiosis to precision therapy: decoding the gut-bladder axis in bladder carcinogenesis.Front Oncol. 2025 Jul 10;15:1630726. doi: 10.3389/fonc.2025.1630726. eCollection 2025. Front Oncol. 2025. PMID: 40708946 Free PMC article. Review.
References
Publication types
MeSH terms
LinkOut - more resources
Full Text Sources
Medical
