

Genome-Wide Association Study of Growth Traits in a Four-Way Crossbred Pig Population
- PMID: 36360227
- PMCID: PMC9689869
- DOI: 10.3390/genes13111990
Genome-Wide Association Study of Growth Traits in a Four-Way Crossbred Pig Population
Abstract
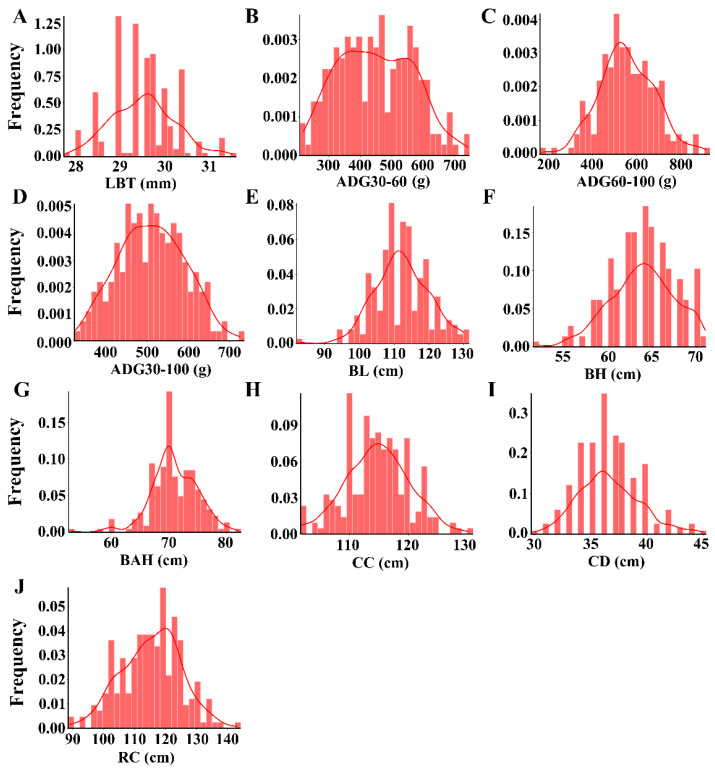
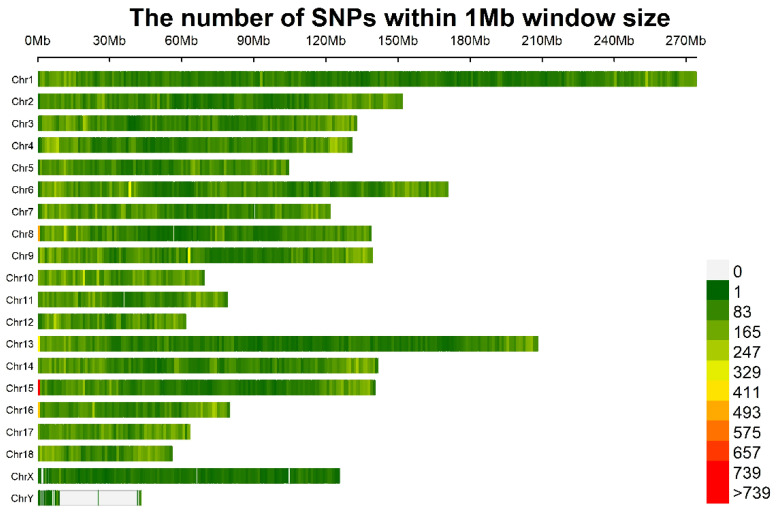
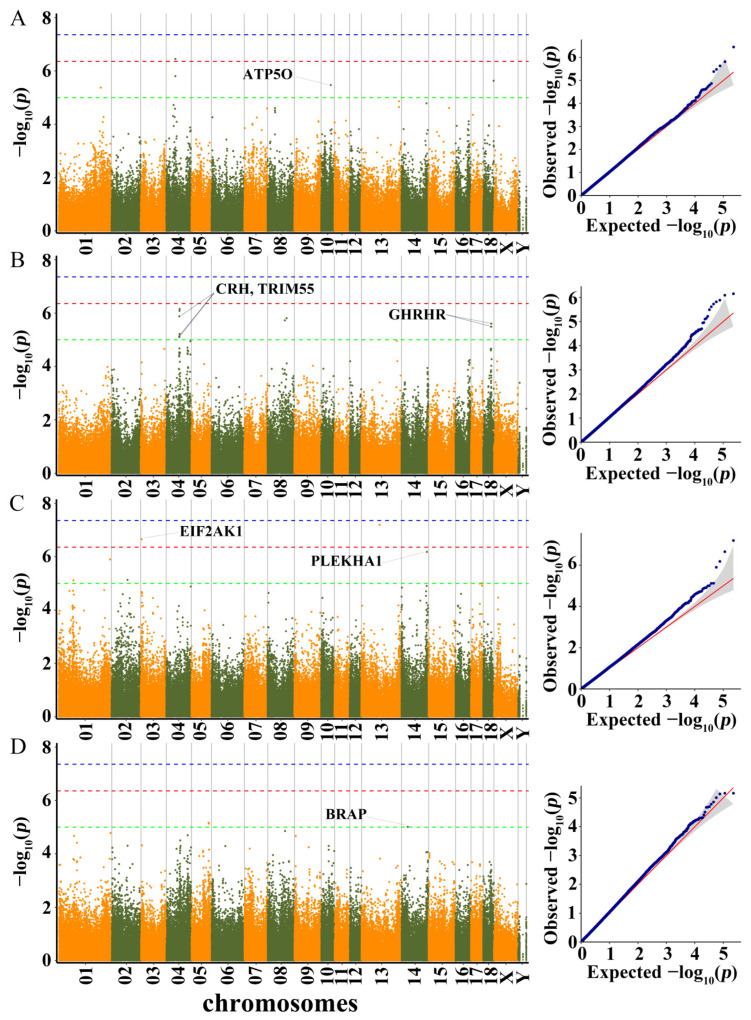
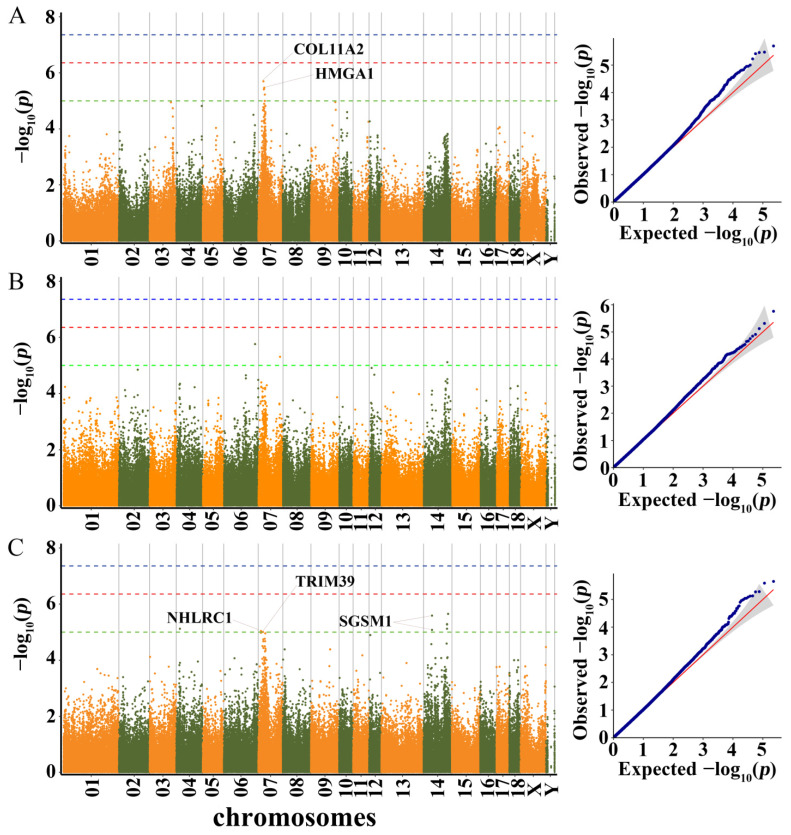
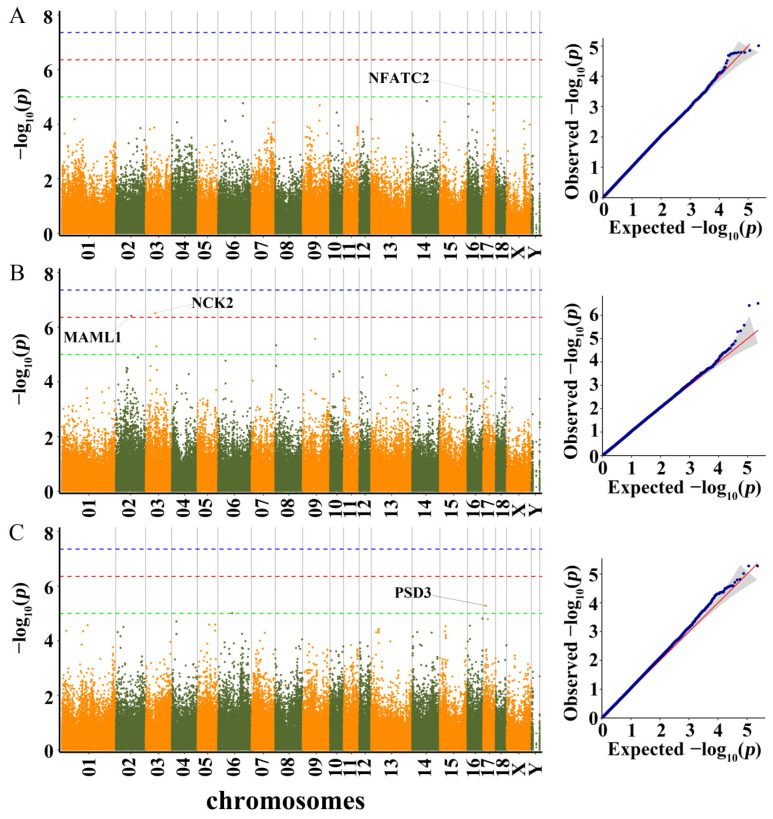
Growth traits are crucial economic traits in the commercial pig industry and have a substantial impact on pig production. However, the genetic mechanism of growth traits is not very clear. In this study, we performed a genome-wide association study (GWAS) based on the specific-locus amplified fragment sequencing (SLAF-seq) to analyze ten growth traits on 223 four-way intercross pigs. A total of 227,921 highly consistent single nucleotide polymorphisms (SNPs) uniformly dispersed throughout the entire genome were used to conduct GWAS. A total of 53 SNPs were identified for ten growth traits using the mixed linear model (MLM), of which 18 SNPs were located in previously reported quantitative trait loci (QTL) regions. Two novel QTLs on SSC4 and SSC7 were related to average daily gain from 30 to 60 kg (ADG30-60) and body length (BL), respectively. Furthermore, 13 candidate genes (ATP5O, GHRHR, TRIM55, EIF2AK1, PLEKHA1, BRAP, COL11A2, HMGA1, NHLRC1, SGSM1, NFATC2, MAML1, and PSD3) were found to be associated with growth traits in pigs. The GWAS findings will enhance our comprehension of the genetic architecture of growth traits. We suggested that these detected SNPs and corresponding candidate genes might provide a biological foundation for improving the growth and production performance of pigs in swine breeding.
Keywords: SLAF-seq; SNPs; genes; genome-wide association study; growth traits; pigs.
Conflict of interest statement
The authors declared no conflict of interest.
Figures
Similar articles
-
Genome-wide identification of quantitative trait loci and candidate genes for seven carcass traits in a four-way intercross porcine population.BMC Genomics. 2024 Jun 10;25(1):582. doi: 10.1186/s12864-024-10484-y. BMC Genomics. 2024. PMID: 38858624 Free PMC article.
-
Genome-wide association study identifying genetic variants associated with carcass backfat thickness, lean percentage and fat percentage in a four-way crossbred pig population using SLAF-seq technology.BMC Genomics. 2022 Aug 15;23(1):594. doi: 10.1186/s12864-022-08827-8. BMC Genomics. 2022. PMID: 35971078 Free PMC article.
-
An association study using imputed whole-genome sequence data identifies novel significant loci for growth-related traits in a Duroc × Erhualian F2 population.J Anim Breed Genet. 2019 May;136(3):217-228. doi: 10.1111/jbg.12389. Epub 2019 Mar 14. J Anim Breed Genet. 2019. PMID: 30869175
-
Genome-wide association studies identify the loci for 5 exterior traits in a Large White × Minzhu pig population.PLoS One. 2014 Aug 4;9(8):e103766. doi: 10.1371/journal.pone.0103766. eCollection 2014. PLoS One. 2014. PMID: 25090094 Free PMC article.
-
Allelic to genome wide perspectives of swine genetic variation to litter size and its component traits.Mol Biol Rep. 2023 Apr;50(4):3705-3721. doi: 10.1007/s11033-022-08168-5. Epub 2023 Jan 16. Mol Biol Rep. 2023. PMID: 36642776 Review.
Cited by
-
Application of GWAS and mGWAS in Livestock and Poultry Breeding.Animals (Basel). 2024 Aug 16;14(16):2382. doi: 10.3390/ani14162382. Animals (Basel). 2024. PMID: 39199916 Free PMC article. Review.
-
Genome-Wide Association Studies of Body Weight and Average Daily Gain in Chinese Dongliao Black Pigs.Int J Mol Sci. 2025 Apr 7;26(7):3453. doi: 10.3390/ijms26073453. Int J Mol Sci. 2025. PMID: 40244387 Free PMC article.
-
Unveiling the Genetic Mechanism of Meat Color in Pigs through GWAS, Multi-Tissue, and Single-Cell Transcriptome Signatures Exploration.Int J Mol Sci. 2024 Mar 26;25(7):3682. doi: 10.3390/ijms25073682. Int J Mol Sci. 2024. PMID: 38612491 Free PMC article.
-
Integrative Transcriptomic and Metabolomic Analysis of Muscle and Liver Reveals Key Molecular Pathways Influencing Growth Traits in Zhedong White Geese.Animals (Basel). 2025 May 6;15(9):1341. doi: 10.3390/ani15091341. Animals (Basel). 2025. PMID: 40362156 Free PMC article.
-
Genome-wide identification of quantitative trait loci and candidate genes for seven carcass traits in a four-way intercross porcine population.BMC Genomics. 2024 Jun 10;25(1):582. doi: 10.1186/s12864-024-10484-y. BMC Genomics. 2024. PMID: 38858624 Free PMC article.
References
-
- Zhang H., Zhuang Z., Yang M., Ding R., Quan J., Zhou S., Gu T., Xu Z., Zheng E., Cai G., et al. Genome-Wide Detection of Genetic Loci and Candidate Genes for Body Conformation Traits in Duroc × Landrace × Yorkshire Crossbred Pigs. Front. Genet. 2021;12:664343. doi: 10.3389/fgene.2021.664343. - DOI - PMC - PubMed
Publication types
MeSH terms
LinkOut - more resources
Full Text Sources
Miscellaneous
