

Epidemiological Patterns of Cannabis- and Substance- Related Congenital Uronephrological Anomalies in Europe: Geospatiotemporal and Causal Inferential Study
- PMID: 36360648
- PMCID: PMC9657099
- DOI: 10.3390/ijerph192113769
Epidemiological Patterns of Cannabis- and Substance- Related Congenital Uronephrological Anomalies in Europe: Geospatiotemporal and Causal Inferential Study
Abstract
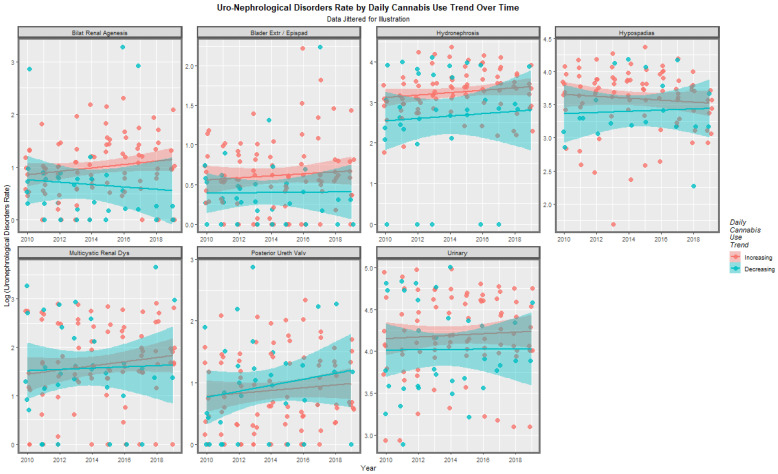
Introduction: Recent reports linking prenatal and community cannabis exposure to elevated uronephrological congenital anomaly (UCA) rates (UCAR's) raise the question of its European epidemiology given recent increases in community cannabinoid penetration there.
Methods: UCAR data from Eurocat. Drug use data from European Monitoring Centre for Drugs and Drug Addiction. Income from World bank.
Results: UCAR increased across Spain, Netherlands, Poland and France. UCAR's and cannabis resin THC increased simultaneously in France, Spain, Netherlands and Bulgaria. At bivariate analysis all UCA's were related to cannabis herb and resin THC concentrations. All UCAR's were bivariately related to cannabis metrics ordered by median minimum E-value (mEV) as hypospadias > multicystic renal disease > bilateral renal agenesis > UCA's > hydronephrosis > posterior urethral valve > bladder exstrophy/epispadias. At inverse probability weighted multivariable analysis terms including cannabis were significant for the following series of anomalies: UCA's, multicystic renal disease, bilateral renal agenesis, hydronephrosis, congenital posterior urethral valves from P = 1.91 × 10⁻⁵, 2.61 × 10⁻⁸, 4.60 × 10⁻¹⁵, 4.60 × 10⁻¹⁵ and 2.66 × 10⁻¹⁰. At geospatial analysis the same series of UCA's were significantly related to cannabis from P = 7.84 × 10⁻¹⁵, 7.72 × 10⁻⁵, 0.0023, 6.95 × 10⁻⁵, and 8.82 × 10⁻⁵. 45/51 (88.2%) of E-value estimates and 31/51 (60.8%) of mEV's >9.
Conclusion: Analysis confirms a close relationship between cannabis metrics and all seven UCA's and fulfill formal criteria for quantitative causal inference. Given the exponential cannabinoid genotoxicity dose-response relationship results provide a powerful stimulus to constrain community cannabinoid exposure including protection of the food chain to preserve the genome and epigenome of coming generations.
Keywords: alcohol; cancer; cancerogenesis; cannabinoid; cannabis; epigenotoxicity; genotoxicity; mutagenesis; oncogenesis; tobacco; transgenerational inheritance.
Conflict of interest statement
The authors declare that they have no competing interests.
Figures


Similar articles
-
Clinical Epigenomic Explanation of the Epidemiology of Cannabinoid Genotoxicity Manifesting as Transgenerational Teratogenesis, Cancerogenesis and Aging Acceleration.Int J Environ Res Public Health. 2023 Feb 14;20(4):3360. doi: 10.3390/ijerph20043360. Int J Environ Res Public Health. 2023. PMID: 36834053 Free PMC article. Review.
-
European Epidemiological Patterns of Cannabis- and Substance-Related Body Wall Congenital Anomalies: Geospatiotemporal and Causal Inferential Study.Int J Environ Res Public Health. 2022 Jul 25;19(15):9027. doi: 10.3390/ijerph19159027. Int J Environ Res Public Health. 2022. PMID: 35897396 Free PMC article.
-
Cannabis- and Substance-Related Epidemiological Patterns of Chromosomal Congenital Anomalies in Europe: Geospatiotemporal and Causal Inferential Study.Int J Environ Res Public Health. 2022 Sep 6;19(18):11208. doi: 10.3390/ijerph191811208. Int J Environ Res Public Health. 2022. PMID: 36141481 Free PMC article.
-
European Epidemiological Patterns of Cannabis- and Substance-Related Congenital Neurological Anomalies: Geospatiotemporal and Causal Inferential Study.Int J Environ Res Public Health. 2022 Dec 27;20(1):441. doi: 10.3390/ijerph20010441. Int J Environ Res Public Health. 2022. PMID: 36612763 Free PMC article.
-
Epigenomic and Other Evidence for Cannabis-Induced Aging Contextualized in a Synthetic Epidemiologic Overview of Cannabinoid-Related Teratogenesis and Cannabinoid-Related Carcinogenesis.Int J Environ Res Public Health. 2022 Dec 13;19(24):16721. doi: 10.3390/ijerph192416721. Int J Environ Res Public Health. 2022. PMID: 36554603 Free PMC article. Review.
Cited by
-
Cannabis- and Substance-Related Carcinogenesis in Europe: A Lagged Causal Inferential Panel Regression Study.J Xenobiot. 2023 Jul 18;13(3):323-385. doi: 10.3390/jox13030024. J Xenobiot. 2023. PMID: 37489337 Free PMC article.
-
Perturbation of 3D nuclear architecture, epigenomic aging and dysregulation, and cannabinoid synaptopathy reconfigures conceptualization of cannabinoid pathophysiology: part 2-Metabolome, immunome, synaptome.Front Psychiatry. 2023 Oct 3;14:1182536. doi: 10.3389/fpsyt.2023.1182536. eCollection 2023. Front Psychiatry. 2023. PMID: 37854446 Free PMC article. Review.
-
Perturbation of 3D nuclear architecture, epigenomic dysregulation and aging, and cannabinoid synaptopathy reconfigures conceptualization of cannabinoid pathophysiology: part 1-aging and epigenomics.Front Psychiatry. 2023 Sep 5;14:1182535. doi: 10.3389/fpsyt.2023.1182535. eCollection 2023. Front Psychiatry. 2023. PMID: 37732074 Free PMC article. Review.
-
Prenatal cannabinoid exposure: why expecting individuals should take a pregnancy pause from using cannabinoid products.Front Pediatr. 2023 Oct 11;11:1278227. doi: 10.3389/fped.2023.1278227. eCollection 2023. Front Pediatr. 2023. PMID: 37886232 Free PMC article. Review.
-
Clinical Epigenomic Explanation of the Epidemiology of Cannabinoid Genotoxicity Manifesting as Transgenerational Teratogenesis, Cancerogenesis and Aging Acceleration.Int J Environ Res Public Health. 2023 Feb 14;20(4):3360. doi: 10.3390/ijerph20043360. Int J Environ Res Public Health. 2023. PMID: 36834053 Free PMC article. Review.
References
-
- Reece A.S., Hulse G.K. Geotemporospatial and Causal Inferential Epidemiological Overview and Survey of USA Cannabis, Cannabidiol and Cannabinoid Genotoxicity Expressed in Cancer Incidence 2003–2017: Part 1–Continuous Bivariate Analysis. Arch. Public Health. 2022;80:99–133. doi: 10.1186/s13690-022-00811-8. - DOI - PMC - PubMed
-
- Reece A.S., Hulse G.K. Geotemporospatial and Causal Inferential Epidemiological Overview and Survey of USA Cannabis, Cannabidiol and Cannabinoid Genotoxicity Expressed in Cancer Incidence 2003–2017: Part 2–Categorical Bivariate Analysis and Attributable Fractions. Arch. Public Health. 2022;80:100–135. doi: 10.1186/s13690-022-00812-7. - DOI - PMC - PubMed
-
- Reece A.S., Hulse G.K. Geotemporospatial and Causal Inferential Epidemiological Overview and Survey of USA Cannabis, Cannabidiol and Cannabinoid Genotoxicity Expressed in Cancer Incidence 2003–2017: Part 3–Spatiotemporal, Multivariable and Causal Inferential Pathfinding and Exploratory Analyses of Prostate and Ovarian Cancers. Arch. Public Health. 2022;80:100–136. - PMC - PubMed
MeSH terms
Substances
Supplementary concepts
LinkOut - more resources
Full Text Sources
