. 2022 Oct 24;23(21):12817.
doi: 10.3390/ijms232112817.

Dual-Functionalized Nanoliposomes Achieve a Synergistic Chemo-Phototherapeutic Effect

Affiliations

Dual-Functionalized Nanoliposomes Achieve a Synergistic Chemo-Phototherapeutic Effect

Ana Lazaro-Carrillo et al. Int J Mol Sci. .

Abstract

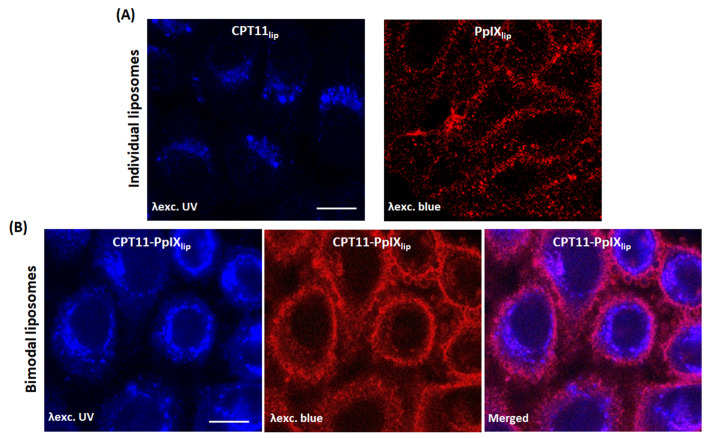
The enhancement of photodynamic therapy (PDT) effectiveness by combining it with other treatment modalities and improved drug delivery has become an interesting field in cancer research. We have prepared and characterized nanoliposomes containing the chemotherapeutic drug irinotecan (CPT11lip), the photodynamic agent protoporphyrin IX (PpIXlip), or their combination (CPT11-PpIXlip). The effects of individual and bimodal (chemo-phototherapeutic) treatments on HeLa cells have been studied by a combination of biological and photophysical studies. Bimodal treatments show synergistic cytotoxic effects on HeLa cells at relatively low doses of PpIX/PDT and CPT11. Mechanistic cell inactivation studies revealed mitotic catastrophe, apoptosis, and senescence contributions. The enhanced anticancer activity is due to a sustained generation of reactive oxygen species, which increases the number of double-strand DNA breaks. Bimodal chemo-phototherapeutic liposomes may have a very promising future in oncological therapy, potentially allowing a reduction in the CPT11 concentration required to achieve a therapeutic effect and overcoming resistance to individual cancer treatments.

Keywords: bimodal-functionalized nanoliposomes; chemo-phototherapy; double-strand DNA break; irinotecan; photodynamic therapy; protoporphyrin IX; reactive oxygen species; subcellular location; synergistic effect; time-lapse microscopy.


Conflict of interest statement

The authors declare no conflict of interest.

Figures

Figure 1
Figure 1
Cell viability of HeLa cells treated with unimodal and bimodal liposomal formulations in darkness and light conditions. Irradiation was performed with a red-light dose of 2 J·cm−2. Cell viability was analyzed by MTT assay performed 24 h after each treatment. p values < 0.001 (***).
Figure 2
Figure 2
HeLa cell responses at different post-treatment times. (A) TOP (ad): Treated and non-fixed cells visualized under differential interference contrast (DIC) microscopy after 12 h. MIDDLE (eh): Indirect immunofluorescence (IF) for α-tubulin of microtubules (green) and H-33258 counterstaining of DNA (blue) in control or treated cells fixed 12 h after irradiation; the numbers refer to the Mitotic Index (MI) and aberrant mitosis percentage in the same samples. BOTTOM (il): Treated cells were fixed 24 h after irradiation and stained with neutral red (NR). Arrowheads show apoptotic morphologies, arrows mark mitosis and asterisks indicate aberrant mitosis. Bar scale: 25 μm and 5 μm in magnifications in all panels. (B) Cell cycle analyzed by flow cytometry revealed by propidium iodide (PI) in photodynamic treated cells at 12, 24, and 72 h after irradiation. (C) Effect of photodynamic treatment on HeLa cells five days after irradiation. Analysis of senescent cells by senescence-associated β-galactosidase activity (SA-β-gal) in (i) control cells, cells incubated with (ii) CPT11lip, (iii) PpIXlip, or (iv) CPT11-PpIXlip. Arrows show senescent cells. The percentage of positive cells for the SA-β-gal assay relative to the total number of cells (alive plus dead cells) is indicated. Scale bar: 10 µm. (D) Cell viability was analyzed by MTT assay performed one or five days after irradiation. (E) Cellular morphology of cells incubated with CPT11lip (i), PpIXlip (ii), or CPT11-PpIXlip (iii) visualized directly under differential interference contrast (DIC) microscope ten days after irradiation. The arrow shows senescent cells and the asterisk marks cells undergoing division. Scale bar: 50 μm. p values < 0.05 (*) and <0.001 (***).
Figure 3
Figure 3
Analysis of apoptotic HeLa cell death. (A) Representative images of indirect immunofluorescence for H-33258 counterstaining of DNA (blue), cytochrome c (Cyt. c; green), cleaved caspase-3 (Casp. 3; red), and in control or treated cells 4 h after irradiation. Scale bar: 10 µm. (B) Flow cytometry histograms of annexin-V-FITC (Annexin.V-FITC) and propidium iodide (PI) detection in control cells or incubated with CPT11lip, PpIXlip, or bimodal liposomes CPT11-PpIXlip 24 h after irradiation. (C) Analysis of unimodal and bimodal liposome treatments of HeLa cells by time-lapse microscopy. Video frames of control and treated cells with CPT11lip, PpIXlip, or bimodal liposomes at 0, 12, and 24 h after irradiation. Scale bar: 25 µm.
Figure 4
Figure 4
Subcellular location of CPT11 and PpIX on HeLa cells. (A) Representative images by confocal microscopy of drug location into cells incubated with the individual (TOP) or (B) bimodal liposomes (BOTTOM). Scale bar: 10 μm.
Figure 5
Figure 5
Action mechanisms of the different photodynamic treatments. (A) Representative images of indirect immunofluorescence for γ-H2AX (green) and H-33258 counterstaining of DNA (blue) in control or photodynamic treated cells 72 h after irradiation and the percentage of cells with double-strand DNA breaks. Scale bar: 20 µm. (B,C) Representative images of reactive oxygen species (ROS) generation in control cells and cells submitted to the different photodynamic treatments, analyzed by the DCFH-DA probe 2 h (B) and 24 h (C) after irradiation. Cells were visualized under phase contrast microscopy or fluorescence microscopy for the DCFH-DA probe (green). Scale bar: 50 µm.

References

    1. Baskaran R., Lee J., Yang S.G. Clinical development of photodynamic agents and therapeutic applications. Biomater. Res. 2018;26:22–25. doi: 10.1186/s40824-018-0140-z. - DOI - PMC - PubMed
    1. Shams M., Owczarczak B., Manderscheid-Kern P., Bellnier D.A., Gollnick S.O. Development of photodynamic therapy regimens that control primary tumor growth and inhibit secondary disease. Cancer Immunol. Immunother. 2015;64:287–297. doi: 10.1007/s00262-014-1633-9. - DOI - PMC - PubMed
    1. Spring B.Q., Rizvi I., Xu N., Hasan T. The role of photodynamic therapy in overcoming cancer drug resistance. Photochem. Photobiol. Sci. 2015;14:1476–1491. doi: 10.1039/C4PP00495G. - DOI - PMC - PubMed
    1. Gunaydin G., Gedik M.E., Ayan S. Photodynamic Therapy for the Treatment and Diagnosis of Cancer-A Review of the Current Clinical Status. Front Chem. 2021;9:686303. doi: 10.3389/fchem.2021.686303. - DOI - PMC - PubMed
    1. Yang Y., Mu J., Xing B. Photoactivated drug delivery and bioimaging. Wiley Interdiscip. Rev. Nanomed. Nanobiotechnol. 2017;9:e1408. doi: 10.1002/wnan.1408. - DOI - PubMed

LinkOut - more resources