. 2022 Oct 27;23(21):13035.
doi: 10.3390/ijms232113035.

NLRP3-Mediated Piezo1 Upregulation in ACC Inhibitory Parvalbumin-Expressing Interneurons Is Involved in Pain Processing after Peripheral Nerve Injury

Affiliations

NLRP3-Mediated Piezo1 Upregulation in ACC Inhibitory Parvalbumin-Expressing Interneurons Is Involved in Pain Processing after Peripheral Nerve Injury

Qiao-Yun Li et al. Int J Mol Sci. .

Abstract

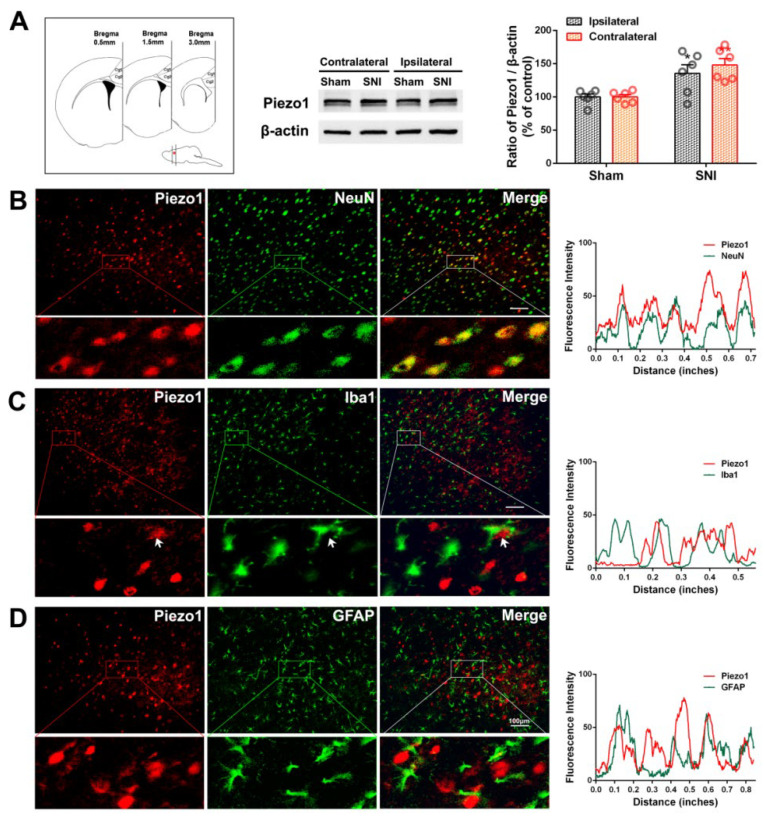
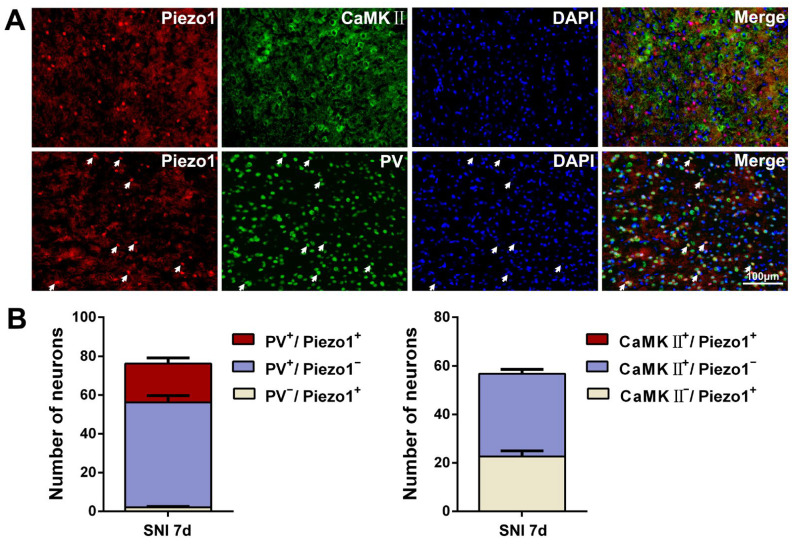
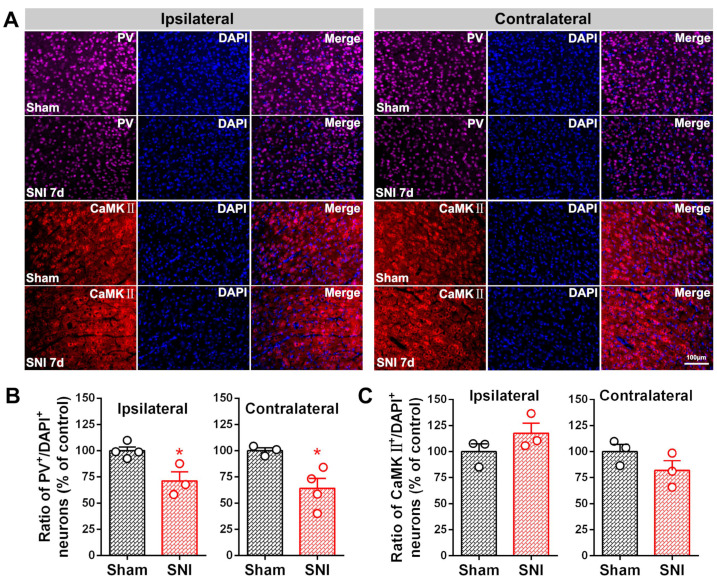
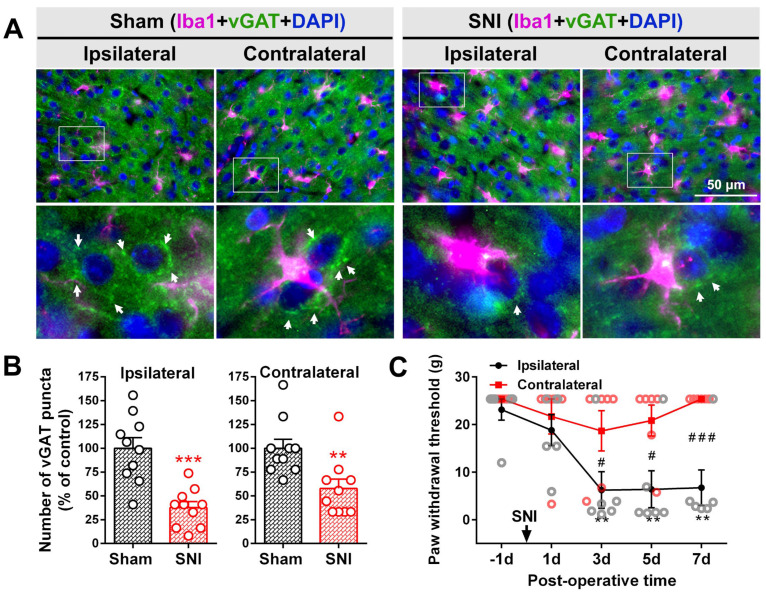
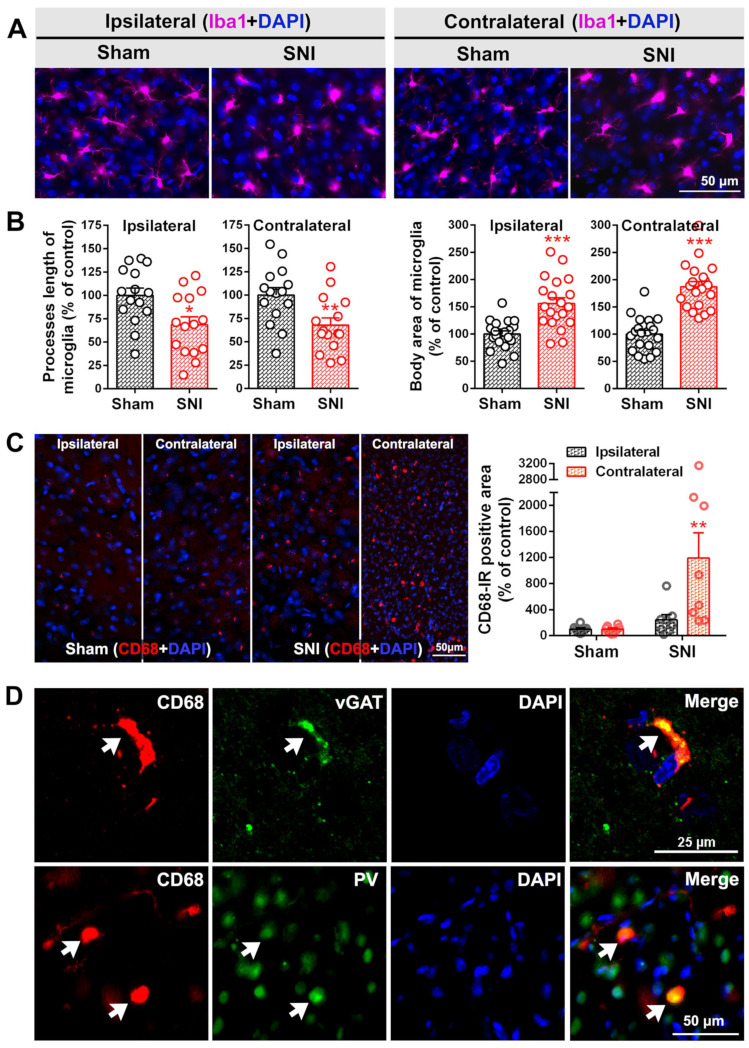
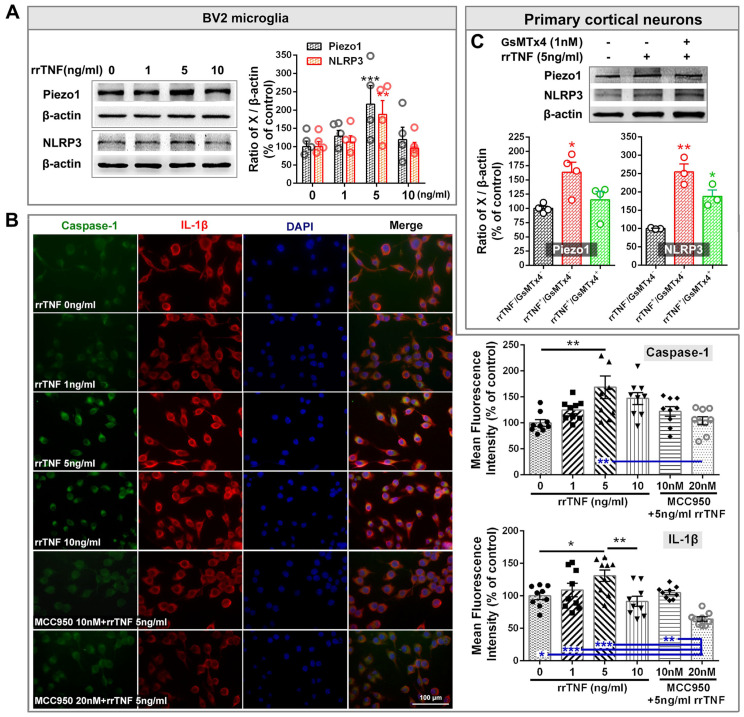
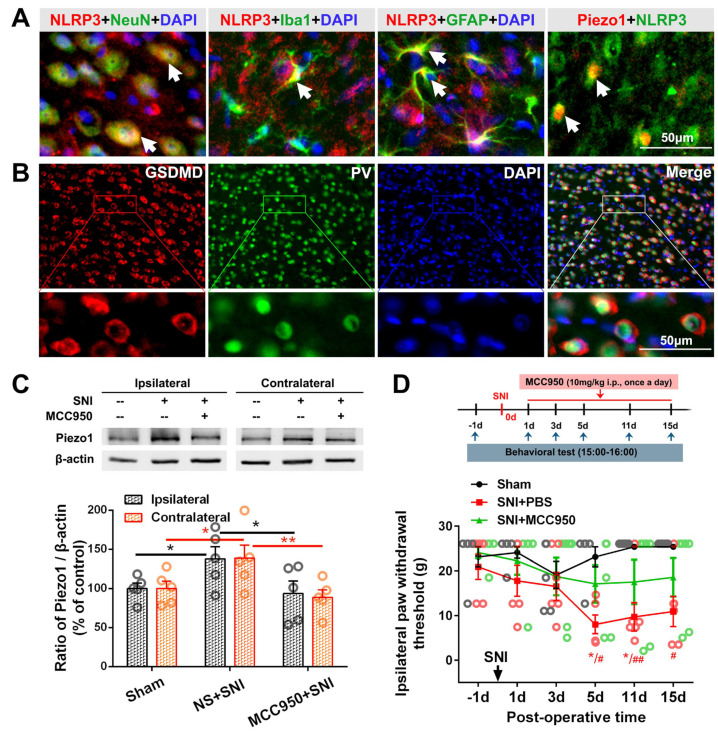
The anterior cingulate cortex (ACC) is particularly critical for pain information processing. Peripheral nerve injury triggers neuronal hyper-excitability in the ACC and mediates descending facilitation to the spinal dorsal horn. The mechanically gated ion channel Piezo1 is involved in the transmission of pain information in the peripheral nervous system. However, the pain-processing role of Piezo1 in the brain is unknown. In this work, we found that spared (sciatic) nerve injury (SNI) increased Piezo1 protein levels in inhibitory parvalbumin (PV)-expressing interneurons (PV-INs) but not in glutaminergic CaMKⅡ+ neurons, in the bilateral ACC. A reduction in the number of PV-INs but not in the number of CaMKⅡ+ neurons and a significant reduction in inhibitory synaptic terminals was observed in the SNI chronic pain model. Further, observation of morphological changes in the microglia in the ACC showed their activated amoeba-like transformation, with a reduction in process length and an increase in cell body area. Combined with the encapsulation of Piezo1-positive neurons by Iba1+ microglia, the loss of PV-INs after SNI might result from phagocytosis by the microglia. In cellular experiments, administration of recombinant rat TNF-α (rrTNF) to the BV2 cell culture or ACC neuron primary culture elevated the protein levels of Piezo1 and NOD-like receptor (NLR) family pyrin domain containing 3 (NLRP3). The administration of the NLRP3 inhibitor MCC950 in these cells blocked the rrTNF-induced expression of caspase-1 and interleukin-1β (key downstream factors of the activated NLRP3 inflammasome) in vitro and reversed the SNI-induced Piezo1 overexpression in the ACC and alleviated SNI-induced allodynia in vivo. These results suggest that NLRP3 may be the key factor in causing Piezo1 upregulation in SNI, promoting an imbalance between ACC excitation and inhibition by inducing the microglial phagocytosis of PV-INs and, thereby, facilitating spinal pain transmission.

Keywords: NLRP3; Piezo1; anterior cingulate cortex; neuropathic pain; parvalbumin interneuron.


Conflict of interest statement

The authors declare no conflict to interest.

Figures

Figure 1
Figure 1
SNI induces Piezo1 overexpression in ACC neurons. (A) SNI-induced bilateral expression of Piezo1 in the ACC. Left, Cg1 and Cg2 tissues were used for Western blotting. Coronal dissection was performed 3.0–0.5 mm anterior to the Bregma. A representative Western blot of Piezo1 expression in the bilateral ACC is shown in the middle. The protein quantification results from Western blotting are shown on the right. Significant differences in Piezo1 expression were observed on both sides of the ACC 7 d after SNI. * p-value < 0.05, ** p-value < 0.01 versus the sham group (two-way ANOVA). (BD) Representative double immunofluorescence staining showing the overlap (yellow) of Piezo1-IR (red) with neuronal marker NeuN (green), but not with microglial marker Iba1 (green) and astrocyte marker GFAP (green), 7 d after SNI. The arrowhead in (C) indicates Iba1-IR surrounding or partially overlapping Piezo1-IR. Scale bar = 50 μm. The fluorescence intensity curves for red and green signals in the boxed areas are shown on the right side for each group.
Figure 2
Figure 2
SNI-induced Piezo1 is preferentially expressed in ACC PV-INs. (A) Representative double staining image showing the overlap (white arrows) of Piezo1-IR (red) with PV (inhibitory interneuron marker, green, below), but not with CaMK II (glutamate neuronal marker, green, top), 7 d after SNI. The color of co-localization is yellow. Blue fluorescence is from DAPI, a nuclear counterstain. Scale bar = 100 μm. (B) Quantitative analysis of Piezo1-IR neurons co-localized with PV-IR and CaMKⅡ-IR neurons.
Figure 3
Figure 3
SNI triggers a reduction in the number of ACC inhibitory PV-INs. (A) Representative immunofluorescence staining image showing PV-IR (magenta) and CaMKⅡ-IR (red) neurons in the bilateral ACC in both sham and SNI rat groups. Blue fluorescence is from DAPI, a nuclear counterstain. Scale bar = 100 μm. Quantitative analysis for the percentages of (B) PV-IR (PV+) and (C) CaMKⅡ-IR (CaMKⅡ+) neurons. * p-value < 0.05 versus the sham (unpaired t test).
Figure 4
Figure 4
SNI triggers the loss of inhibitory synaptic terminals in the bilateral ACC. (A) Representative double immunofluorescence staining image showing somatic vGAT puncta-IR (inhibitory synaptic terminal marker, green) in the sham and SNI groups and the somatic adhesion of Iba1-IR (microglial marker, magenta) in the bilateral ACC. Scale bar = 50 μm. The enlarged image in the white box is shown below and the white arrow shows the vGAT puncta signal. Blue fluorescence is from DAPI, a nuclear counterstain. (B) Comparison of the number of vGAT-IR puncta in the bilateral ACC of sham and SNI groups. ** p-value < 0.01, *** p-value < 0.001 versus the sham (unpaired t test). (C) Changes in the bilateral mechanical paw withdrawal thresholds of SNI rats. Significant differences were observed in the threshold for the ipsilateral paw on PO days 3, 5, and 7 (n = 6). ** p-value < 0.01 versus PO day −1 (Dunn’s multiple comparisons test) or # p-value < 0.05, ### p-value < 0.001 versus the contralateral side (multiple t test).
Figure 5
Figure 5
SNI activates the morphological transformation of microglia into amoeba-like cells. (A) Representative immunofluorescence staining image of Iba1-IR (microglial marker, magenta) in the bilateral ACC of sham and SNI groups. Scale bar = 50 μm. (B) Comparison of the process lengths and cell body areas of microglia in the bilateral ACC of sham and SNI groups. * p-value < 0.05, ** p-value < 0.01, *** p-value < 0.001 versus the sham group (unpaired t test). (C) Left: representative immunofluorescence staining image showing CD68-IR in the bilateral ACC in both sham and SNI rats. Scale bar = 50 μm. Right: quantification of the CD68 fluorescence signals in both groups. ** p-value < 0.01 versus the sham group (two-way ANOVA). (D) White arrow heads indicate the co-localization of CD68-IR (red) with that of vGAT (green, top) and PV (green, below) 7d post SNI by double staining. Scale bar = 25 μm in the top line; 50 μm in the bottom line. Blue fluorescence in (A, C and D) is from DAPI, a nuclear counterstain.
Figure 6
Figure 6
The effect of recombinant rat TNF-α (rrTNF) on the expression levels of Piezo1 and NLRP3 in cellular experiments. (A) A representative Western blot showing Piezo1 and NLRP3 protein levels after the treatment of BV2 cells with different doses of rrTNF (0, 1, 5, and 10 ng/mL) is presented on the left. The protein quantifications are shown on the right. ** p-value < 0.01, *** p-value < 0.001 versus the control (0 ng/mL) group (two-way ANOVA). (B) Left: Representative double staining showing changes in the immunofluorescence intensities of caspase-1 (green) and IL-1β (red) following treatment of cultured BV2 cells with different doses of rrTNF (0, 1, 5, and 10 ng/mL) and the effect of the NLRP3 inhibitor MCC950 on the rrTNF-mediated induction of caspase-1 (green) and IL-1β in BV2 cells. Blue fluorescence is from DAPI. Scale bar = 50 μm. Right: Quantitative analysis of the fluorescence intensities of caspase-1 and IL-1β in the different groups. * p-value < 0.05, ** p-value < 0.01 (one-way ANOVA). (C) Representative Western blot showing Piezo1 and NLRP3 protein levels following the treatment of the primary ACC neuron culture with rrTNF (5 ng/mL) and the effect of the Piezo1 inhibitor GsMTx4 on these rrTNF-mediated inductions are shown on the top. The quantification results are presented below. * p-value < 0.05, ** p-value < 0.01, *** p-value < 0.001 versus the control (one-way ANOVA).
Figure 7
Figure 7
The effect of NLRP3 inhibition on SNI-induced Piezo1 upregulation and pain behavior. (A) Representative double staining showing the overlap of NLRP3-IR (red) with NeuN, Iba1 and GFAP (green), 7 d after SNI. NLRP3-IR (green) also colocalized with Piezo1-IR neurons (red). White arrow shows the co-localization (yellow). Scale bar = 50 μm. (B) Representative double immunofluorescence staining image showing the encapsulation of PV-IR by GSDMD-IR, a pore-forming protein downstream to NLRP3 inflammasome. Scale bar = 50 μm. Blue fluorescence in (A and B) is from DAPI. (C) Representative Western blot showing the effect of the NLRP3 inhibitor MCC950 (10 mg/kg i.p., once a day for 7 days) on the Piezo1 protein level in the bilateral ACC (top). Protein quantification results (bottom). * p-value < 0.05, ** p-value < 0.01 (two-way ANOVA). (D) Changes in ipsilateral paw withdrawal thresholds in sham, SNI + PBS, and SNI + MCC950 group. Significant differences in the threshold were observed in SNI + PBS rats but not SNI + MCC950 rats compared with sham rats on PO days 5, 11 and 15 (n = 6). * p-value < 0.05 versus PO day −1 (Dunn’s multiple comparisons test) or # p-value < 0.05, ## p-value < 0.01 versus the sham group (multiple t test).

References

    1. Logan D.W. Hot to touch: The story of the 2021 Nobel Prize in Physiology or Medicine. Dis. Model. Mech. 2021;14:dmm049352. doi: 10.1242/dmm.049352. - DOI - PMC - PubMed
    1. Coste B., Mathur J., Schmidt M., Earley T.J., Ranade S., Petrus M.J., Dubin A.E., Patapoutian A. Piezo1 and Piezo2 are essential components of distinct mechanically activated cation channels. Science. 2010;330:55–60. doi: 10.1126/science.1193270. - DOI - PMC - PubMed
    1. Zhao Q., Zhou H., Chi S., Wang Y., Wang J., Geng J., Wu K., Liu W., Zhang T., Dong M.Q., et al. Structure and mechanogating mechanism of the Piezo1 channel. Nature. 2018;554:487–492. doi: 10.1038/nature25743. - DOI - PubMed
    1. Della Pietra A., Mikhailov N., Giniatullin R. The Emerging Role of Mechanosensitive Piezo Channels in Migraine Pain. Int. J. Mol. Sci. 2020;21:696. doi: 10.3390/ijms21030696. - DOI - PMC - PubMed
    1. Wang Y., Chi S., Guo H., Li G., Wang L., Zhao Q., Rao Y., Zu L., He W., Xiao B. A lever-like transduction pathway for long-distance chemical- and mechano-gating of the mechanosensitive Piezo1 channel. Nat. Commun. 2018;9:1300. doi: 10.1038/s41467-018-03570-9. - DOI - PMC - PubMed

MeSH terms

Substances