. 2022 Oct 29;23(21):13190.
doi: 10.3390/ijms232113190.

GDNF Increases Inhibitory Synaptic Drive on Principal Neurons in the Hippocampus via Activation of the Ret Pathway

Affiliations

GDNF Increases Inhibitory Synaptic Drive on Principal Neurons in the Hippocampus via Activation of the Ret Pathway

Apostolos Mikroulis et al. Int J Mol Sci. .

Abstract

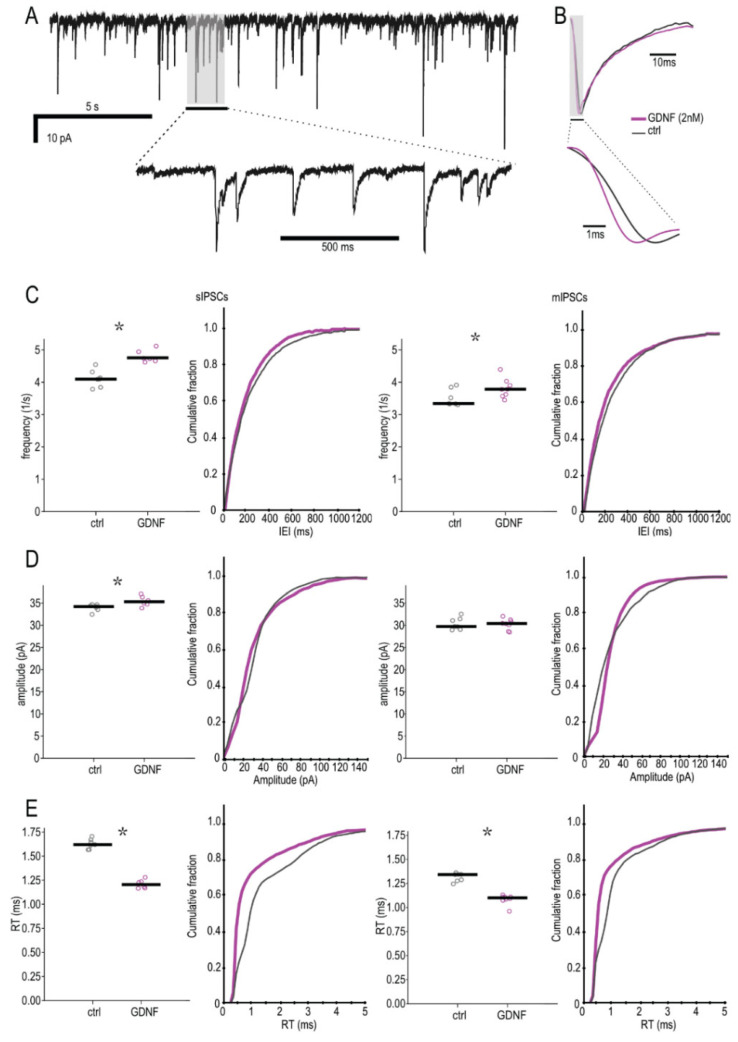
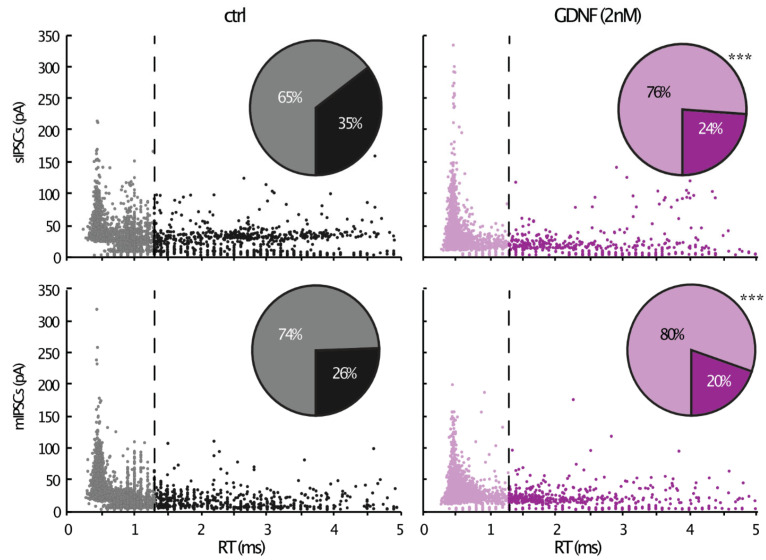
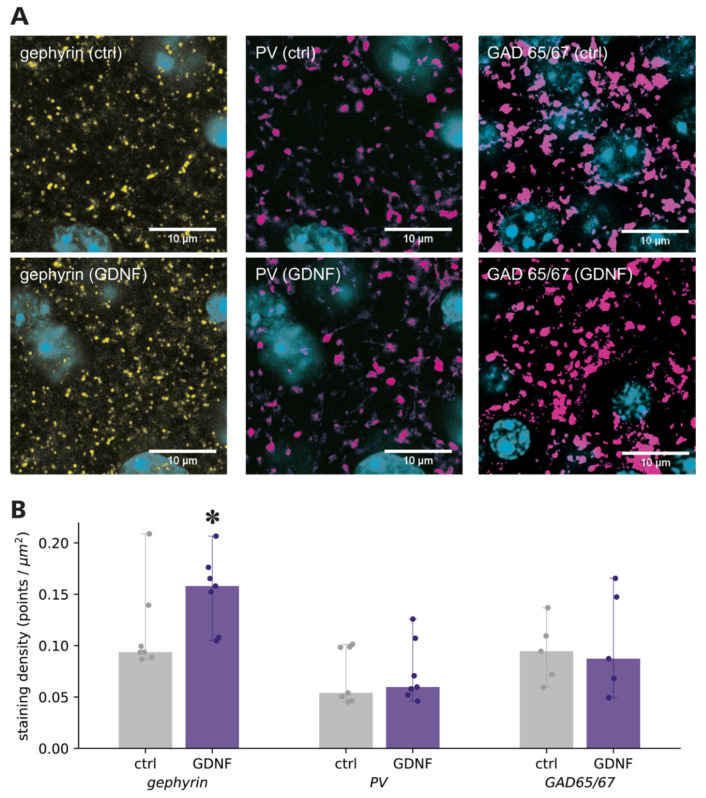
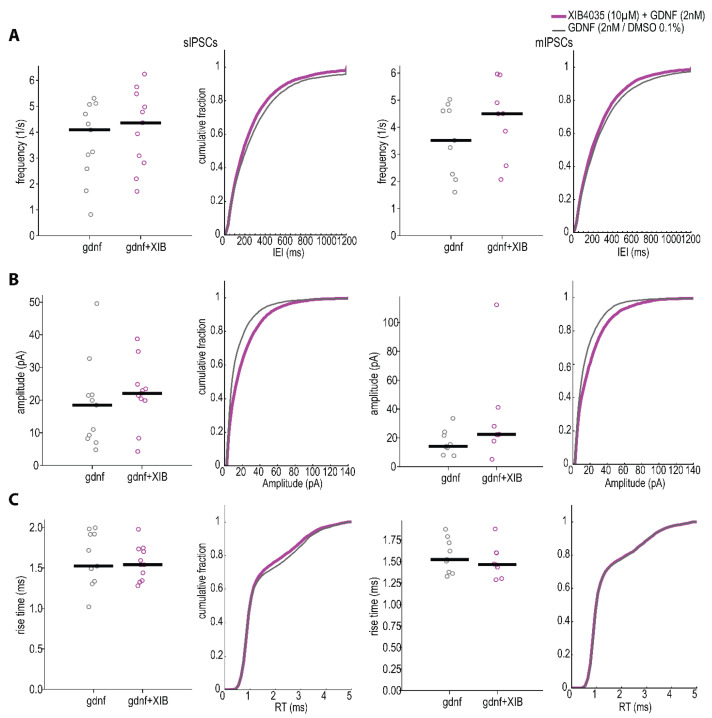
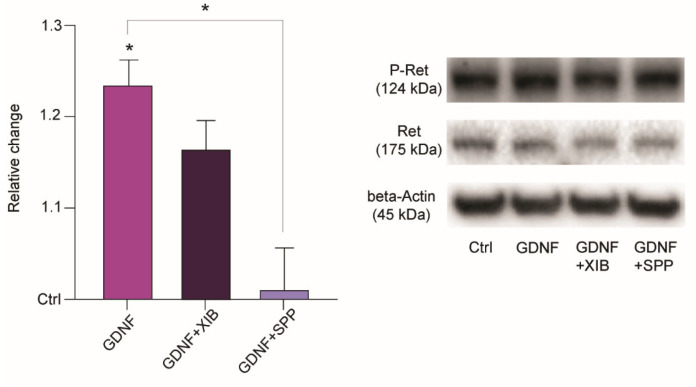
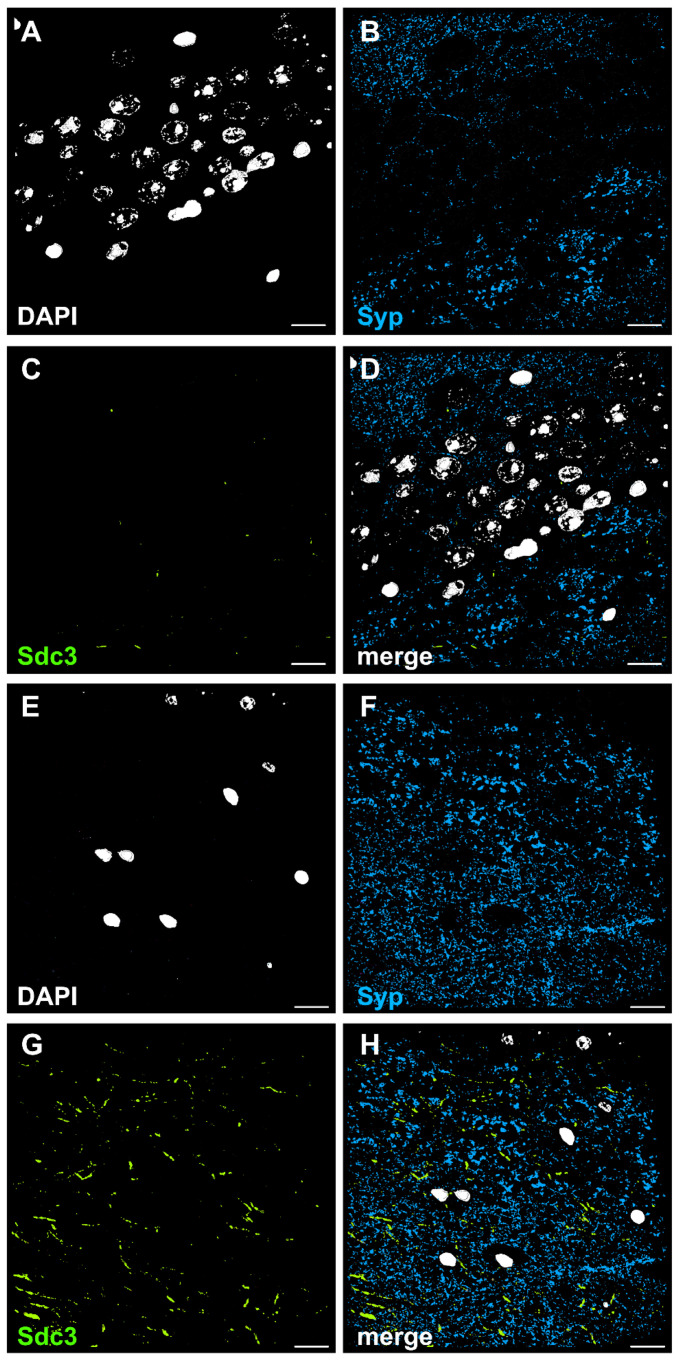
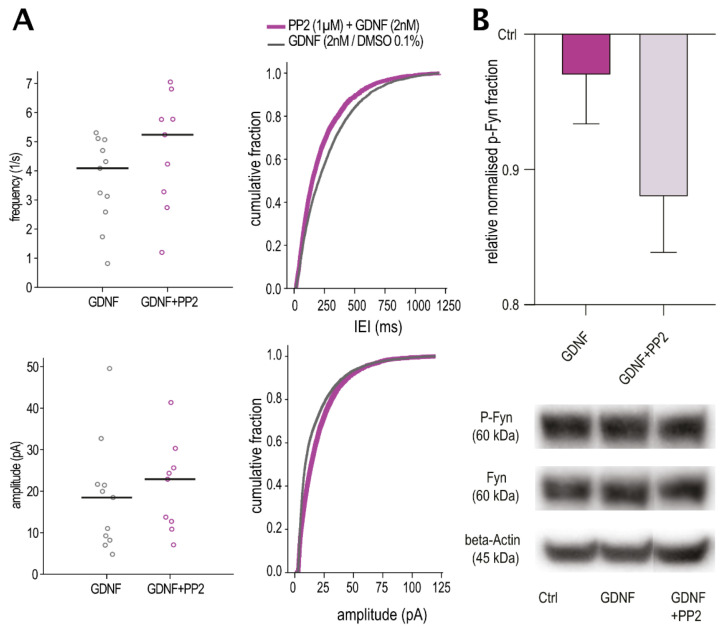
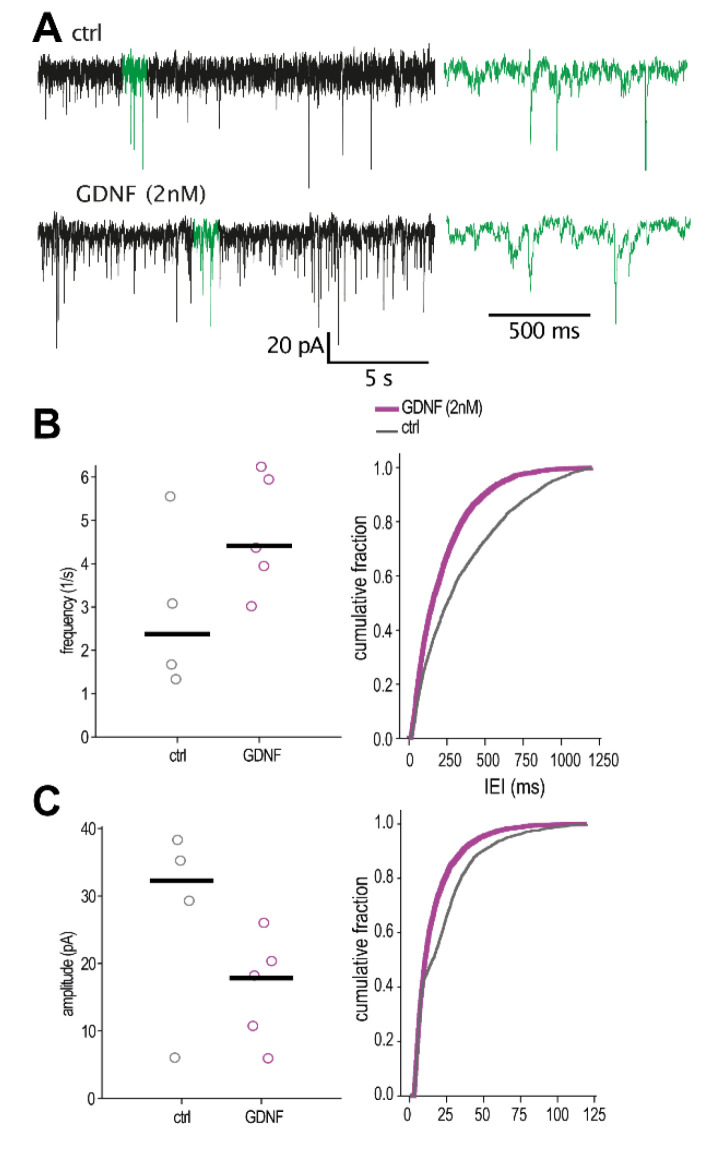
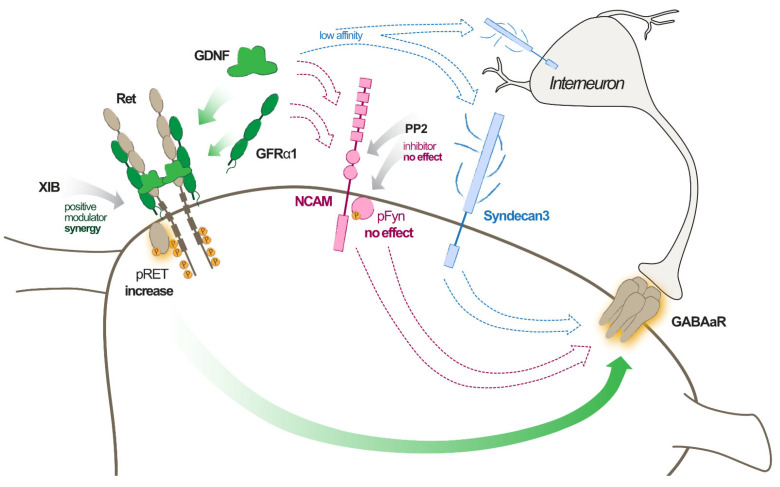
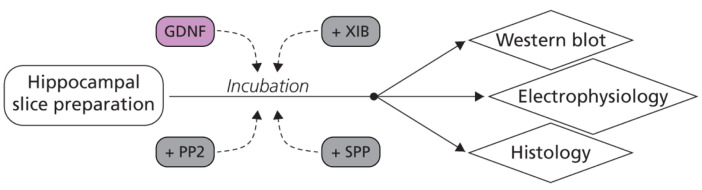
Glial cell line-derived neurotrophic factor (GDNF) has been shown to counteract seizures when overexpressed or delivered into the brain in various animal models of epileptogenesis or chronic epilepsy. The mechanisms underlying this effect have not been investigated. We here demonstrate for the first time that GDNF enhances GABAergic inhibitory drive onto mouse pyramidal neurons by modulating postsynaptic GABAA receptors, particularly in perisomatic inhibitory synapses, by GFRα1 mediated activation of the Ret receptor pathway. Other GDNF receptors, such as NCAM or Syndecan3, are not contributing to this effect. We observed similar alterations by GDNF in human hippocampal slices resected from epilepsy patients. These data indicate that GDNF may exert its seizure-suppressant action by enhancing GABAergic inhibitory transmission in the hippocampal network, thus counteracting the increased excitability of the epileptic brain. This new knowledge can contribute to the development of novel, more precise treatment strategies based on a GDNF gene therapy approach.

Keywords: GDNF; IPSC; electrophysiology; epilepsy; ret.


Conflict of interest statement

The authors declare no conflict of interest. The funders had no role in the design of the study; in the collection, analyses, or interpretation of data; in the writing of the manuscript, or in the decision to publish the results.

Figures

Figure 1
Figure 1
Quantification of GDNF effect on inhibitory postsynaptic currents. (A) Example trace of spontaneous IPSCs from a control slice. (B) Comparison of the averaged sIPSCs from a control and a GDNF-incubated slice from the same animal, highlighting the difference in rise times (normalized amplitudes). (CE) Inter-event interval (K-S sIPSCs p < 0.01 D = 0.238, mIPSCs p < 0.01 D = 0.075), amplitude (K-S sIPSCs p < 0.01 D = 0.127, mIPSCs p < 0.01 D = 0.213) and rise-time (K-S sIPSCs p < 0.01 D = 0.350, mIPSCs p < 0.01 D = 0.309) cumulative distribution plots of spontaneous (left) miniature and IPSCs (right) from control and GDNF-incubated slices (n = 352 events per cell). The line markers in the scatter plots depict the median of averages per cell. Mann–Whitney U-test for the averages. * p < 0.05.
Figure 2
Figure 2
Bivariate plot of amplitude and rise time for each event. The pie charts depict the percentage of fast and slow events. ***: Fisher’s exact test p < 0.001.
Figure 3
Figure 3
Confocal microscopy of gephyrin and inhibitory interneurons. (A) Gephyrin (yellow), parvalbumin, and GAD65/67 staining (magenta) for control and GDNF-incubated slices (Hoescht staining in blue), and (B) quantification of their staining density * Mann–Whitney U-test p < 0.05.
Figure 4
Figure 4
Quantification of Ret activation enhancement effect on inhibitory postsynaptic currents using XIB4035. (A) Inter-event interval (K-S sIPSCs p < 0.01 D = 0.068, mIPSCs p < 0.01 D = 0.088), (B) amplitude (K-S sIPSCs p < 0.01 D = 0.144, mIPSCs p < 0.01 D = 0.166) and (C) rise-time (K-S sIPSCs p < 0.01 D = 0.032; mIPSCs p < 0.01 D = 0.034) cumulative distribution plots of spontaneous (left) and miniature IPSCs (right) from control and GDNF-incubated slices (n = 511 events per cell). The line markers in the scatter plots depict the median of averages per cell. Mann–Whitney test for the averages–not significant, Kolmogorov–Smirnov test for distribution comparisons. p < 0.01.
Figure 5
Figure 5
Relative change in phosphorylation ratio of Ret after treatment with GDNF, GDNF + XIB4035 and GDNF + SPP compared to control. Example images of Western blot membrane staining depicted to the right. Data represented as mean and SEM. Friedman test, Dunn’s multiple comparisons test-GDNF to control, * p < 0.05; GDNF + SPP to GDNF, * p < 0.05; n = 4 for each condition.
Figure 6
Figure 6
Array tomography images demonstrating localization of Syndecan3-immunoreactive spots in mouse hippocampus. (AD) Images taken in CA1 stratum pyramidale, 3D render of 20 consecutive 70 nm sections. (A) DAPI, (B) Synaptophysin (Syp), (C) Syndecan3 (Sdc3), (D) merged. (EH) Images taken in CA1 stratum radiatum, 3D render of 16 consecutive 70 nm sections (E) DAPI, (F) Synaptophysin, (G) Syndecan3, (H) merged. Scale bars: 50 µm.
Figure 7
Figure 7
No effect of NCAM inhibition. (A) Inter-event interval and amplitude cumulative distribution plots of spontaneous IPSCs from GDNF and GDNF + PP2-incubated slices (n = 511 events per cell). The line markers in the scatter plots depict the median of averages per cell. Mann–Whitney test for the averages–not significant, Kolmogorov–Smirnov test for distribution comparisons (IEI: D = 0.126, amplitude: D = 0.155). (B) Relative change in phosphorylation ratio of Fyn after treatment with GDNF and GDNF + PP2 compared to control (n = 4). Example images of Western blot membrane staining depicted below. Data represented as mean and SEM. Friedman test—not significant.
Figure 8
Figure 8
Inter-event interval and amplitude of spontaneous IPSCs from GDNF-incubated human epileptic hippocampal slices. (A) Representative traces of sIPSC recordings. Green-colored areas are magnified on the right. Quantification of (B) frequency and (C) amplitude of spontaneous IPSCs. The line markers in the scatter plots depict the median of averages per cell. Mann–Whitney U-test for the averages–not significant; n = 4 cells for controls and n = 5 cells for GDNF; Kolmogorov–Smirnov test for distribution comparisons, p < 0.01 (IEI: D = 0.238, amplitude: D = 0.199); n = 744 events per cell.
Figure 9
Figure 9
Graphical illustration of likely GDNF mechanism of action leading to increased GABAAR effect on pyramidal neurons in the hippocampus.
Figure 10
Figure 10
Graphical illustration of experimental methods. After slice preparation (from mouse or human tissue), slices were incubated with GDNF, XIB4035, PP2, SPP86, or combinations for 1 h before being processed for either Western blot, electrophysiology, or histology experiments.

References

    1. Lin L.F.H., Doherty D.H., Lile J.D., Bektesh S., Collins F. GDNF: A Glial Cell Line-Derived Neurotrophic Factor for Midbrain Dopaminergic Neurons. Science. 1993;260:1130–1132. doi: 10.1126/science.8493557. - DOI - PubMed
    1. Treanor J.J.S., Goodman L., Sauvage F., Stone D.M., Poulsen K.T., Beck C.D., Gray C., Armanini M.P., Pollock R.A., Hefti F., et al. Characterization of a Multicomponent Receptor for GDNF. Nature. 1996;382:80–83. doi: 10.1038/382080a0. - DOI - PubMed
    1. Paratcha G., Ledda F., Ibáñez C.F. The Neural Cell Adhesion Molecule NCAM Is an Alternative Signaling Receptor for GDNF Family Ligands. Cell. 2003;113:867–879. doi: 10.1016/S0092-8674(03)00435-5. - DOI - PubMed
    1. Ledda F., Paratcha G., Sandoval-Guzmán T., Ibáñez C.F. GDNF and GFRalpha1 Promote Formation of Neuronal Synapses by Ligand-Induced Cell Adhesion. Nat. Neurosci. 2007;10:293–300. doi: 10.1038/nn1855. - DOI - PubMed
    1. Bespalov M.M., Sidorova Y.A., Tumova S., Ahonen-Bishopp A., Magalhães A.C., Kulesskiy E., Paveliev M., Rivera C., Rauvala H., Saarma M. Heparan Sulfate Proteoglycan Syndecan-3 Is a Novel Receptor for GDNF, Neurturin, and Artemin. J. Cell Biol. 2011;192:153–169. doi: 10.1083/jcb.201009136. - DOI - PMC - PubMed

MeSH terms

Substances