Extracellular Vesicles in Diffuse Large B Cell Lymphoma: Characterization and Diagnostic Potential
- PMID: 36362114
- PMCID: PMC9654702
- DOI: 10.3390/ijms232113327
Extracellular Vesicles in Diffuse Large B Cell Lymphoma: Characterization and Diagnostic Potential
Abstract
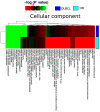
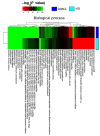
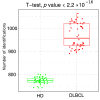
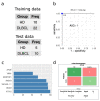
Diffuse large B cell lymphoma (DLBCL) is an aggressive B cell lymphoma characterized by a heterogeneous behavior and in need of more accurate biological characterization monitoring and prognostic tools. Extracellular vesicles are secreted by all cell types and are currently established to some extent as representatives of the cell of origin. The present study characterized and evaluated the diagnostic and prognostic potential of plasma extracellular vesicles (EVs) proteome in DLBCL by using state-of-the-art mass spectrometry. The EV proteome is strongly affected by DLBCL status, with multiple proteins uniquely identified in the plasma of DLBCL. A proof-of-concept classifier resulted in highly accurate classification with a sensitivity and specificity of 1 when tested on the holdout test data set. On the other hand, no proteins were identified to correlate with non-germinal center B-cell like (non-GCB) or GCB subtypes to a significant degree after correction for multiple testing. However, functional analysis suggested that antigen binding is regulated when comparing non-GCB and GCB. Survival analysis based on protein quantitative values and clinical parameters identified multiple EV proteins as significantly correlated to survival. In conclusion, the plasma extracellular vesicle proteome identifies DLBCL cancer patients from healthy donors and contains potential EV protein markers for prediction of survival.
Keywords: cancer; diagnostic; diffuse large B cell lymphoma; extracellular vesicles; liquid biopsy; plasma.
Conflict of interest statement
The authors declare that they have no conflict of interest.
Figures


Similar articles
-
Proteomic Landscape of Extracellular Vesicles for Diffuse Large B-Cell Lymphoma Subtyping.Int J Mol Sci. 2021 Oct 12;22(20):11004. doi: 10.3390/ijms222011004. Int J Mol Sci. 2021. PMID: 34681663 Free PMC article.
-
Clinical Significance of BCL2, C-MYC, and BCL6 Genetic Abnormalities, Epstein-Barr Virus Infection, CD5 Protein Expression, Germinal Center B Cell/Non-Germinal Center B-Cell Subtypes, Co-expression of MYC/BCL2 Proteins and Co-expression of MYC/BCL2/BCL6 Proteins in Diffuse Large B-Cell Lymphoma: A Clinical and Pathological Correlation Study of 120 Patients.Int J Med Sci. 2019 Apr 20;16(4):556-566. doi: 10.7150/ijms.27610. eCollection 2019. Int J Med Sci. 2019. PMID: 31171907 Free PMC article.
-
Proteome alterations in peripheral immune cells of DLBCL patients and evidence of cancer extracellular vesicles involvement.Biochim Biophys Acta Mol Basis Dis. 2025 Aug;1871(6):167842. doi: 10.1016/j.bbadis.2025.167842. Epub 2025 Apr 11. Biochim Biophys Acta Mol Basis Dis. 2025. PMID: 40222457
-
Diffuse large B-cell lymphoma.Pathology. 2018 Jan;50(1):74-87. doi: 10.1016/j.pathol.2017.09.006. Epub 2017 Nov 20. Pathology. 2018. PMID: 29167021 Review.
-
Exosomes and extracellular vesicles as liquid biopsy biomarkers in diffuse large B-cell lymphoma: Current state of the art and unmet clinical needs.Br J Clin Pharmacol. 2021 Feb;87(2):284-294. doi: 10.1111/bcp.14611. Epub 2020 Nov 18. Br J Clin Pharmacol. 2021. PMID: 33080045 Review.
Cited by
-
CD20-bearing extracellular vesicles are associated with prognostic biomarkers of patients with AIDS-NHL.Sci Rep. 2025 Jul 12;15(1):25181. doi: 10.1038/s41598-025-11128-1. Sci Rep. 2025. PMID: 40646161 Free PMC article.
-
Extracellular Vesicles Profile and Risk of Venous Thromboembolism in Patients with Diffuse Large B-Cell Lymphoma.Int J Mol Sci. 2025 Jun 12;26(12):5655. doi: 10.3390/ijms26125655. Int J Mol Sci. 2025. PMID: 40565118 Free PMC article.
-
Editorial: Special Issue on "The Role of Exosomes in Cancer Diagnosis and Therapy".Int J Mol Sci. 2023 Sep 6;24(18):13716. doi: 10.3390/ijms241813716. Int J Mol Sci. 2023. PMID: 37762019 Free PMC article.
-
Proteomic Research of Extracellular Vesicles in Clinical Biofluid.Proteomes. 2023 May 6;11(2):18. doi: 10.3390/proteomes11020018. Proteomes. 2023. PMID: 37218923 Free PMC article. Review.
-
Clinical value of ENO2 in serum extracellular vesicles for the diagnosis and prognosis of diffuse large B-cell lymphoma patients.Clin Transl Oncol. 2025 Aug 22. doi: 10.1007/s12094-025-04030-9. Online ahead of print. Clin Transl Oncol. 2025. PMID: 40844644
References
-
- Swerdlow S.H., Campo E., Pileri S.A., Harris N.L., Stein H., Siebert R., Advani R., Ghielmini M., Salles G.A., Zelenetz A.D., et al. The 2016 revision of the World Health Organization classification of lymphoid neoplasms. Blood. 2016;127:2375–2390. doi: 10.1182/blood-2016-01-643569. - DOI - PMC - PubMed
-
- Ruppert A.S., Dixon J.G., Salles G., Wall A., Cunningham D., Poeschel V., Haioun C., Tilly H., Ghesquieres H., Ziepert M., et al. International prognostic indices in diffuse large B-cell lymphoma: A comparison of IPI, R-IPI, and NCCN-IPI. Blood. 2020;135:2041–2048. doi: 10.1182/blood.2019002729. - DOI - PubMed
-
- Chapuy B., Stewart C., Dunford A.J., Kim J., Kamburov A., Redd R.A., Lawrence M.S., Roemer M.G.M., Li A.J., Ziepert M., et al. Molecular subtypes of diffuse large B cell lymphoma are associated with distinct pathogenic mechanisms and outcomes. Nat. Med. 2018;24:679–690. doi: 10.1038/s41591-018-0016-8. - DOI - PMC - PubMed
MeSH terms
Substances
Grants and funding
LinkOut - more resources
Full Text Sources
Molecular Biology Databases

