. 2022 Nov 2;23(21):13389.
doi: 10.3390/ijms232113389.

METCAM/MUC18 Plays a Tumor Suppressor Role in the Development of Nasopharyngeal Carcinoma Type I

Affiliations

METCAM/MUC18 Plays a Tumor Suppressor Role in the Development of Nasopharyngeal Carcinoma Type I

Yen-Chun Liu et al. Int J Mol Sci. .

Abstract

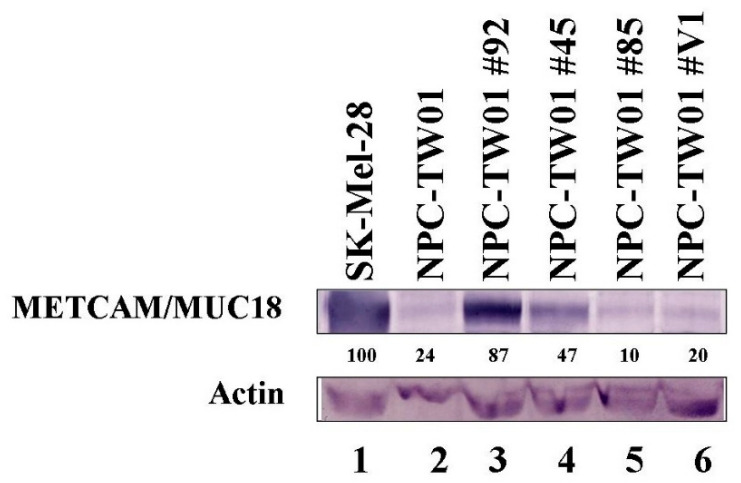
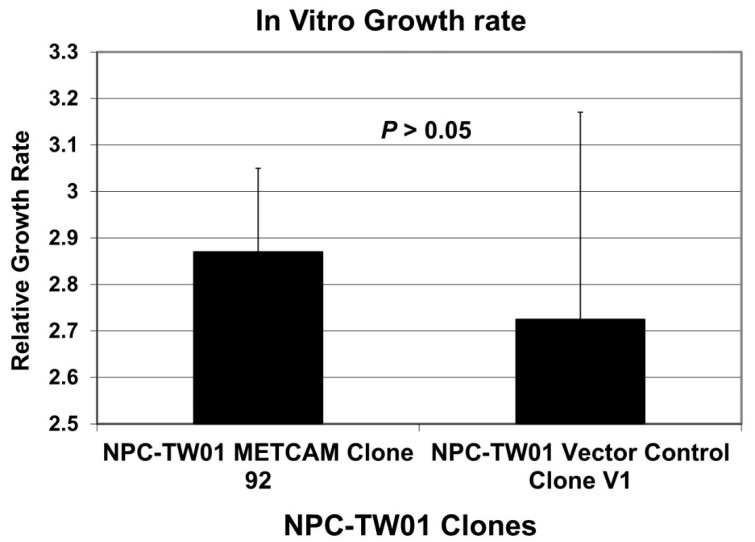
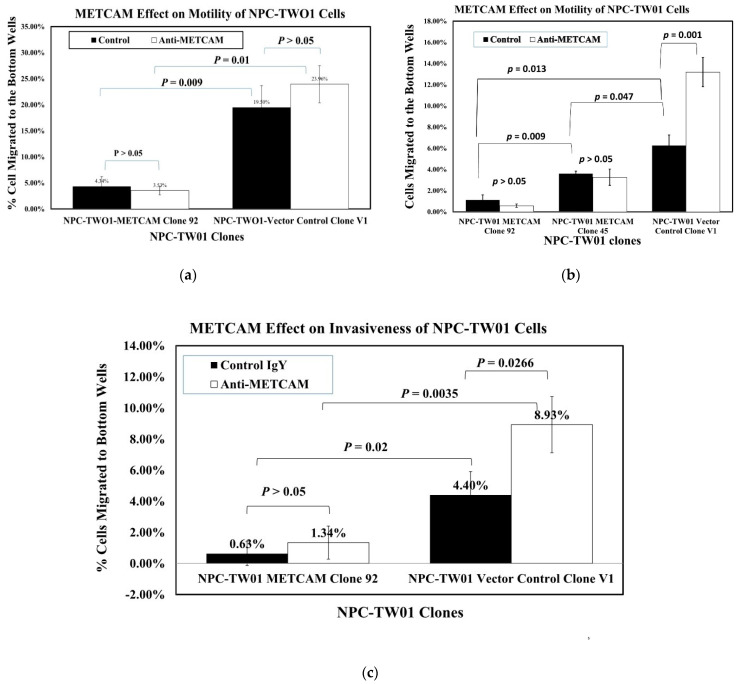
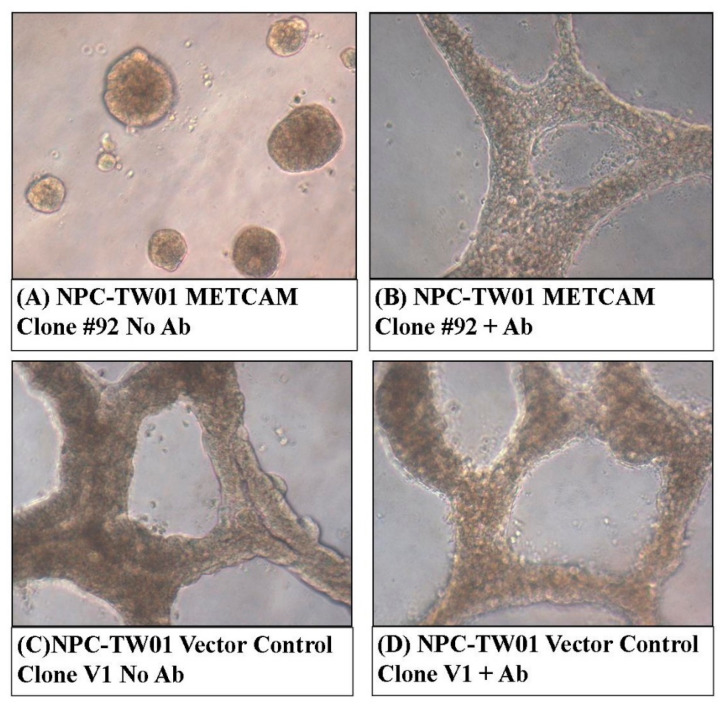
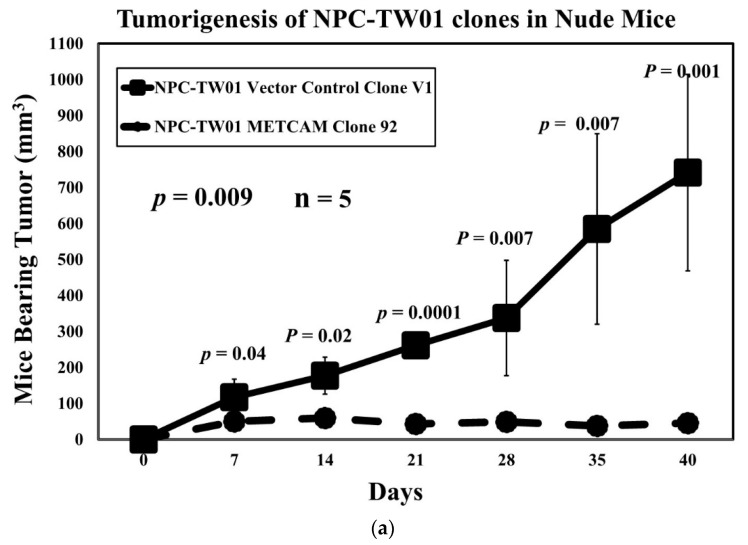
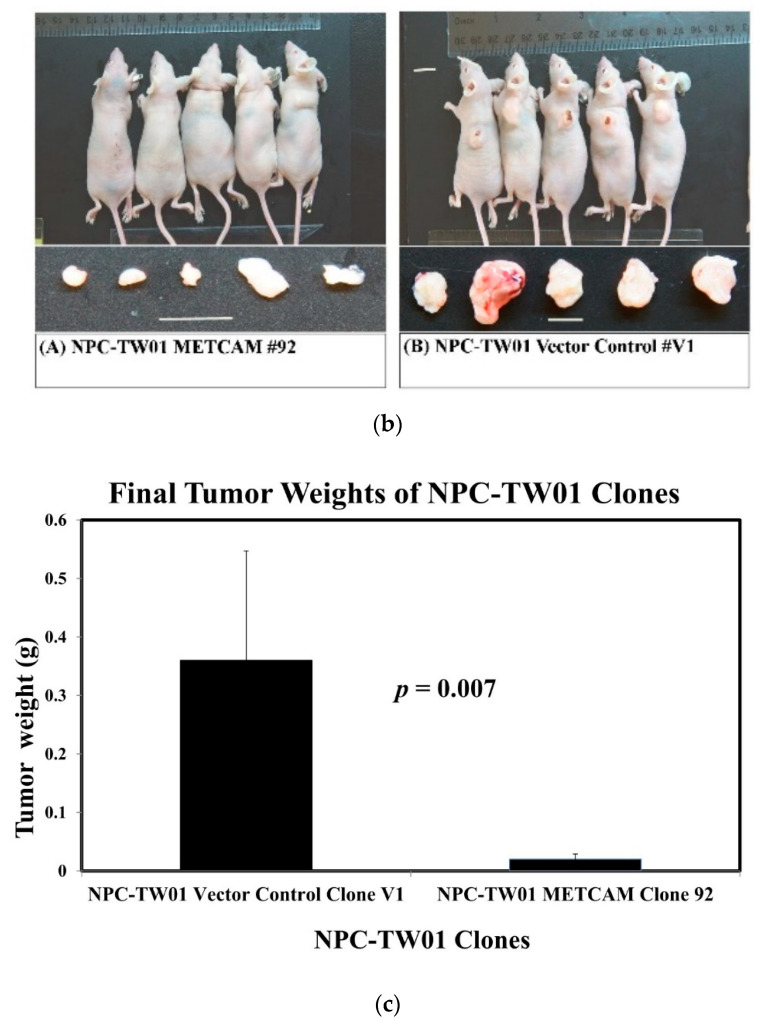
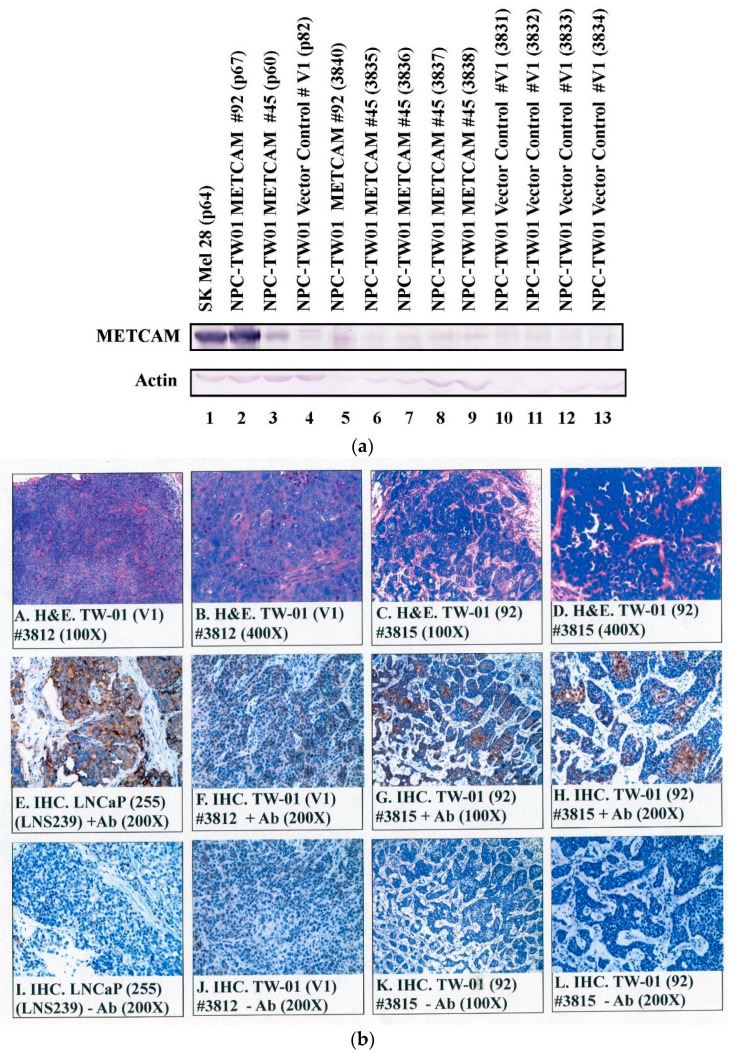
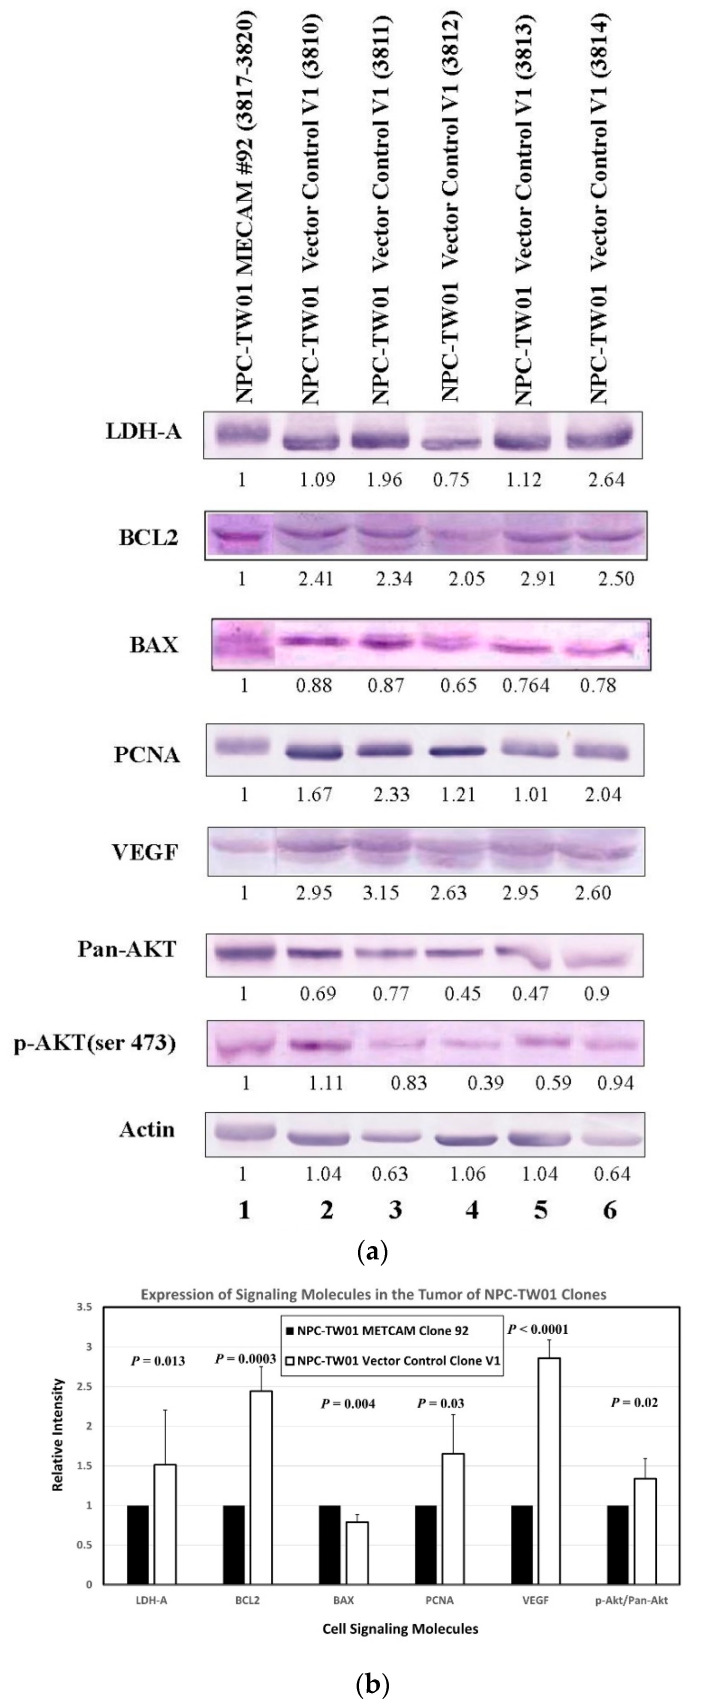
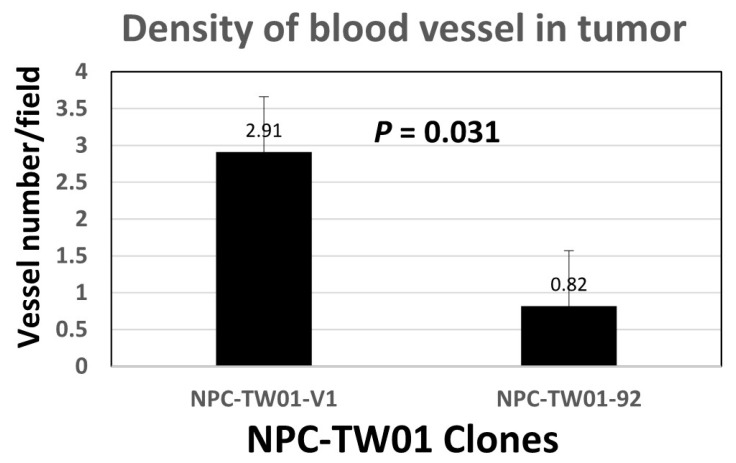
From previous studies of negatively correlating the expression of human METCAM/MUC18 with the pathology of nasopharyngeal carcinoma (NPC), we have suggested that human METCAM/MUC18 (huMETCAM/MUC18) might play a tumor suppressor role in the development of nasopharyngeal carcinoma. To scrutinize this hypothesis, we investigated the effects of huMETCAM/MUC18's over-expression on in vitro cellular behavior and on the in vivo tumorigenesis of one NPC cell line (NPC-TW01). HuMETCAM/MUC18 cDNA was first transfected into the NPC-TW01 cell line, which was established from NPC type I, and many G418-resistant clones were obtained. Then, two NPC-TW01 clones, which expressed high and medium levels of huMETCAM/MUC18, respectively, and one empty vector (control) clone were used to test the effects of huMETCAM/MUC18's over-expression on in vitro behaviors and on in vivo tumorigenesis (via subcutaneous injection) in athymic nude mice (Balb/cAnN.Cg-Foxnlnu/Cr1Nar1). The time course of tumor proliferation and the final tumor weights were determined. Tumor sections were used for the histology and immunohistochemistry (IHC) studies. Tumor lysates were used for determining the expression levels of huMETCAM/MUC18 and various downstream key effectors. HuMETCAM/MUC18's over-expression reduced in vitro motility and invasiveness and altered growth behaviors in 3D basement membrane culture assays, and it decreased the in vivo tumorigenicity of the NPC-TW01 cells. The tumor cells from a high-expressing clone were clustered and confined in small areas, whereas those from a vector control clone were more spread out, suggesting that the tumor cells from the high-expressing clone appeared to stay dormant in micro-clusters. Expression levels of the proliferation index, an index of the metabolic switch to aerobic glycolysis, angiogenesis indexes, and survival pathway indexes were reduced, whereas the pro-apoptosis index increased in the corresponding tumors. The over-expression of huMETCAM/MUC18 in the NPC-TW01 cells decreased the epithelial-to-mesenchymal transition and the in vitro and in vitro tumorigenesis, suggesting that it plays a tumor suppressor role in the development of type I NPC, perhaps by increasing apoptosis and decreasing angiogenesis, proliferation, and the metabolic switch to aerobic glycolysis.

Keywords: 3D basement membrane culture assay; HuMETCAM/MUC18; NPC-TW01; athymic nude mouse model; histology and immunohistochemistry; migration and invasiveness; nasopharyngeal carcinoma type I; tumor development; tumor suppression mechanism.


Conflict of interest statement

All authors declare that they have no conflict of interest.

Figures

Figure 1
Figure 1
Expression of the huMETCAM/MUC18 protein in the G418R-NPC-TW01 clones. HuMETCAM/MUC18 expression in the lysates prepared from the various clones/cells was determined by Western blot analysis, as described in the Section 4. The HuMETCAM/MUC18 expression level in the cell lysate of a human melanoma cell line, SK-Mel-28, was used as a positive control (lane 1) and that from the parental human nasopharyngeal cancer cell line, NPC-TW01, was used as a negative control (lane 2). The HuMETCAM/MUC18 expression in the cell lysates from three huMETCAM/MUC18 cDNA-transfected NPC-TW01 clones (clones #92, #45, and #85) and one vector control clone (#V1) are shown in lanes 3–6. The number under each lane indicates the relative level of huMETCAM/MUC18 in each cell line, assuming that that of the SK-Mel-28 was 100%. Actin is shown as the loading control.
Figure 2
Figure 2
In vitro growth rates of the NPC-TW01 clones. Effects of the huMETCAM/MUC18 expression on the in vitro growth rate of the NPC-TW01 cells were carried out by determining the growth rate of the NPC-TW01 clones 92 and V1 by directly counting the cells at 24, 48, 72, and 96 h after seeding the cells, as described in the Section 4. The mean and standard deviation of the three relative growth rates for each clone were plotted.
Figure 3
Figure 3
Effects of huMETCAM/MUC18′s over-expression on the in vitro motility (a,b) and invasiveness (c) of the NPC-TW01 cells. All in vitro motility and invasiveness tests were performed in the presence of the anti-huMETCAM/MUC18 antibody or the isotype control IgY, as described in the Section 4 The experiments were repeated three times and the means and standard deviations of triplicate values are indicated. (a,b) Effects of huMETCAM/MUC18 expression on the in vitro motility of the NPC-TW01 METCAM clone #92 and the vector control clone #V1 (a) or the NPC-TW01 METCAM clones #92 and #45 and the vector control clone #V1 (b) were determined either in the presence of anti-huMETCAM/MUC18 antibody or the control chicken IgY. The means and standard deviations of triplicate values of the motility tests are indicated. The p-values were obtained by comparing the motility of clone #92 with the control V1 clone. The p-values were also obtained by comparing the motility of the cells in the presence of the anti-huMETCAM/MUC18 antibody with that of the control IgY. (c) Effects of huMETCAM/MUC18 expression on the in vitro invasiveness of the NPC-TW01 METCAM clone #92 and the vector control clone V1 was determined either in the presence of anti-huMETCAM/MUC18 antibody or the control chicken IgY. The means and standard deviations of triplicate values of the invasiveness tests are indicated. The p-values were obtained by comparing the invasiveness of clone #92 with the control V1 clone. The p-values were also obtained by comparing the invasiveness of cells in the presence of the anti-huMETCAM/MUC18 antibody with that of the control IgY.
Figure 4
Figure 4
Effects of huMETCAM/MUC18′s over-expression on the growth of the NPC-TW01 cells in the 3D basement membrane culture assay. The growth of the cells from the METCAM clone #92 and the control clone V1 in the 3D basement membrane was observed after 2–9 days and photographed as described in the Section 4. (A,B) show the growth of METCAM clone #92 in the absence or the presence of the anti-huMETCAM/MUC18 antibody, respectively. (C,D) show the growth of the vector control clone V1 in the absence or the presence of the anti-huMETCAM/MUC18 antibody, respectively.
Figure 5
Figure 5
Effects of huMETCAM/MUC18′s over-expression on in vivo tumorigenesis. Tumorigenicity of the METCAM clone #92 and the vector control clone #V1 of the NPC-TW01 cells was determined by subcutaneous injection of the cells from each clone at the dorsal side in male athymic nude mice. (a) The tumor proliferation by the two clones by plotting mean tumor volumes/weights versus time after injection is shown. p-values were determined between tumor volumes through the time course of the METCAM clone #92 and that of the vector control clone V1. (b) The mice bearing tumors of the METCAM clone #92 and the vector control clone V1 and the excised tumors are shown. (c) The mean final tumor weights of the two clones in the athymic nude mice were compared at the endpoint. Both the mean final tumor weights from five mice of the vector control clone V1 were statistically significantly heavier than the mean tumor weights from those of the METCAM clone #92 since the p-value was 0.007.
Figure 5
Figure 5
Effects of huMETCAM/MUC18′s over-expression on in vivo tumorigenesis. Tumorigenicity of the METCAM clone #92 and the vector control clone #V1 of the NPC-TW01 cells was determined by subcutaneous injection of the cells from each clone at the dorsal side in male athymic nude mice. (a) The tumor proliferation by the two clones by plotting mean tumor volumes/weights versus time after injection is shown. p-values were determined between tumor volumes through the time course of the METCAM clone #92 and that of the vector control clone V1. (b) The mice bearing tumors of the METCAM clone #92 and the vector control clone V1 and the excised tumors are shown. (c) The mean final tumor weights of the two clones in the athymic nude mice were compared at the endpoint. Both the mean final tumor weights from five mice of the vector control clone V1 were statistically significantly heavier than the mean tumor weights from those of the METCAM clone #92 since the p-value was 0.007.
Figure 6
Figure 6
HuMETCAM/MUC18 antigen expression in tumor lysates and in tumor tissue sections. (a) The expression of huMETCAM/MUC18 in the lysates from the tumors was determined by Western blot analysis, as described in the Section 4. The expression of huMETCAM/MUC18 in the lysates from the tissue cultured the SK-Mel-28 cells (lane 1) and the NPC-TW01 clones #92 (lane 2), #45 (lane 3), and V1 (lane 4) were used as the controls. The huMETCAM/MUC18 expression levels in the tumor lysates are shown in lanes 5–13. The huMETCAM/MUC18 expression levels in the combined lysate from the tumors of the METCAM clone #92 (lane 5), in the lysates from the tumors of the METCAM clone #45 (lanes 6–9), and in the lysates from the tumors of the vector control clone V1 (lanes 10–13) are shown. As loading controls, the same membranes were reacted with the antibody against the house-keeping gene, actin (as shown). (b) The histology and immunohistochemistry (IHC) of the tumors of the NPC-TW01 METCAM clone #92 and the vector control clone V1 are shown. Panels A and B show the histology of the tumor sections from the vector control clone V1 and panels C and D show those from clone #92. Panels E to L show the IHC of these tumor sections. A tissue section of the SC tumors derived from the human prostate cancer line LNCaP-expressing clone (LNS239) was used as a positive external control for the IHC staining (panel E). Panels E to H show the anti-huMETCAM/MUC18 antibody staining of the cells in the tumor sections and panels I to L show the negative controls without the antibody. The tumor section from the METCAM clone #92 showed strong brown color staining in the IHC when the antibody was added (panels G and H); however, the tumor section from the vector control clone V1 showed a weak background staining (panel F). Panels I to L show the corresponding negative controls, which show no staining in the adjacent sections when no antibody was added or when the control chicken IgY was added.
Figure 7
Figure 7
Effects of huMETCAM/MUC18′s over-expression on the expression of key downstream effectors. Tumor lysates were used in the Western blot analysis by using various antibodies, as described in the Section 4. (a) The Western blot results of the levels of the various key parameters, such as LDH-A, Bcl2, Bax, PCNA, VEGF, pan-AKT, and phospho-AKT(Ser473), are shown. (b) The quantitative results of the above effectors are shown.
Figure 8
Figure 8
Vascular density in the tumor sections. The vascular density was determined as described in the Section 4.

Similar articles

Cited by

References

    1. Ho J.H.C. Current knowledge of the epidemiology of nasopharyngeal carcinoma (NPC) In: Biggs P., de The’ G., Payne L., editors. Oncogenesis and Herpesviruses. IARC; Lyon, France: 1972. pp. 357–366.
    1. Shanmugaratnam K., Sobin L.H. The World Health Organization histological classification of tumors of the upper respiratory tract and ear. A commentary on the second edition. Cancer. 1993;71:2689–2697. doi: 10.1002/1097-0142(19930415)71:8<2689::AID-CNCR2820710843>3.0.CO;2-H. - DOI - PubMed
    1. Wei W., Sham J.S. Nasopharyngeal carcinoma. Lancet. 2005;365:2041–2054. doi: 10.1016/S0140-6736(05)66698-6. - DOI - PubMed
    1. Gkretsi V., Stylianopoulos T. Cell Adhesion and Matrix Stiffness: Coordinating Cancer Cell Invasion and Metastasis. Front. Oncol. 2018;8:145. doi: 10.3389/fonc.2018.00145. - DOI - PMC - PubMed
    1. Yu Y., Dong W., Zhou X., Li S. The significance of soluble intercellular adhesion molecule 1 (ICAM-1) and transformation growth factor alpha in patients with nasopharyngeal carcinomas. Acta Otolaryngol. Head Neck Surg. 2004;130:1205–1208. - PubMed