. 2022 Nov 4;13(11):1910.
doi: 10.3390/mi13111910.

A Microfluidic Approach for Probing Heterogeneity in Cytotoxic T-Cells by Cell Pairing in Hydrogel Droplets

Affiliations

A Microfluidic Approach for Probing Heterogeneity in Cytotoxic T-Cells by Cell Pairing in Hydrogel Droplets

Bart M Tiemeijer et al. Micromachines (Basel). .

Abstract

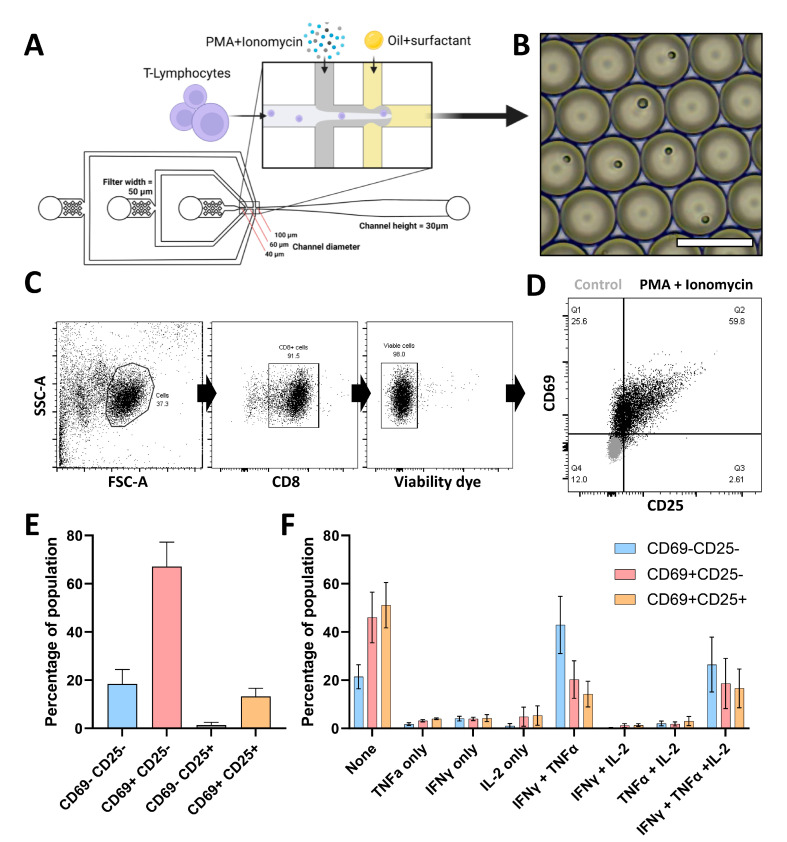
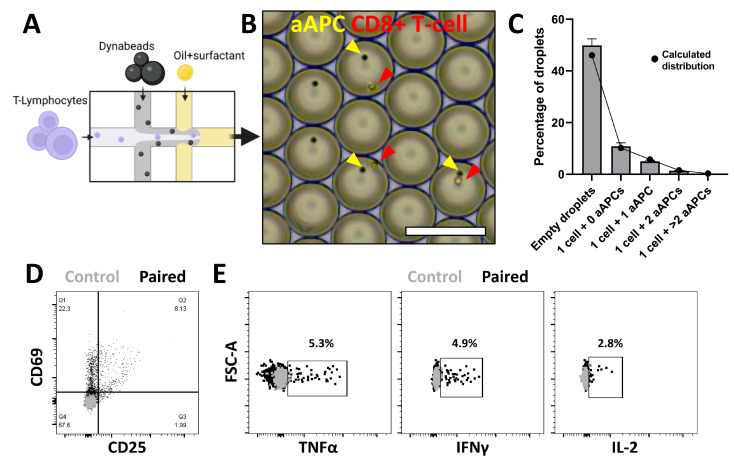
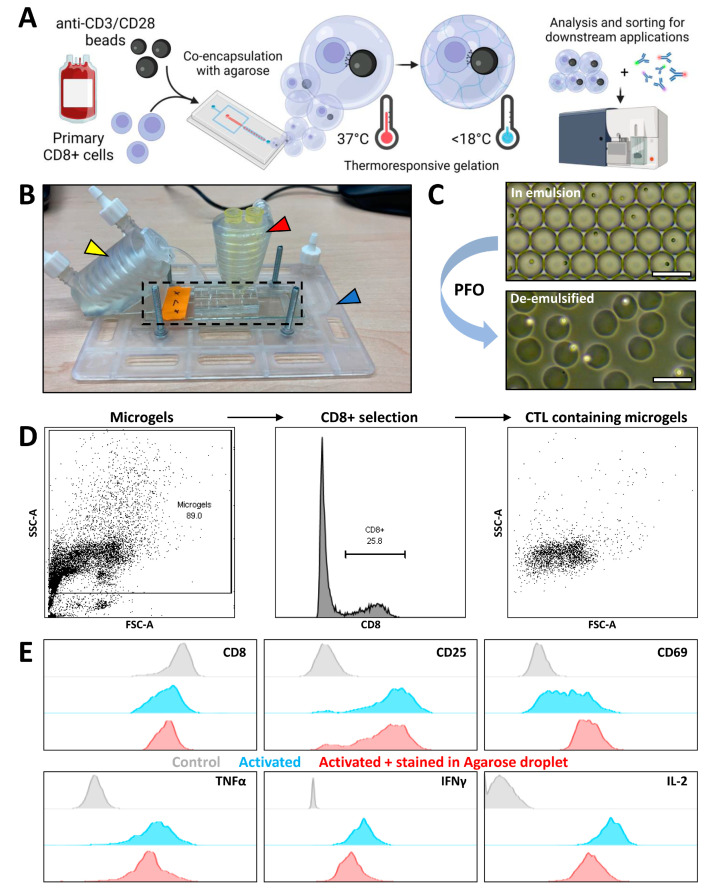
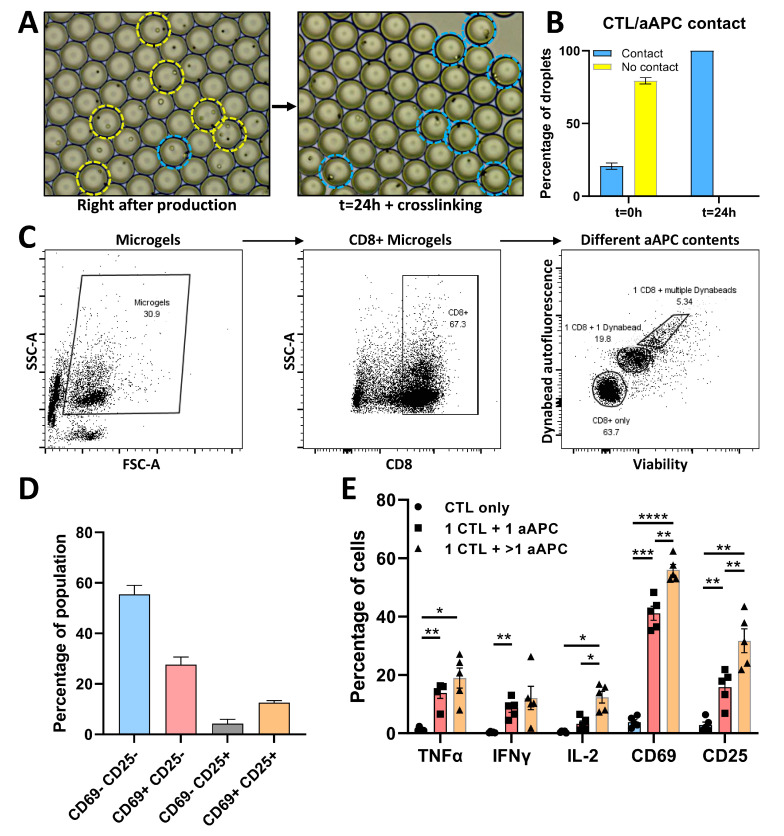
Cytotoxic T-cells (CTLs) exhibit strong effector functions to leverage antigen-specific anti-tumoral and anti-viral immunity. When naïve CTLs are activated by antigen-presenting cells (APCs) they display various levels of functional heterogeneity. To investigate this, we developed a single-cell droplet microfluidics platform that allows for deciphering single CTL activation profiles by multi-parameter analysis. We identified and correlated functional heterogeneity based on secretion profiles of IFNγ, TNFα, IL-2, and CD69 and CD25 surface marker expression levels. Furthermore, we strengthened our approach by incorporating low-melting agarose to encapsulate pairs of single CTLs and artificial APCs in hydrogel droplets, thereby preserving spatial information over cell pairs. This approach provides a robust tool for high-throughput and single-cell analysis of CTLs compatible with flow cytometry for subsequent analysis and sorting. The ability to score CTL quality, combined with various potential downstream analyses, could pave the way for the selection of potent CTLs for cell-based therapeutic strategies.

Keywords: CD8 T-cell; cytokines; droplet microfluidics; heterogeneity; microgel; single-cell.


Conflict of interest statement

The authors declare no conflict of interest.

Figures

Figure 1
Figure 1
Single-cell CTL activation using soluble stimuli. (A) Layout of the microfluidic device used for droplet production including popped-out schematic of droplet formation, scale bar represents 500 µm. Layout is a direct copy of the photolithography mask design, and channel height is equal throughout. (B) Brightfield microscopy image of aqueous droplets containing single CTLs. Scale bar = 100 µm. (C) Gating strategy for flow cytometry data to select viable CD8-positive cells. (D) Marker expression of selected viable CD8-positive cells for CD69 and CD25 activation markers, either after stimulation with PMA + Ionomycin (black dots) or unstimulated (grey dots). Data display one representative donor. (E) Prevalence of populations of PMA + Ionomycin activated CTLs based on CD25 and CD69 expression. Data represent SEM of n = 4 biological replicates. (F) Bar graph displaying the frequency of different profiles of secretion as exhibited by the three prevalent populations of PMA + Ionomycin stimulated CTLs. Data represent average values of n = 3 biological replicates.
Figure 2
Figure 2
Single-cell CTL activation using aAPCs. (A) Schematic of droplet formation when CTLs are paired with Dynabeads. (B) Brightfield microscopy image of aqueous droplets containing CTLs (red) and aAPCs (yellow) in pairs. Scale bar = 100 µm. (C) Counted (grey bars) and calculated (black dots) Poisson distribution of droplet contents when co-encapsulating CTL and aAPCs. Error bars represent average ± SEM of 4 independent experiments in which at least 1000 droplets were counted. (D) Marker expression of CD69 and CD25 activation markers on CTLs retrieved from droplet co-culture with aAPC. (E) Cytokine secretion of CTLs retrieved from droplet co-culture with aAPCs (black dots) as compared to unstimulated control (grey dots).
Figure 3
Figure 3
Encapsulation and flow cytometric measurement of CTL-containing agarose microgels. (A) Schematic of the workflow; cells are isolated and co-encapsulated with aAPCs in droplets along with agarose solution, droplets containing cells are cultured at 37 °C to allow interaction after which temperature is decreased below 18 °C to allow agarose to crosslink and create microgels containing cell pairs, microgels are retrieved and can be stained for membrane markers and measured or sorted using flow cytometry. (B) 3D printed temperature control devices. Device used to control temperature in pipette tips (red arrow) for injection of samples, microscope insert (blue arrow) containing microfluidic device (black dashed line), and heated holder for collection tube (yellow arrow). Hot water is flown through all devices in series to maintain 37 °C during droplet formation and after collection. (C) Brightfield microscopy images of water-in-oil emulsion before crosslinking and of de-emulsified microgels in PBS. Scale bars = 100 µm. (D) Gating strategy to retrieve cell-containing droplets; Microgels are gated based on the FSC/SSC of empty droplets, CD8+ events are selected. (E) Histograms depicting the effect of antibody staining in agarose hydrogels compared to staining in conventional cell solution. Comparing unstimulated control stained in solution (grey), PMA/Ionomycin bulk stimulated cells stained in solution (blue), PMA/Ionomycin bulk stimulated cells stained in microgels (red).
Figure 4
Figure 4
Encapsulation and flow cytometric measurement of CTL/aAPC pairs in microgels. (A) Brightfield microscopy images of droplets for CTL/aAPC pairing; Left image displays droplets directly after production at 37 °C where cells and particles are free floating in agarose solution droplets, right image displays droplets after 24 h of incubation at 37 °C and subsequent gelation at >18 °C where cells are fixed in crosslinked agarose. Yellow circles indicate CTL/aAPC combinations where no contact is observed, blue circles indicate combinations where contact is observed. (B) Results of manual quantification of n = 46 images containing n = 532 CTL/aAPC paired droplets from n = 3 independent experiments. error bars represent n = 3 experiments. (C) Gating strategy of CTL/aAPC droplets; all non-empty microgels are selected, all microgels containing at least a CD8+ cell are gated, based on Dynabead autofluorescence and viability dye intensity gates are drawn for single viable CTLs, 1:1 pairs of CTL/aAPCs, and microgels containing a CTL and multiple aAPCs. (D) Prevalence of populations of 1:1 aAPC activated CTLs based on CD25 and CD69 expression. Data represent SEM of n = 5 biological replicates. (E) Data summary of activation markers in microgels containing only CTLs (blue), microgels containing 1 CTL and 1 aAPC (red), and microgels containing 1 CTL with multiple aAPCs (orange). Data show n = 5 biological replicates with SEM. * p < 0.05, ** p < 0.01, *** p < 0.001, **** p < 0.0001, if no significance is indicated none was found.
Figure 5
Figure 5
Comparing heterogeneous cell responses between PMA/Ionomycin and aAPC activation. (A) Pie graphs displaying the different profiles of secretion after PMA/Ionomycin stimulation of CTLs, n = 3 donors. (B) Pie graphs displaying the different profiles of secretion after aAPC stimulation of CTLs, n = 5 donors.

References

    1. Betts M.R., Nason M.C., West S.M., De Rosa S.C., Migueles S.A., Abraham J., Lederman M.M., Benito J.M., Goepfert P.A., Connors M., et al. HIV nonprogressors preferentially maintain highly functional HIV-specific CD8+ T cells. Blood. 2006;107:4781–4789. doi: 10.1182/blood-2005-12-4818. - DOI - PMC - PubMed
    1. Freel S.A., Lamoreaux L., Chattopadhyay P.K., Saunders K., Zarkowsky D., Overman R.G., Ochsenbauer C., Edmonds T.G., Kappes J.C., Cunningham C.K., et al. Phenotypic and Functional Profile of HIV-Inhibitory CD8 T Cells Elicited by Natural Infection and Heterologous Prime/Boost Vaccination. J. Virol. 2010;84:4998–5006. doi: 10.1128/JVI.00138-10. - DOI - PMC - PubMed
    1. Zimmerli S.C., Harari A., Cellerai C., Vallelian F., Bart P.-A., Pantaleo G. HIV-1-specific IFN-γ/IL-2-secreting CD8 T cells support CD4-independent proliferation of HIV-1-specific CD8 T cells. Proc. Natl. Acad. Sci. USA. 2005;102:7239–7244. doi: 10.1073/pnas.0502393102. - DOI - PMC - PubMed
    1. Paul M.S., Ohashi P.S. The Roles of CD8+ T Cell Subsets in Antitumor Immunity. Trends Cell Biol. 2020;30:695–704. doi: 10.1016/j.tcb.2020.06.003. - DOI - PubMed
    1. Woodland D.L., Dutton R.W. Heterogeneity of CD4+ and CD8+ T cells. Curr. Opin. Immunol. 2003;15:336–342. doi: 10.1016/S0952-7915(03)00037-2. - DOI - PubMed