. 2022 Nov 3;14(21):4650.
doi: 10.3390/nu14214650.

Beneficial Effects of Essential Oils from the Mediterranean Diet on Gut Microbiota and Their Metabolites in Ischemic Heart Disease and Type-2 Diabetes Mellitus

Affiliations

Beneficial Effects of Essential Oils from the Mediterranean Diet on Gut Microbiota and Their Metabolites in Ischemic Heart Disease and Type-2 Diabetes Mellitus

María José Sánchez-Quintero et al. Nutrients. .

Abstract

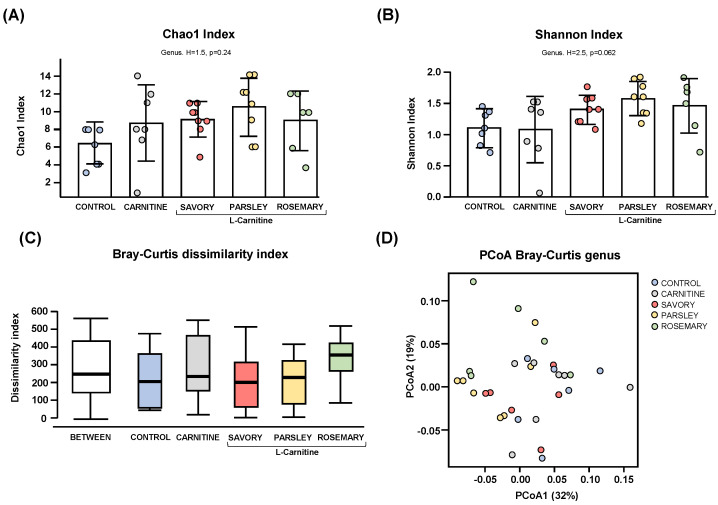
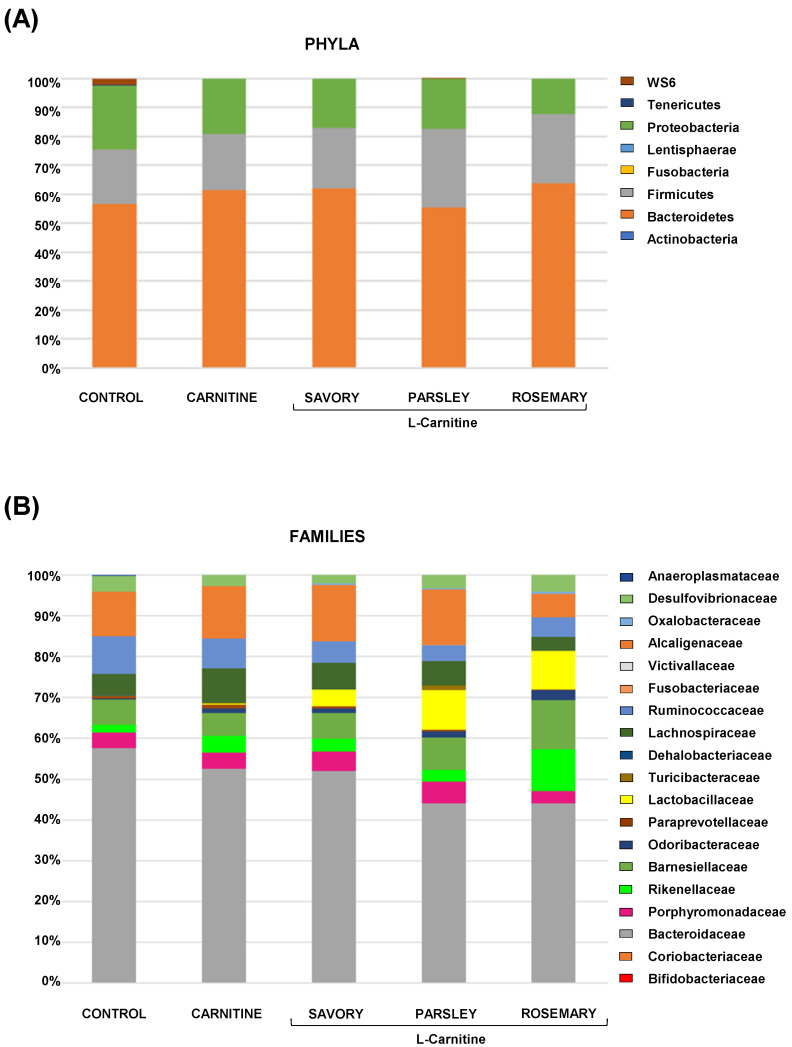
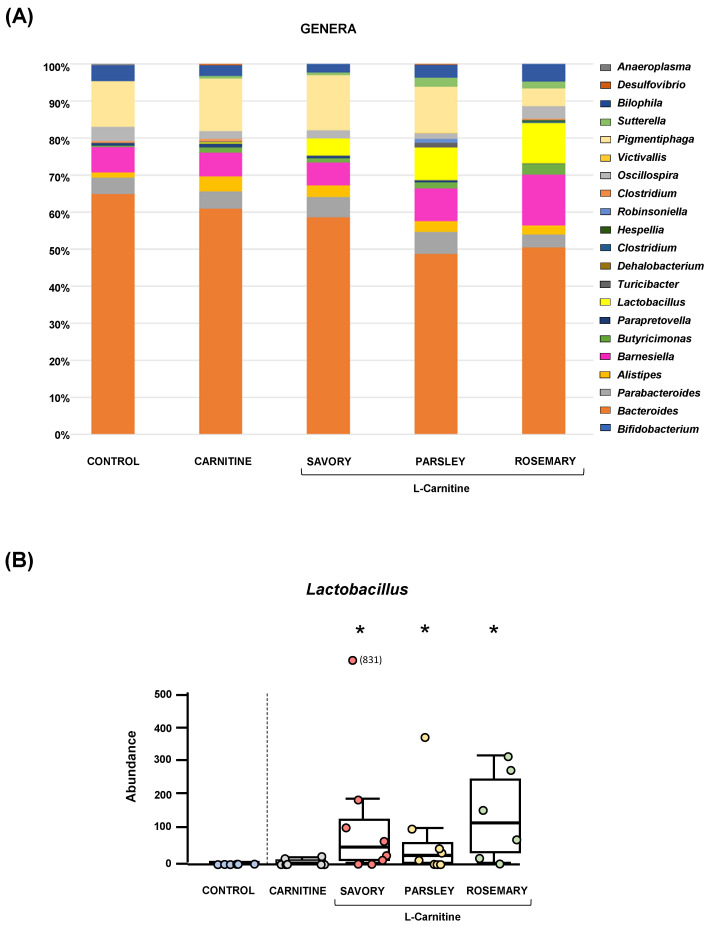
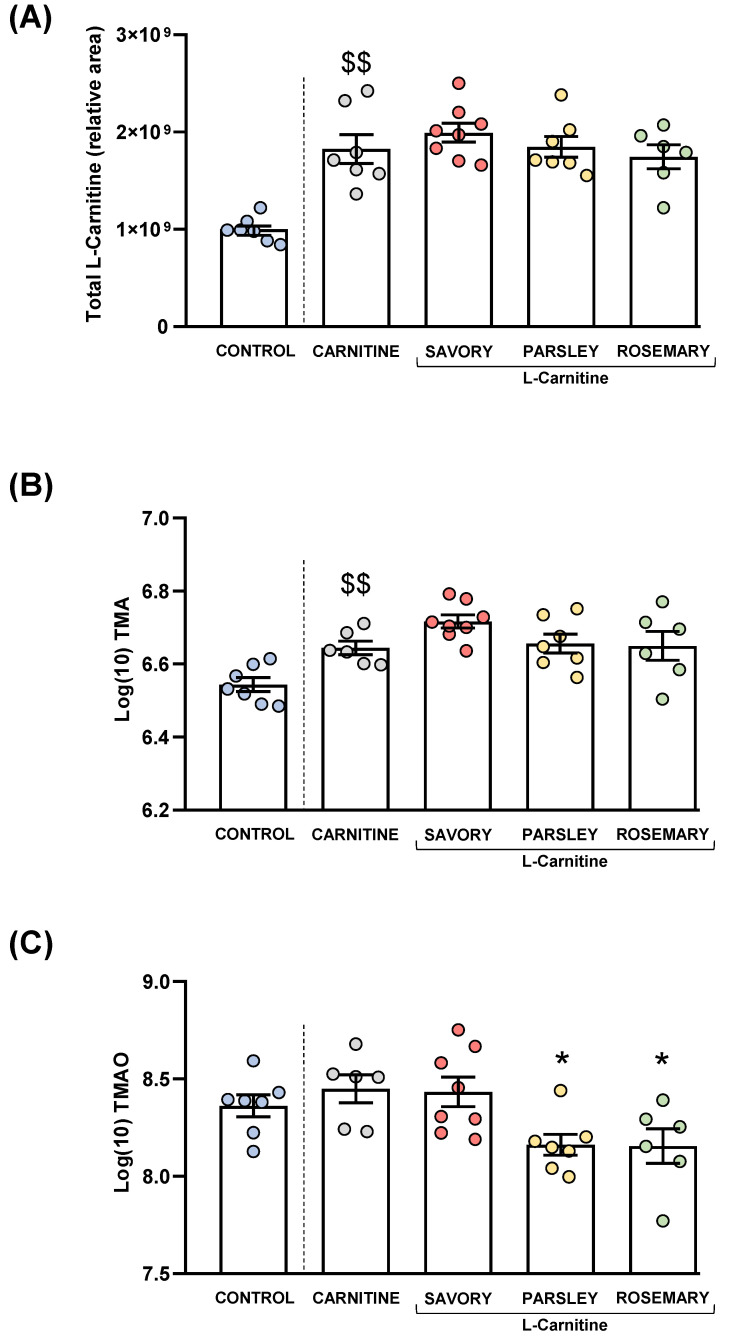
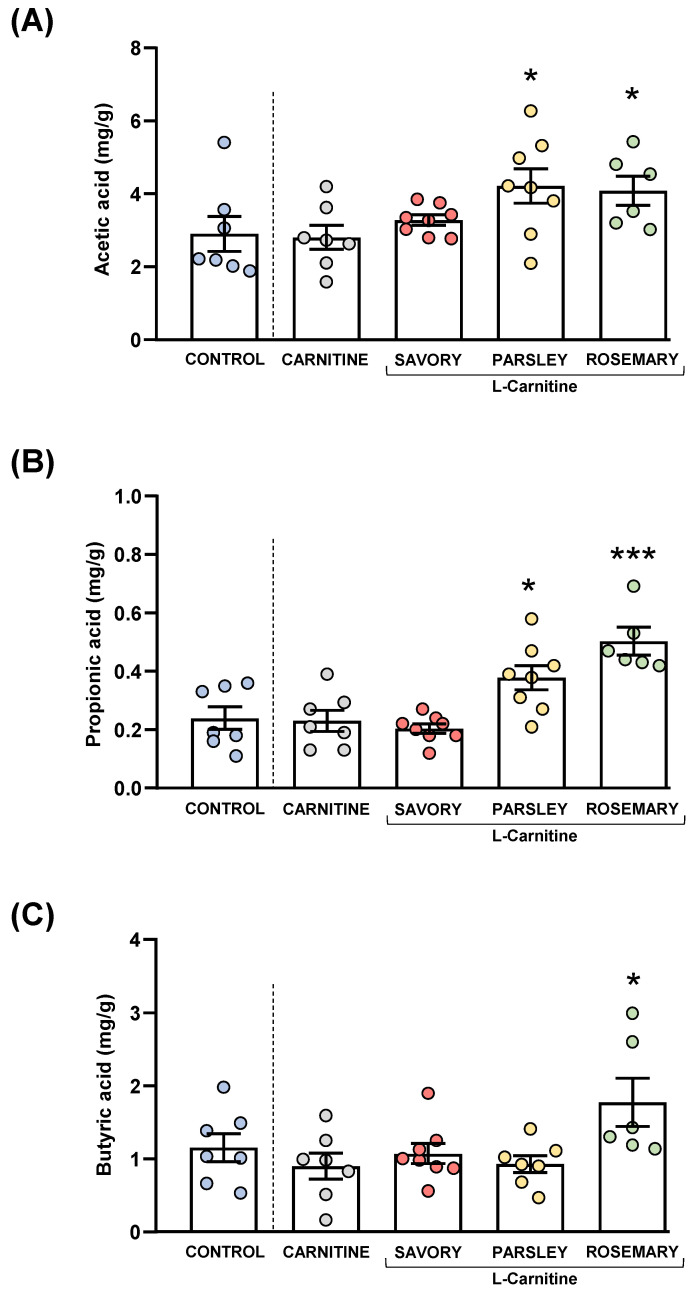
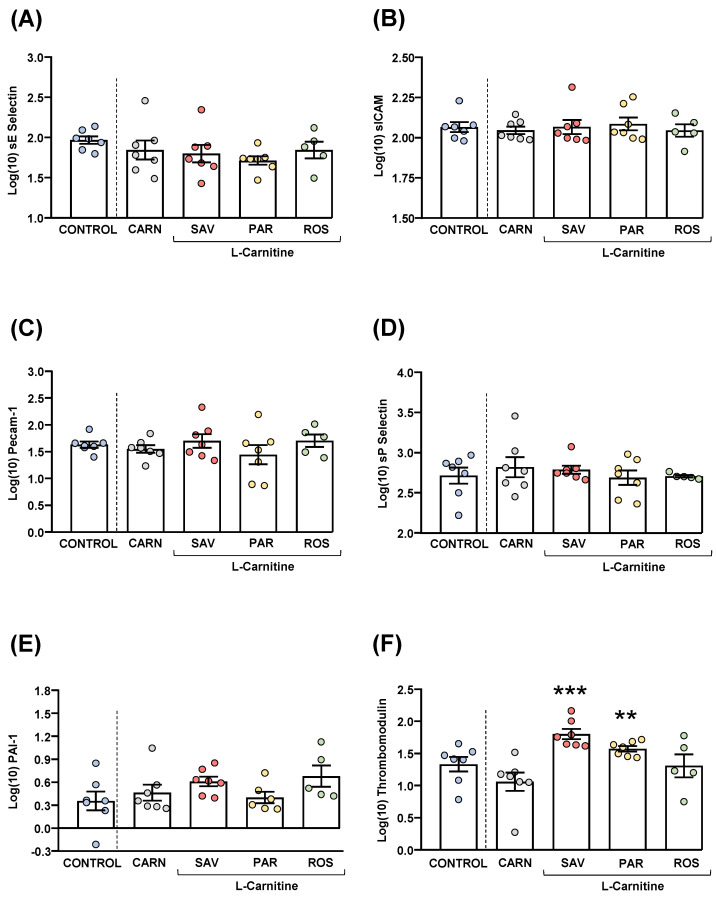
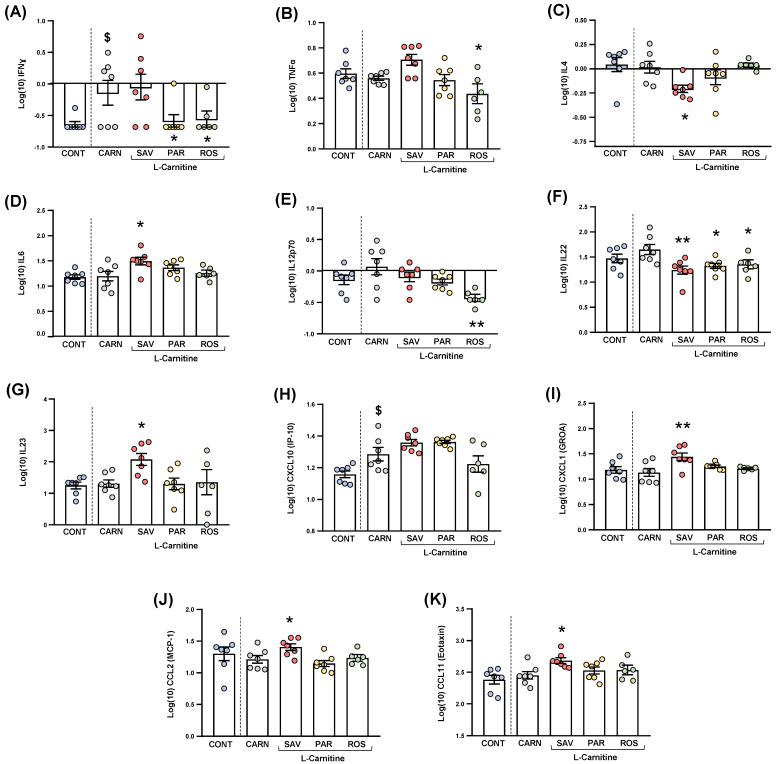
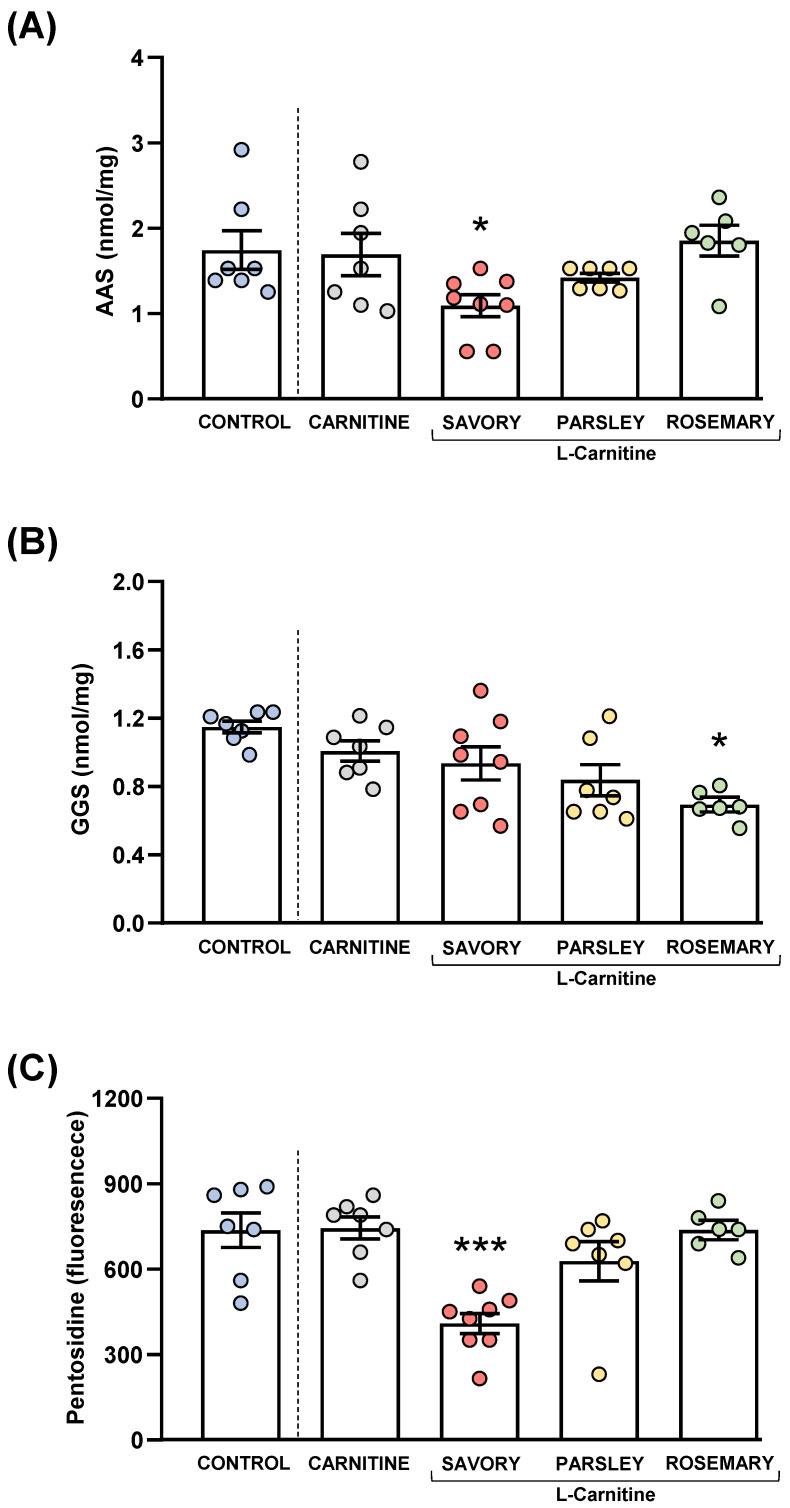
Ischemic heart disease (IHD) and type-2 diabetes mellitus (T2DM) remain major health problems worldwide and commonly coexist in individuals. Gut microbial metabolites, such as trimethylamine N-oxide (TMAO) and short-chain fatty acids (SCFAs), have been linked to cardiovascular and metabolic diseases. Previous studies have reported dysbiosis in the gut microbiota of these patients and the prebiotic effects of some components of the Mediterranean diet. Essential oil emulsions of savory (Satureja hortensis), parsley (Petroselinum crispum) and rosemary (Rosmarinus officinalis) were assessed as nutraceuticals and prebiotics in IHD and T2DM. Humanized mice harboring gut microbiota derived from that of patients with IHD and T2DM were supplemented with L-carnitine and orally treated with essential oil emulsions for 40 days. We assessed the effects on gut microbiota composition and abundance, microbial metabolites and plasma markers of cardiovascular disease, inflammation and oxidative stress. Our results showed that essential oil emulsions in mice supplemented with L-carnitine have prebiotic effects on beneficial commensal bacteria, mainly Lactobacillus genus. There was a decrease in plasma TMAO and an increase in fecal SCFAs levels in mice treated with parsley and rosemary essential oils. Thrombomodulin levels were increased in mice treated with savory and parsley essential oils. While mice treated with parsley and rosemary essential oils showed a decrease in plasma cytokines (INFɣ, TNFα, IL-12p70 and IL-22); savory essential oil was associated with increased levels of chemokines (CXCL1, CCL2 and CCL11). Finally, there was a decrease in protein carbonyls and pentosidine according to the essential oil emulsion. These results suggest that changes in the gut microbiota induced by essential oils of parsley, savory and rosemary as prebiotics could differentially regulate cardiovascular and metabolic factors, which highlights the potential of these nutraceuticals for reducing IHD risk in patients affected by T2DM.

Keywords: carbonyl; chemokine; cytokine; nutraceutical; parsley; pentosidine; prebiotic; protein carbonyl; rosemary; savory; short-chain fatty acid; trimethylamine N-oxide.


Conflict of interest statement

The authors declare no conflict of interest.

Figures

Figure 1
Figure 1
Alpha and beta diversity analyses of bacterial microbiota in fecal samples from the treatment groups. (A) Chaos1 index; (B) Shannon index; (C) Bray-Curtis dissimilarity index; and (D) Principal coordinates analysis of Bray-Curtis dissimilarity. Dots are individual values. Alpha diversity was assessed using the Kruskal-Wallis rank-sum test, and the Bray-Curtis dissimilarity index was assessed using the analysis of similarity (ANOSIM). Principal coordinates analysis (PCoA) based on Bray-Curtis dissimilarity index shows the distance in the bacterial communities between the treatment groups.
Figure 2
Figure 2
Bacterial profile at the phylum and family levels in fecal samples of mice from the treatment groups. (A) Phyla; and (B) Families. Bars show the relative abundances (%) for each group using 16S rRNA gene sequencing (Ion S5TM System).
Figure 3
Figure 3
Bacterial profile at the genus level and abundance of Lactobacillus in fecal samples of mice from the treatment groups. (A) Genera; and (B) Lactobacillus. Bars show the relative abundance (%) for each group using 16S rRNA gene sequencing (Ion S5TM System). Dots are individual values and data from the carnitine, savory, parsley and rosemary groups were analyzed using the Kruskal-Wallis rank-sum test (*) p < 0.05 denotes significant differences compared with the carnitine group.
Figure 4
Figure 4
Plasma levels of total L-Carnitine, TMA and TMAO in mice from the treatment groups. (A) Total L-carnitine; (B) TMA; and (C) TMAO levels. Dots are individual values. Bars are means ± SEM of L-Carnitine concentrations (relative area) and log10-transformed concentrations of TMA and TMAO (ng mL−1). Data from the control and carnitine groups were analyzed using Student’s t test. Data from the carnitine, savory, parsley and rosemary groups were analyzed using one-way ANOVA. ($$) p < 0.01 denotes significant differences compared with the control group. (*) p < 0.05 denotes significant differences compared with the carnitine group.
Figure 5
Figure 5
Fecal levels of SCFA species in mice from the treatment groups. (A) Acetic; (B) Propionic; and (C) Butyric acid levels. Dots are individual values. Bars are means ± SEM of SFCA concentrations (mg g−1). Data from the control and carnitine groups were analyzed using Student’s t test. Data from the carnitine, savory, parsley and rosemary groups were analyzed using one-way ANOVA. (*) p < 0.05 and (***) p < 0.001 denote significant differences compared with the carnitine group.
Figure 6
Figure 6
Plasma levels of cardiovascular markers in mice from the treatment groups. (A) sE-Selectin; (B) sICAM; (C) Pecam-1; (D) sP-Selectin; (E) PAI-1; and (F) Thrombomodulin levels. Dots are individual values. Bars are means ± SEM of log10-transformed concentrations of relevant cardiovascular markers (ng mL−1). Data from the control and carnitine groups were analyzed using Student’s t test. Data from the carnitine, savory, parsley and rosemary groups were analyzed using one-way ANOVA. (**) p < 0.01 and (***) p < 0.001 denote significant differences compared with the carnitine group.
Figure 7
Figure 7
Plasma levels of cytokines and chemokines in mice from the treatment groups. (A) IFNɣ; (B) TNFα; (C) IL−4; (D) IL−6; (E) IL−12p70; (F) IL−22; (G) IL−23; (H) CXCL10 (IP−10); (I) CXCL1 (GROα); (J) CCL2 (MCP−1); and (K) CCL11 (Eotaxin) levels. Dots are individual values. Bars are means ± SEM of log10-transformed concentrations of cytokines and chemokines (pg mL−1). Data from the control and carnitine groups were analyzed using Student’s t test. Data from the carnitine, savory, parsley and rosemary groups were analyzed using one-way ANOVA. ($) p < 0.05 denotes significant differences compared with the control group. (*) p < 0.05 and (**) p < 0.01 denote significant differences compared with the carnitine group.
Figure 8
Figure 8
Plasma levels of protein carbonyls and pentosidine in mice from the treatment groups. (A) Aminoadipic semialdehyde (AAS); (B) Glutamic semialdehyde (GGS); and (C) Pentosidine levels. Dots are individual values. Bars are means ± SEM of AAS (nmol mg−1), GGS (nmol mg−1) and pentosidine (fluorescence intensity) concentrations. Data from the control and carnitine groups were analyzed using Student’s t test. Data from the carnitine, savory, parsley and rosemary groups were analyzed using one-way ANOVA. (*) p < 0.05 and (***) p < 0.001 denotes significant differences compared with the carnitine group.

References

    1. Timmis A., Townsend N., Gale C.P., Torbica A., Lettino M., Petersen S.E., Mossialos E.A., Maggioni A.P., Kazakiewicz D., May H.T., et al. European Society of Cardiology: Cardiovascular Disease Statistics 2019. Eur. Heart J. 2020;41:12–85. doi: 10.1093/eurheartj/ehz859. - DOI - PubMed
    1. Timmis A., Vardas P., Townsend N., Torbica A., Katus H., De Smedt D., Gale C.P., Maggioni A.P., Petersen S.E., Huculeci R., et al. European Society of Cardiology: Cardiovascular Disease Statistics 2021: Executive Summary. Eur. Hear. J.—Qual. Care Clin. Outcomes. 2022;8:377–382. doi: 10.1093/ehjqcco/qcac014. - DOI - PubMed
    1. Lau D.C.W. Metabolic Syndrome: Perception or Reality? Curr. Atheroscler. Rep. 2009;11:264–271. doi: 10.1007/s11883-009-0041-7. - DOI - PubMed
    1. Sanchez-Alcoholado L., Castellano-Castillo D., Jordán-Martínez L., Moreno-Indias I., Cardila-Cruz P., Elena D., Muñoz-Garcia A.J., Queipo-Ortuño M.I., Jimenez-Navarro M. Role of Gut Microbiota on Cardio-Metabolic Parameters and Immunity in Coronary Artery Disease Patients with and without Type-2 Diabetes Mellitus. Front. Microbiol. 2017;8:1936. doi: 10.3389/fmicb.2017.01936. - DOI - PMC - PubMed
    1. Morelli M.B., Wang X., Santulli G. Functional Role of Gut Microbiota and PCSK9 in the Pathogenesis of Diabetes Mellitus and Cardiovascular Disease. Atherosclerosis. 2019;289:176–178. doi: 10.1016/j.atherosclerosis.2019.07.023. - DOI - PMC - PubMed