. 2022 Nov 3;22(21):8470.
doi: 10.3390/s22218470.

New Sensing and Radar Absorbing Laminate Combining Structural Damage Detection and Electromagnetic Wave Absorption Properties

Affiliations

New Sensing and Radar Absorbing Laminate Combining Structural Damage Detection and Electromagnetic Wave Absorption Properties

Federico Cozzolino et al. Sensors (Basel). .

Abstract

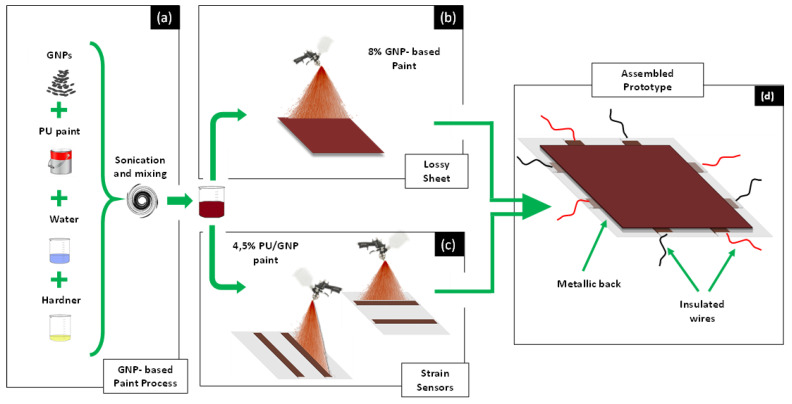
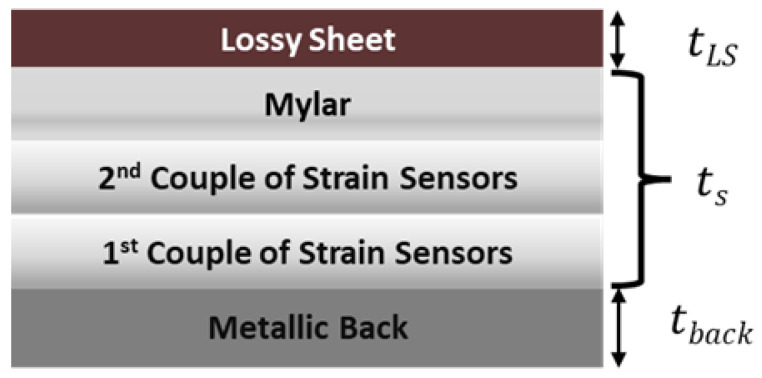
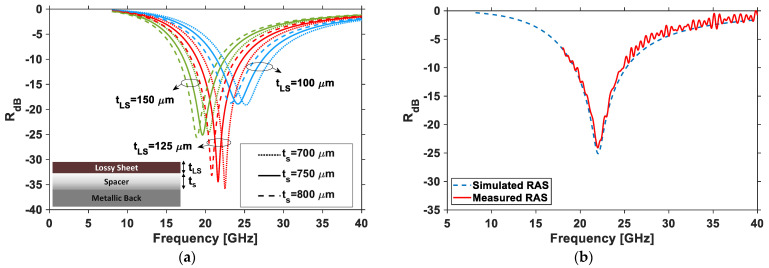
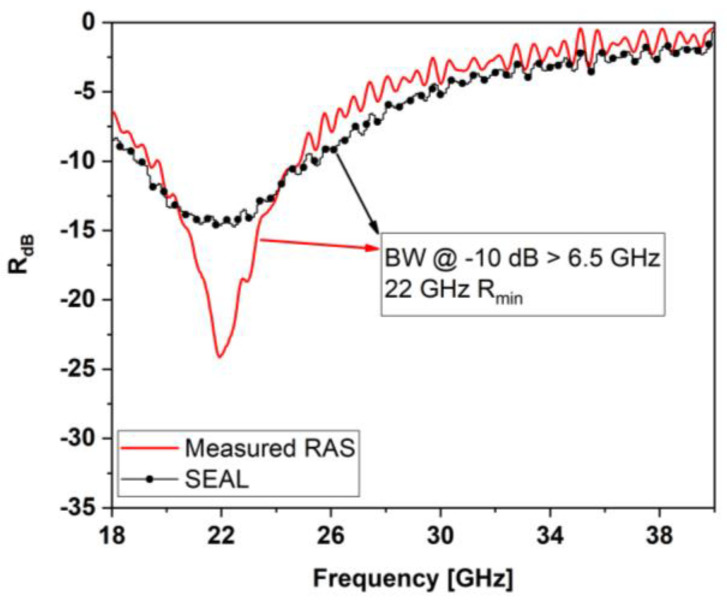
Within the paradigm of smart mobility, the development of innovative materials aimed at improving resilience against structural failure in lightweight vehicles and electromagnetic interferences (EMI) due to wireless communications in guidance systems is of crucial relevance to improve safety, sustainability, and reliability in both aeronautical and automotive applications. In particular, the integration of intelligent structural health monitoring and electromagnetic (EM) shielding systems with radio frequency absorbing properties into a polymer composite laminate is still a challenge. In this paper, we present an innovative system consisting of a multi-layered thin panel which integrates nanostructured coatings to combine EM disturbance suppression and low-energy impact monitoring ability. Specifically, it is composed of a stack of dielectric and conductive layers constituting the sensing and EM-absorbing laminate (SEAL). The conductive layers are made of a polyurethane paint filled with graphene nanoplatelets (GNPs) at different concentrations to tailor the effective electrical conductivity and the functionality of the material. Basically, the panel includes a piezoresistive grid, obtained by selectively spraying onto mylar a low-conductive paint with 4.5 wt.% of GNPs and an EM-absorbing lossy sheet made of the same polyurethane paint but properly modified with a higher weight fraction (8 wt.%) of graphene. The responses of the grid's strain sensors were analyzed through quasi-static mechanical bending tests, whereas the absorbing properties were evaluated through free-space and waveguide-based measurement techniques in the X, Ku, K, and Ka bands. The experimental results were also validated by numerical simulations.

Keywords: EMI suppression; aircraft; electromagnetic absorbing material; graphene-based paint; low observability; multifunctional system; piezoresistive strain sensors; sensor array; structural health monitoring.


Conflict of interest statement

The authors declare no conflict of interest.

Figures

Figure 1
Figure 1
Schematic representation of the fabrication steps of the sensorized radar-absorbing structure: (a) production of the paints loaded at different weight concentrations of GNPs; (b) realization of the lossy sheet; (c) realization of the strain sensor array; (d) final assembled structure.
Figure 2
Figure 2
Set-up for the spray deposition of the GNP-based paint.
Figure 3
Figure 3
(a) Schematic representation of the piezoresistive sensor; (b) picture of the sensor realized on a mylar substrate glued onto an aluminum beam for the execution of the electromechanical tests.
Figure 4
Figure 4
Picture of the grid constituted by the two orthogonal couples of piezoresistive sensors on an aluminum plate.
Figure 5
Figure 5
Sketch of the SEAL constituted by the stack of five different layers: the lossy sheet on a mylar substrate (RAS), two mylar layers with sensor strips, and the aluminum back plate.
Figure 6
Figure 6
Picture of the final structure (SEAL) after the assembly of the RAS and the layers with the sensor array.
Figure 7
Figure 7
AFM image of the GNPs (a) and their corresponding height profiles (b).
Figure 8
Figure 8
FE-SEM images of the surfaces of: (a) the polyurethane unfilled matrix (neat paint); (b) the produced sensor with 4.5 wt.% of GNPs; (c) the lossy sheet of RAS obtained using 8 wt.% of GNPs.
Figure 9
Figure 9
FE-SEM images of the cross section (a) and surface (b) of the graphene-based paint loaded at 4.5 wt.% of GNPs.
Figure 10
Figure 10
Trends of percentage change of resistance and variation of the gauge factor in the piezoresistive sensor subjected to the three-point bending test, as a function of deformation.
Figure 11
Figure 11
Set-up used to perform the different tests on the prototype with the array of strain sensors (w = 15 cm; l = 15 cm; d = 10 cm).
Figure 12
Figure 12
Diagram of connections between sensors and the DAQ. The sensors are represented by the 4 variable resistors RS1,RS2, RS3, RS4; the voltages acquired with the acquisition board are respectively VS1,VS2, VS3, VS4.
Figure 13
Figure 13
(a) Schematic representation of the distributed load applied to the sample with the sensor array and conductivity map of the piezoresistive strips at the maximum induced plate deformation; normalized resistance variation of the four sensors over time at (b) 5 mm/min, (c) 10 mm/min, and (d) 20 mm/min crosshead speed.
Figure 14
Figure 14
Comparison between the simulation of the sensors perpendicular (a) and parallel (b) to the load.
Figure 15
Figure 15
(a) Cyclic diagram of displacement impressed by the crosshead. (b) Normalized resistance variation of the four sensors over time, with the crosshead moving repetitively from 0 mm to 2.5 mm.
Figure 16
Figure 16
Real and imaginary parts of the complex permittivity of the graphene-based paint from X to K bands and the simulated trend obtained by the Debye’s formula up to 40 GHz.
Figure 17
Figure 17
(a) Reflection as a function of different combinations of spacer and lossy thicknesses. (b) Comparison between measured (red line) and simulated (dashed blue line) reflection coefficients of RAS with ts = 750 µm and tLS = 120 µm.
Figure 18
Figure 18
Set-up for the reflection coefficient measurement of the SEAL.
Figure 19
Figure 19
Comparison between the measured reflection coefficient of the SEAL (black line) and that of the RAS without sensors (red line).
Figure 20
Figure 20
(a) Schematic representation of the surface subdivision map. Conductivity maps of the piezoresistive strips at the maximum induced plate deformation of the sensors as a function of the load applied on the zones: P1 (b), P4 (c), and P5 (d).

References

    1. Harris C.E., Starnes J.H., Shuart M.J. Design and Manufacturing of Aerospace Composite Structures, State-of-the-Art Assessment. J. Aircr. 2002;39:545–560. doi: 10.2514/2.2992. - DOI
    1. Giurgiutiu V. In: Smart Materials and Health Monitoring of Composites. Beaumont P.W.R., Zweben C.H., editors. Elsevier; Oxford, UK: 2018. pp. 364–381. Chapter 7.19.
    1. Butler R., Rhead A., Dodwell T. Comprehensive Composite Materials II. Elsevier Academic Press Inc.; Cambridge, MA, USA: 2018. Optimum Design and Damage Tolerance of Compressively Loaded Laminates; pp. 118–135.
    1. Rocha H., Semprimoschnig C., Nunes J.P. Sensors for Process and Structural Health Monitoring of Aerospace Composites: A Review. Eng. Struct. 2021;237:112231. doi: 10.1016/j.engstruct.2021.112231. - DOI
    1. Güemes A. SHM Technologies and Applications in Aircraft Structures; Proceedings of the 5th International Symposium on NDT in Aerospace; Singapore. 13–15 November 2013.

LinkOut - more resources