

Development of an Artificial Neural Network Algorithm Embedded in an On-Site Sensor for Water Level Forecasting
- PMID: 36366229
- PMCID: PMC9657921
- DOI: 10.3390/s22218532
Development of an Artificial Neural Network Algorithm Embedded in an On-Site Sensor for Water Level Forecasting
Abstract
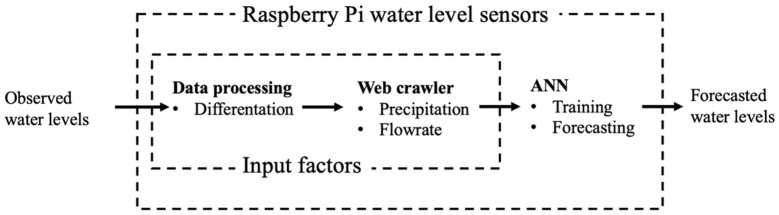
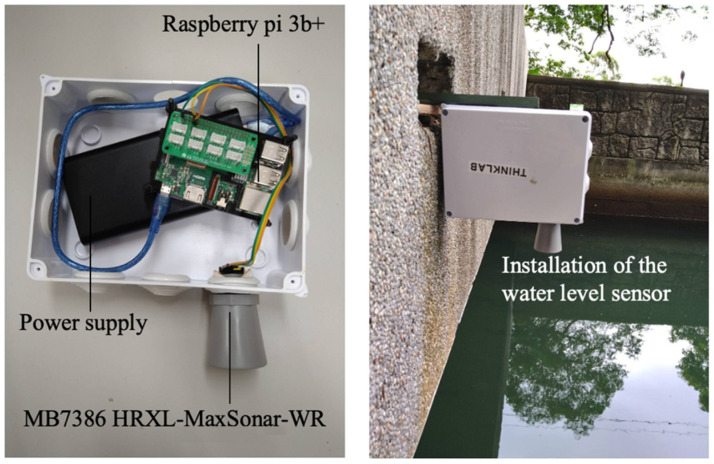
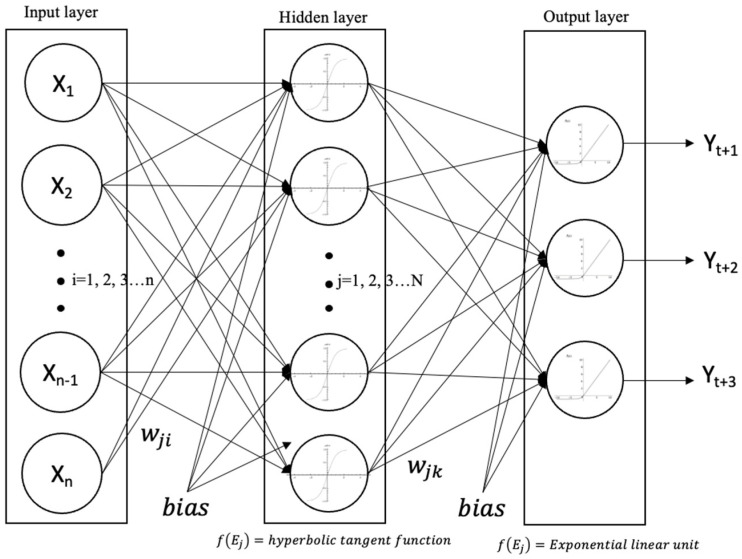
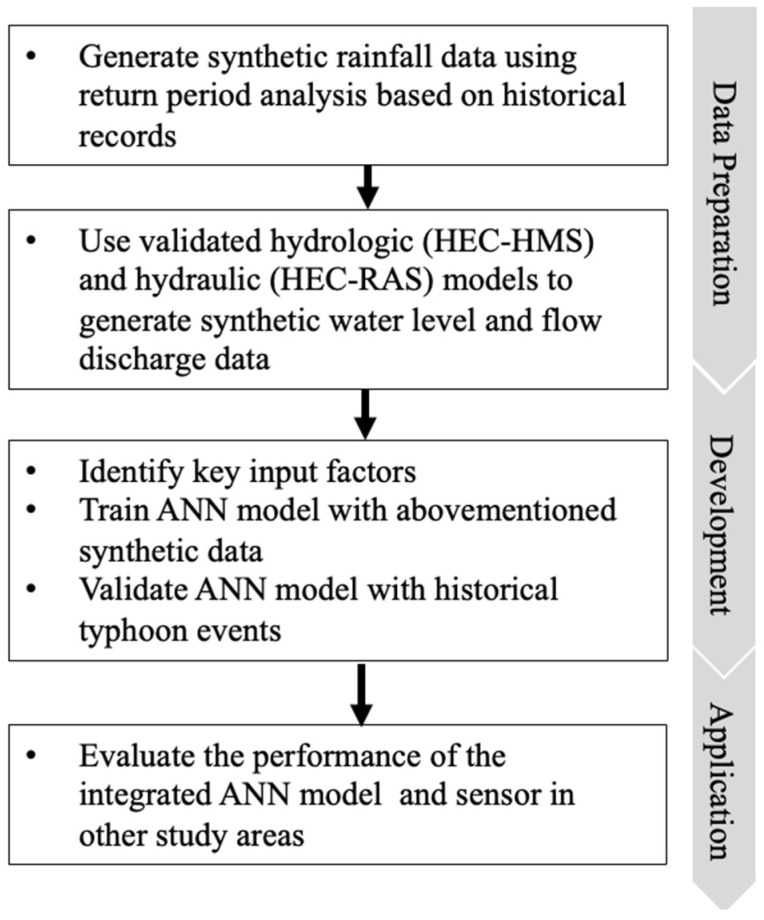
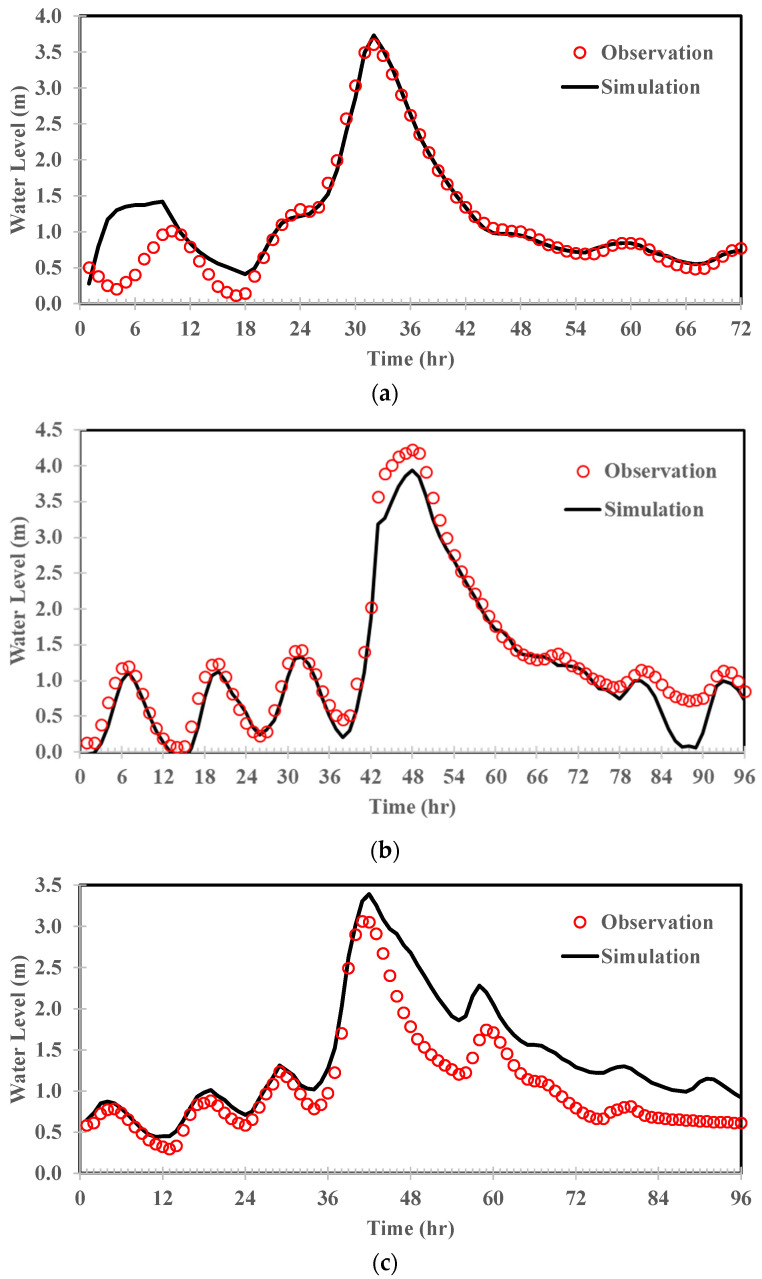
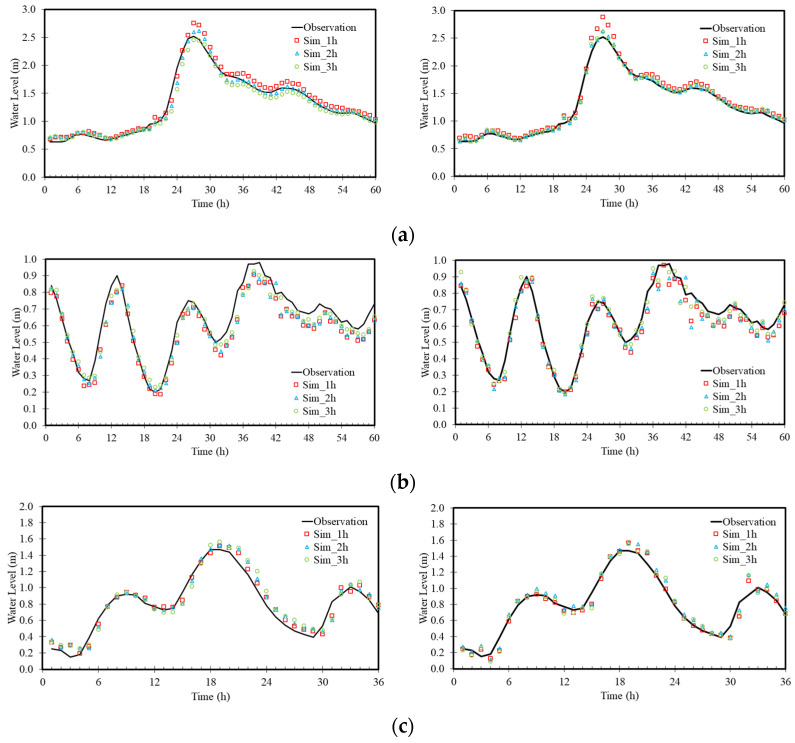
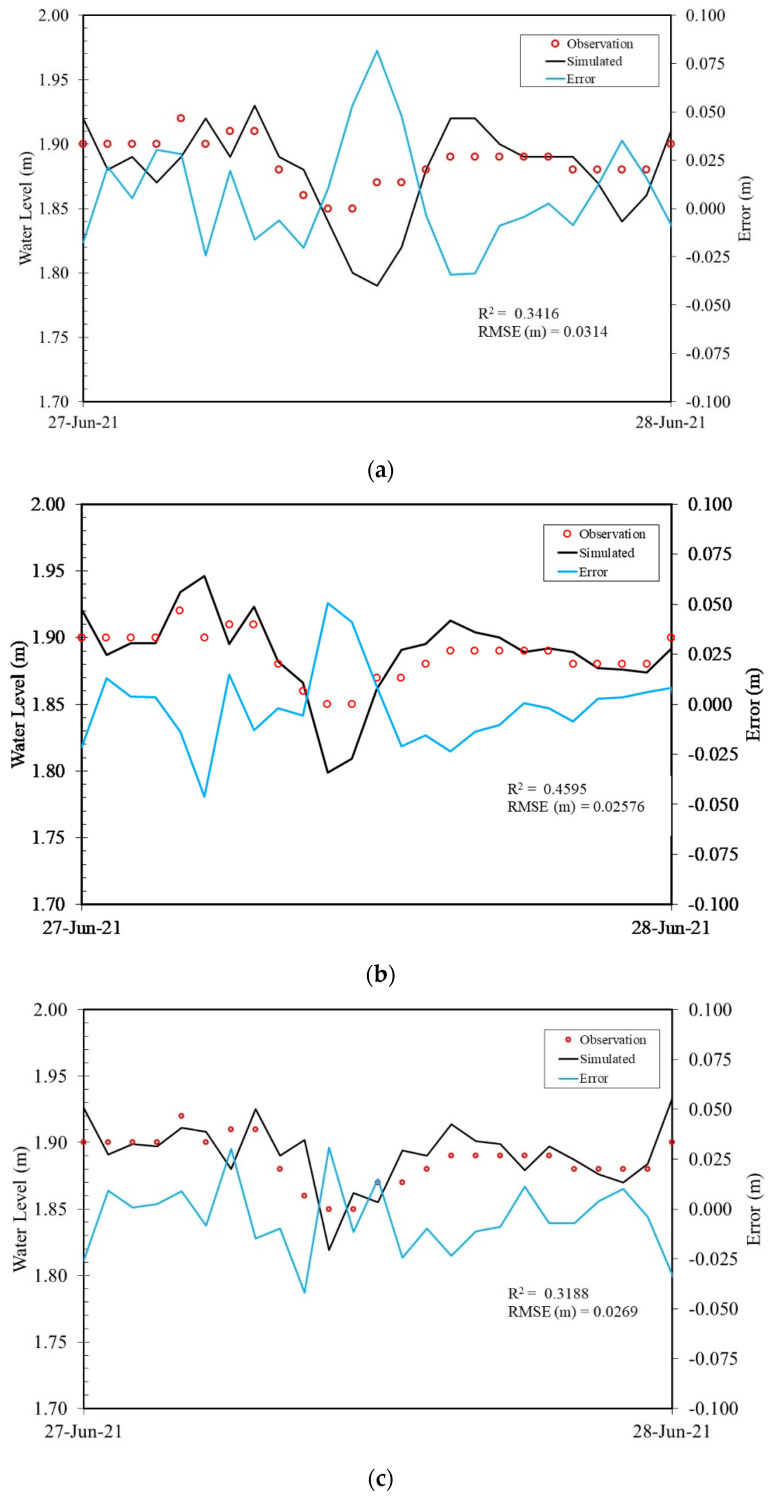
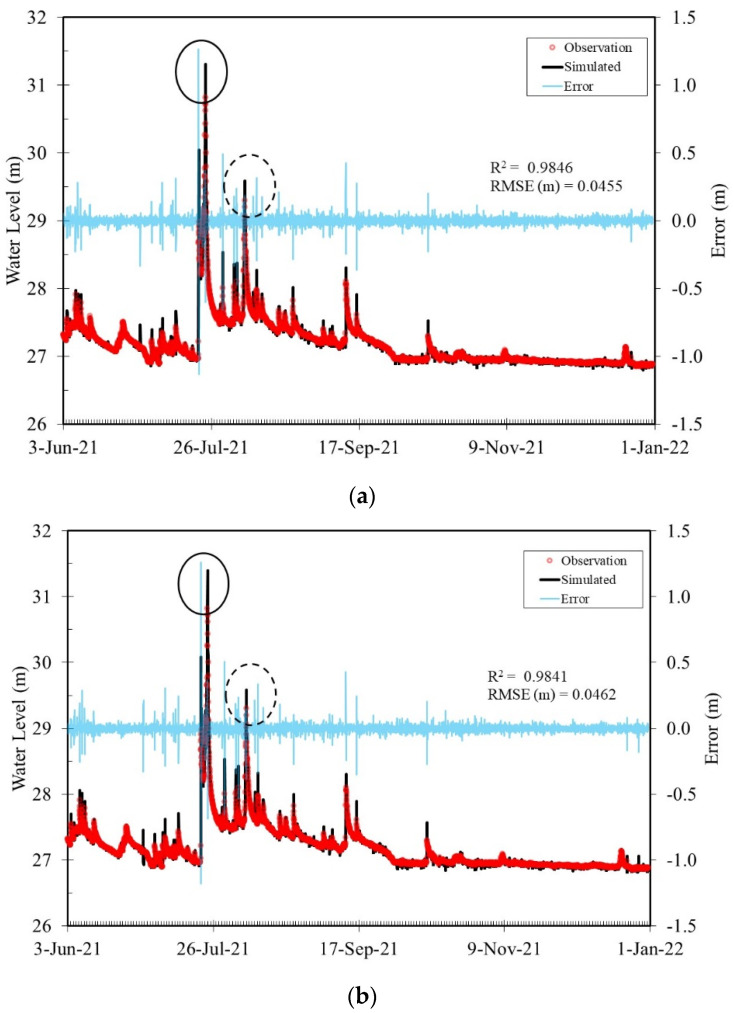
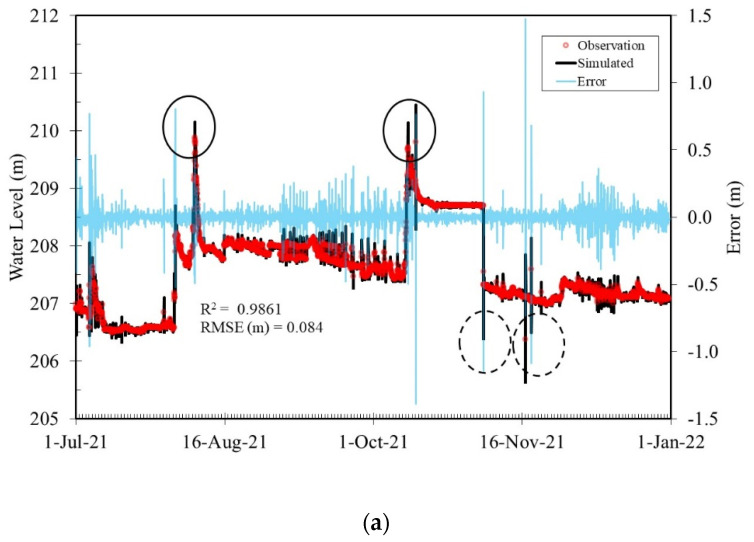
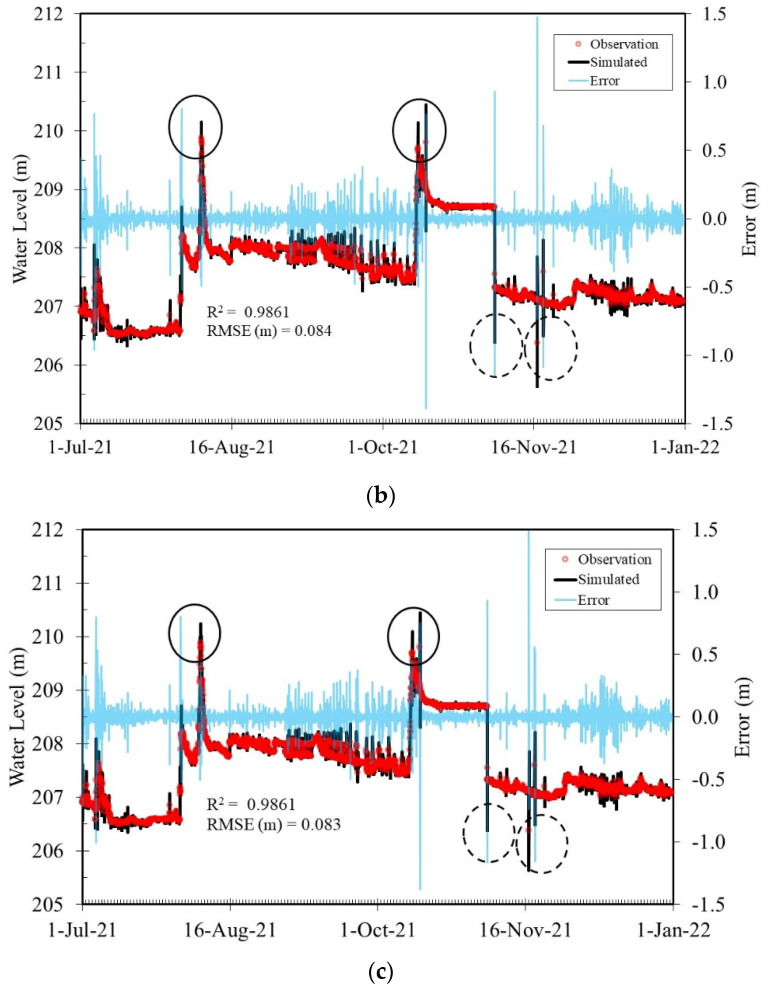
Extreme weather events cause stream overflow and lead to urban inundation. In this study, a decentralized flood monitoring system is proposed to provide water level predictions in streams three hours ahead. The customized sensor in the system measures the water levels and implements edge computing to produce future water levels. It is very different from traditional centralized monitoring systems and considered an innovation in the field. In edge computing, traditional physics-based algorithms are not computationally efficient if microprocessors are used in sensors. A correlation analysis was performed to identify key factors that influence the variations in the water level forecasts. For example, the second-order difference in the water level is considered to represent the acceleration or deacceleration of a water level rise. According to different input factors, three artificial neural network (ANN) models were developed. Four streams or canals were selected to test and evaluate the performance of the models. One case was used for model training and testing, and the others were used for model validation. The results demonstrated that the ANN model with the second-order water level difference as an input factor outperformed the other ANN models in terms of RMSE. The customized microprocessor-based sensor with an embedded ANN algorithm can be adopted to improve edge computing capabilities and support emergency response and decision making.
Keywords: ANN; decentralized; edge computing; microprocessor; water level prediction.
Conflict of interest statement
The authors declare no conflict of interest.
Figures

References
-
- Centre for Research on the Epidemiology of Disasters (CRED) 2021 Disasters in Numbers. CRED; Brussels, Belgium: 2021.
-
- Okazawa Y., Yeh P.J.-F., Kanae S., Oki T. Development of a global flood risk index based on natural and socio-economic factors. Hydrol. Sci. J. 2011;56:789–804. doi: 10.1080/02626667.2011.583249. - DOI
-
- Yildirim E., Demir I. An Integrated Flood Risk Assessment and Mitigation Framework: A Case Study for Middle Cedar River Basin, Iowa, US. Int. J. Disaster Risk Reduct. 2021;56:102113. doi: 10.1016/j.ijdrr.2021.102113. - DOI
-
- United Nations Office for Disaster Risk Reduction . Global Assessment Report on Global Disaster Risk Reduction GAR 2022-Our World at Risk: Transforming Governance for a Resilient Future. United Nations Office for Disaster Risk Reduction; Geneva, Switzerland: 2022.
MeSH terms
Substances
Grants and funding
LinkOut - more resources
Full Text Sources
