. 2022 Oct 25;10(11):1787.
doi: 10.3390/vaccines10111787.

Metabolic Responses and Pathway Changes of Vero Cells under High-Vitamin B Medium

Affiliations

Metabolic Responses and Pathway Changes of Vero Cells under High-Vitamin B Medium

Shouzhi Yu et al. Vaccines (Basel). .

Abstract

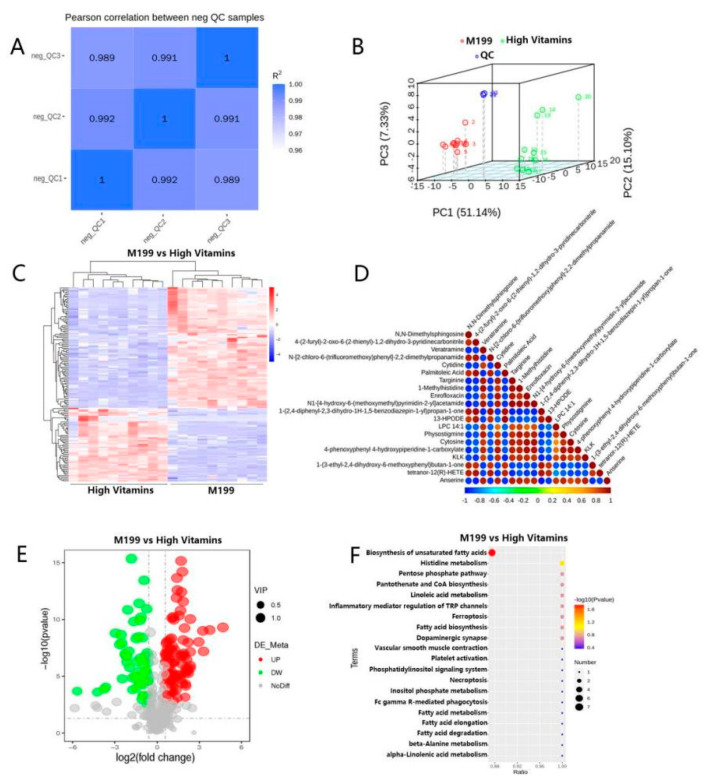
The production efficiency of a cell substrate directly affects the yield of target products such as viruses, while its density is mainly regulated by the type of culture medium and culture conditions. In this study, Vero cells were used as model cells for systematic medium screening, and a high-efficiency medium for biological drug production was identified. Through the results of cell proliferation by a cell counting kit (CCK)-8 assay, 5-Ethynyl-2'-deoxyuridine(EdU) assay, real-time quantitative PCR (RT-qPCR) and Western blotting, we found that adding an appropriate amount of vitamin B to the conventional basic medium can significantly improve and maintain the high-density growth of Vero cells. In addition, the molecular mechanism of the high-density culture of Vero cells promoted by B vitamins is explained for the first time by using the systems multi-omics analysis methods. Here, we determined that B vitamins regulate cell proliferation through the synthesis and metabolism of unsaturated fatty acids, affecting the productivity of cell substrate in industrial production. This study provides an important tool for the screening of key components of cell-based high-efficiency medium.

Keywords: Vero cell; culture medium; multi-omics analysis; vitamin B.


Conflict of interest statement

The authors declare no conflict of interest.

Figures

Figure 1
Figure 1
Vitamins supplements promote Vero cell proliferation. (A) Effect of different vitamin concentrations on Vero cell proliferation. Different concentrations of vitamin B were added to Vero with the same density. After 96 h of culture under the same conditions, the total number of cells was detected by CountStar. The cell number ratios were calculated and the histogram was drawn for t-test. (B) Cell proliferation curve detection. Using CCK8 reagent to detect the OD450/650 of Vero cells at the designated time point and draw the proliferation curve, t-tests were counted on day 6. (C) Effect of cell proliferation by EdU test. The cells were stained with EdU (red) and DAPI (blue). The percentage of Edu-positive cells is shown on the right and the histogram was drawn for the t-test. (D) Vitamins supplements improve the expression of PCNA and Ki67 both of mRNA (left) and protein (right) level expression. Housekeeping gene GAPDH is an internal reference. Error bars represent SEM. ** p < 0.01; *** p < 0.001.
Figure 2
Figure 2
Transcriptomic analysis. (A) Box plot. Box plots of expression levels of different samples, where the abscissa is the sample name, and the ordinate is log10 (FPKM + 1). (B) The abscissa represents the fold change (log2 Fold Change) of gene expression between different samples or comparison combinations, the larger the absolute value of the abscissa, the greater the fold change of expression between the two comparison combinations; the ordinate represents the significance level of the expression difference. Up-regulated genes are indicated by red dots, down-regulated genes are indicated by green dots and blue dots are genes that did not change significantly. (C) The abscissa is the sample, the ordinate is the differential gene, the left side is the clustering of genes according to the similarity of expression, the upper is the clustering of each sample according to the similarity of the expression profile, the expression level is gradually increased from blue to red and the numbers are uniform the relative expression level after transformation. (D) The abscissa represents the name of GO items, which are divided into three categories by boxes, BP biological process, CC cell components and MF molecular functions, which are distinguished by different bars and boxes and the ordinate is the number of genes enriched by GO items. (E) The vertical axis in the figure represents different pathways, and the horizontal axis represents the proportion of significantly differentially expressed genes in the corresponding pathway to all genes in the pathway. The size of the circle represents the number of genes enriched in the corresponding pathway, and the larger the circle, the more genes are enriched in the pathway. The color represents the significance of enrichment, and the closer to red, the more significant it is.
Figure 3
Figure 3
Proteomic analysis. (A) PCA analysis. The abscissa PC1 and the ordinate PC2 represent the scores of the principal components ranking, respectively, and the scatter color represents the experimental grouping of samples. (B) Repeatability CV analysis. The figure shows the cumulative CV values of all proteins in the corresponding samples, which indicated the repeatability of the sample. (C) Differential protein volcano map. The abscissa represents the difference multiple (log2 value) of the differential protein, the vertical axis represents p-value (−log10 value), black represents the protein with no-significant difference, red represents the up-regulated and green represents the down-regulated. (D) Differential protein-clustering heat map. The vertical is the clustering of samples, and the horizontal is the clustering of proteins. The expression-pattern clustering of protein content among samples can be seen from the vertical clustering. (E) Go enrichment histogram shows the enrichment results in three categories, each of which shows up to 20 (p value ≤ 0.05). (F) KEGG-enrichment bubble diagram. The abscissa in the diagram is the ratio of the number of differential proteins in the corresponding pathway to the number of total proteins identified in the pathway. The size of the dot represents the number of differential proteins in the corresponding pathway. The color of the point represents the p-value value of the hypergeometric test. (G) Subcellular localization analysis of differential proteins.
Figure 4
Figure 4
Metabolomics analysis. (A) QC sample correlation. The abscissa and ordinate are the QC samples, and the closer the value of R2 is to 1, the better the correlation. (B) PCA analysis. The abscissa PC1 and the ordinate PC2 represent the scores of the first and second principal components, respectively, and the scattered points in different colors represent samples from different experimental groups. (C) Total differential metabolite-cluster heat map. Hierarchical clustering analysis was performed on the differential metabolites between each comparison pair, and the relative quantitative values of the differential metabolites were normalized, transformed and clustered. The horizontal is the clustering of metabolites, and the vertical is the sample grouping. (D) Plot of differential metabolite correlation analysis. By calculating the Pearson correlation coefficient between all the differential metabolites and selecting the top 20 differential metabolites with the significance level p-value sorted from small to large for display, you can check the consistency of the metabolite and metabolite change trends. (E) Sample comparison versus volcano plot. The volcano plot is drawn according to the VIP value, p-value and FC value of the differential metabolites between the comparison pairs, which can visually display the overall distribution of the differential metabolites. (F) KEGG-enrichment bubble map: according to the KEGG enrichment results, select the top 20 pathways with p-values from small to large to draw a bubble map. The abscissa is x/y (the number of differential metabolites in the corresponding metabolic pathway/the total number of metabolites identified in the pathway); the larger the value, the higher the enrichment of differential metabolites in the pathway. The ordinate is the KEGG pathway name.

Similar articles

Cited by

References

    1. Montagnon B.J., Fanget B., Vincent-Falquet J.C. Industrial-scale production of inactivated poliovirus vaccine prepared by culture of Vero cells on microcarrier. Rev. Infect. Dis. 2010;6((Suppl. 2)):S341–S344. doi: 10.1093/clinids/6.Supplement_2.S341. - DOI - PubMed
    1. Montomoli E., Khadang B., Piccirella S., Trombetta C., Mennitto E., Manini I., Stanzani V., Lapini G. Cell culture-derived influenza vaccines from Vero cells: A new horizon for vaccine production. Expert Rev. Vaccines. 2014;11:587–594. doi: 10.1586/erv.12.24. - DOI - PubMed
    1. Barrett P.N., Mundt W., Kistner O., Howard M.K. Vero cell platform in vaccine production: Moving towards cell culture-based viral vaccines. Expert Rev. Vaccines. 2009;8:607. doi: 10.1586/erv.09.19. - DOI - PubMed
    1. Genzel Y., Dietzsch C., Rapp E., Schwarzer J., Reichl U. MDCK and Vero cells for influenza virus vaccine production: A one-to-one comparison up to lab-scale bioreactor cultivation. Appl. Microbiol. Biotechnol. 2010;88:461–475. doi: 10.1007/s00253-010-2742-9. - DOI - PMC - PubMed
    1. Grenier B., Hamza B., Biron G., Xueref C., Viarme F., Roumiantzeff M. Seroimmunity following vaccination in infants by an inactivated poliovirus vaccine prepared on Vero cells. Rev. Infect. Dis. 2010;6((Suppl. 2)):S545–S547. doi: 10.1093/clinids/6.Supplement_2.S545. - DOI - PubMed

LinkOut - more resources