. 2022 Oct 25;10(11):1788.
doi: 10.3390/vaccines10111788.

New Insights into the Estimation of Reproduction Numbers during an Epidemic

Affiliations

New Insights into the Estimation of Reproduction Numbers during an Epidemic

Giovanni Sebastiani et al. Vaccines (Basel). .

Abstract

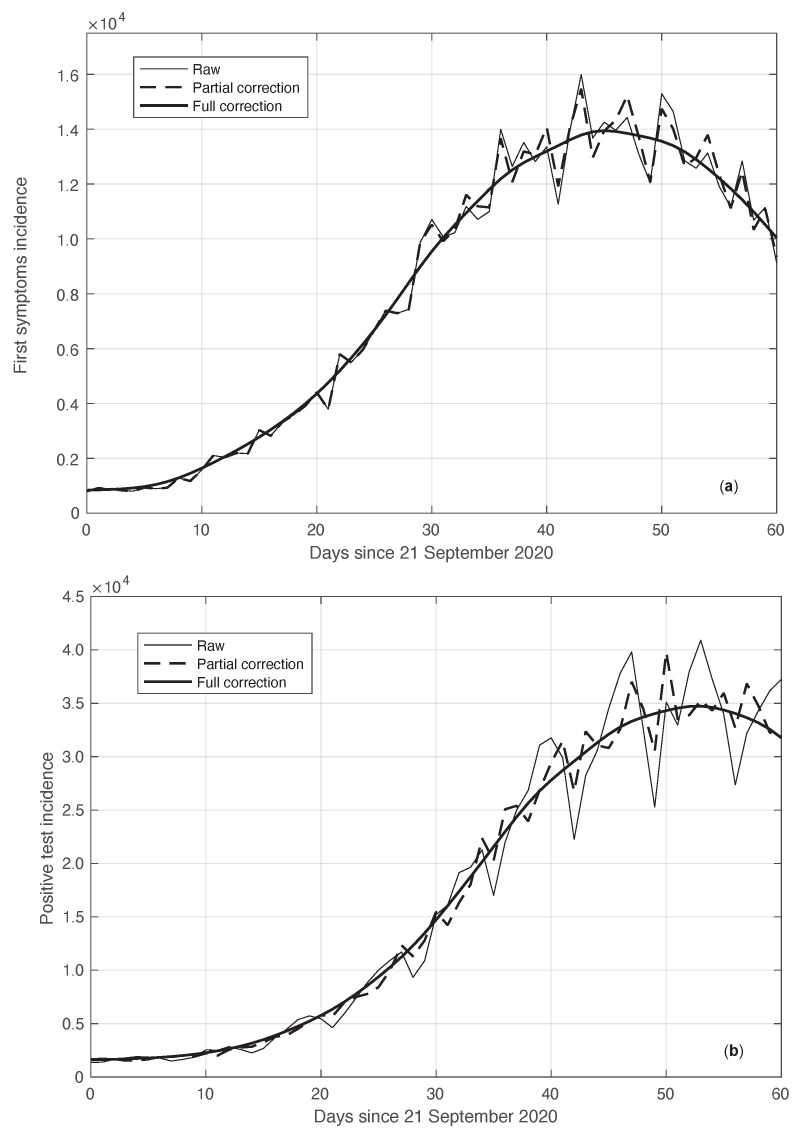
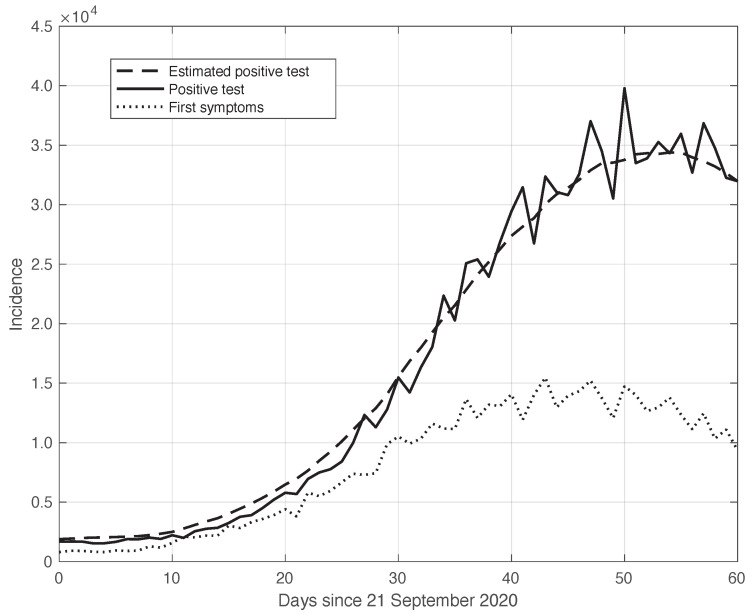
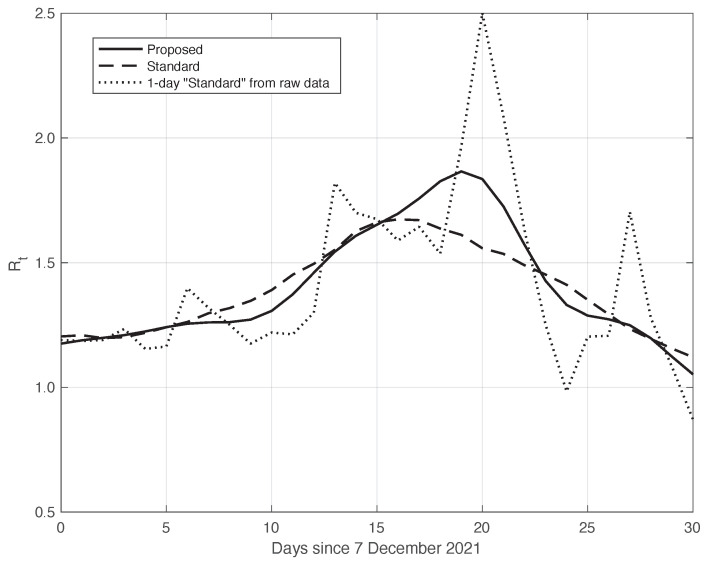
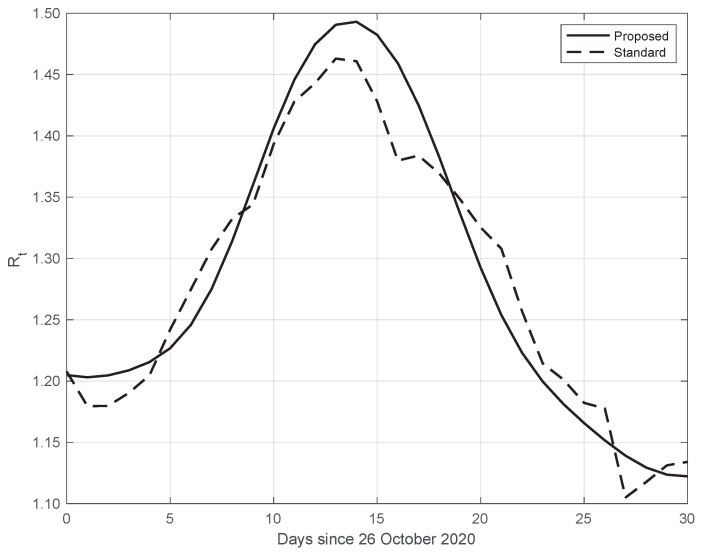
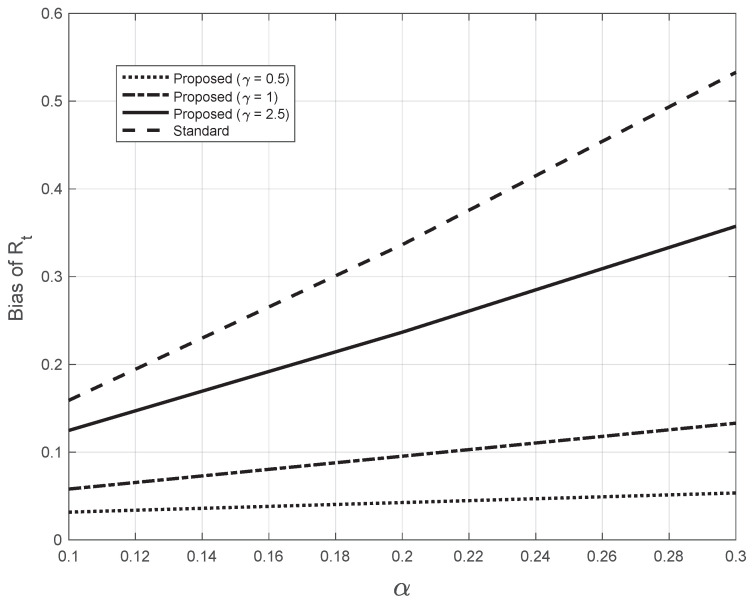
In this paper, we deal with the problem of estimating the reproduction number Rt during an epidemic, as it represents one of the most used indicators to study and control this phenomenon. In particular, we focus on two issues. First, to estimate Rt, we consider the use of positive test case data as an alternative to the first symptoms data, which are typically used. We both theoretically and empirically study the relationship between the two approaches. Second, we modify a method for estimating Rt during an epidemic that is widely used by public institutions in several countries worldwide. Our procedure is not affected by the problems deriving from the hypothesis of Rt local constancy, which is assumed in the standard approach. We illustrate the results obtained by applying the proposed methodologies to real and simulated SARS-CoV-2 datasets. In both cases, we also apply some specific methods to reduce systematic and random errors affecting the data. Our results show that the Rt during an epidemic can be estimated by using the positive test data, and that our estimator outperforms the standard estimator that makes use of the first symptoms data. It is hoped that the techniques proposed here could help in the study and control of epidemics, particularly the current SARS-CoV-2 pandemic.

Keywords: SARS-CoV-2; epidemic evolution; estimation techniques; mathematical analysis; reproduction number.


Conflict of interest statement

The authors declare no conflict of interest.

Figures

Figure 1
Figure 1
Real SARS-CoV-2 Italian incidence (number of new cases per day) from 21 September to 20 November 2020. In panels (a,b), the first symptoms and positive test data are respectively plotted. Measured data (thin continuous lines) are shown together with their corrected version from the one-week periodic component (thick dashed lines) and the non-parametric component of the model (thick continuous lines). See Section 2.2 for details.
Figure 2
Figure 2
Standard deviation of the local fluctuations of a real SARS-CoV-2 Italian positive test sequence from 21 September to 20 November 2020, illustrated in Figure 1, as a function of their expected value. The continuous line represents the best fit with a degree 2 polynomial model, which in this case is reduced to a straight line.
Figure 3
Figure 3
Standard deviation of the real SARS-CoV-2 Italian first symptoms sequence from 21 September to 20 November 2020, illustrated in Figure 1, as a function of their expected value. The continuous line represents the best fit with a degree 2 polynomial model.
Figure 4
Figure 4
Relationship between the sequences of the positive test (continuous line) and the first symptoms (dotted line) relative to the real SARS-CoV-2 Italian data from 21 September to 20 November 2020, illustrated in Figure 1. The curves were obtained by correcting the data from a one-week periodic component (see Section 2.2). The dashed line shows the results of the convolution between the first symptoms sequence and the optimal kernel (see Section 2.3).
Figure 5
Figure 5
Sequence of the reproduction number Rt estimated by the standard method for real SARS-CoV-2 Italian data from 21 September to 20 November 2020, illustrated in Figure 1. The continuous and dashed lines refer to the first symptoms and the shifted positive test sequences, respectively. The estimated optimal shift is 6 days. The dotted line represents the threshold for the epidemic to spread or die out.
Figure 6
Figure 6
Sequence of the reproduction number Rt estimated by the standard method for real SARS-CoV-2 Italian data from 7 December 2021 to 6 January 2022. The continuous and dashed lines refer to the first symptoms and the shifted positive test sequences, respectively. The estimated optimal shift is 4 days.
Figure 7
Figure 7
Standard deviation of the local fluctuations of the real SARS-CoV-2 Italian positive test sequence from 7 December 2021 to 6 January 2022, as a function of their expected value. The continuous line represents the best fit with a degree 2 polynomial model.
Figure 8
Figure 8
Sequence of the reproduction number Rt for real SARS-CoV-2 Italian data from 21 September to 20 November 2020, illustrated in Figure 1. The continuous line corresponds to the proposed method, while the dashed line corresponds to the standard approach.
Figure 9
Figure 9
The same as in Figure 8, but the modified standard Rt curve is now obtained by first applying estimator (6) to the data reduced by the systematic error, and then performing arithmetic averaging in time intervals It.
Figure 10
Figure 10
Sequence of the reproduction number Rt for real SARS-CoV-2 Italian data from 7 December 2021 to 6 January 2022. The continuous line corresponds to the proposed method, the dashed line to the standard approach, while the dotted line is relative to the estimation by (6) from the raw data.
Figure 11
Figure 11
Sequence of the reproduction number Rt for real SARS-CoV-2 data in New York city, from 26 October to 25 November 2020. The continuous line corresponds to the proposed method, while the dashed line corresponds to the standard approach.
Figure 12
Figure 12
Mean of the Rt curve estimated by the proposed method from a realistic SARS-CoV-2 first symptoms synthetic data sample (n=100). The relative 95% CI is shown as a grey shadow. The “true” Rt sequence is given as a dotted line.
Figure 13
Figure 13
Mean of the Rt curve estimated by the standard method from a realistic SARS-CoV-2 first symptoms synthetic data sample (n=100). The relative 95% CI is shown as a grey shadow. The “true” Rt sequence is given as a dotted line. The mean is obtained from 100 independent realizations of the synthetic data.
Figure 14
Figure 14
Synthetic epidemic data of the second type (see Section 3.2). In panel (a), we show the Rt sequence along time. The value of the slope α of the linear growing phase is 0.2 (days1). In panel (b), we show the corresponding incidence data recursively obtained from Equation (12).
Figure 15
Figure 15
Bias of the Rt estimated from the synthetic epidemic data, illustrated in Figure 14. The bias is plotted against the slope α. The dashed line corresponds to the estimate from the standard method. The other lines correspond to the proposed method, with three fixed values for the bandwidth γ in Equations (7), as indicated in the legend. The last value chosen is close to the one (2.7) found by the proposed method for the real SARS-CoV-2 Italian data from 21 September to 20 November 2020, illustrated in Figure 1.

Similar articles

References

    1. Cauchemez S., Fraser C., Van Kerkhove M.D., Donnelly C.A., Riley S., Rambaut A., Enouf V., van der Werf S., Ferguson N.M. Middle East respiratory syndrome coronavirus: Quantification of the extent of the epidemic, surveillance biases, and transmissibility. Lancet Infect. Dis. 2014;14:50–56. doi: 10.1016/S1473-3099(13)70304-9. - DOI - PMC - PubMed
    1. Nouvellet P., Cori A., Garske T., Blake I.M., Dorigatti I., Hinsley W., Jombart T., Mills H.L., Nedjati-Gilani G., Van Kerkhove M.D., et al. A simple approach to measure transmissibility and forecast incidence. Epidemics. 2018;22:29–35. doi: 10.1016/j.epidem.2017.02.012. - DOI - PMC - PubMed
    1. Fraser C. Estimating individual and household reproduction numbers in an emerging epidemic. PLoS ONE. 2007;2:e758. doi: 10.1371/journal.pone.0000758. - DOI - PMC - PubMed
    1. Kermack W.O., McKendrick A.G. A contribution to the mathematical theory of epidemics. Proc. R. Soc. London. Ser. A. 1927;115:700–721.
    1. Murphy G.F. COVID-19 and graft-versus-host disease: A tale of two diseases (and why age matters) Lab. Investig. 2021;101:274–279. doi: 10.1038/s41374-020-00520-2. - DOI - PMC - PubMed

LinkOut - more resources