Review
. 2022 Nov;18(11):e10768.
doi: 10.15252/msb.202110768.

Pooled genetic screens with image-based profiling

Affiliations
Review

Pooled genetic screens with image-based profiling

Russell T Walton et al. Mol Syst Biol. 2022 Nov.

Abstract

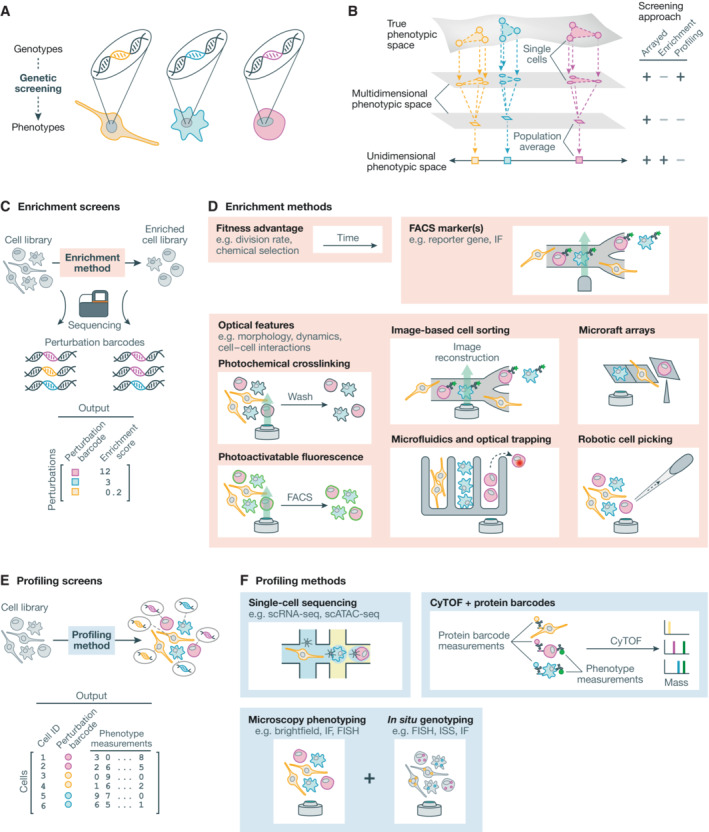
Spatial structure in biology, spanning molecular, organellular, cellular, tissue, and organismal scales, is encoded through a combination of genetic and epigenetic factors in individual cells. Microscopy remains the most direct approach to exploring the intricate spatial complexity defining biological systems and the structured dynamic responses of these systems to perturbations. Genetic screens with deep single-cell profiling via image features or gene expression programs have the capacity to show how biological systems work in detail by cataloging many cellular phenotypes with one experimental assay. Microscopy-based cellular profiling provides information complementary to next-generation sequencing (NGS) profiling and has only recently become compatible with large-scale genetic screens. Optical screening now offers the scale needed for systematic characterization and is poised for further scale-up. We discuss how these methodologies, together with emerging technologies for genetic perturbation and microscopy-based multiplexed molecular phenotyping, are powering new approaches to reveal genotype-phenotype relationships.

Keywords: morphological profiling; multiplexed imaging; optical microscopy profiling; optical screening; pooled genetic screening.


Figures

Figure 1
Figure 1. Approaches to genetic screening
(A) Genetic screens seek to map genotypes to the phenotypes they produce. (B) Screening methodologies capture projections of cell phenotypes. Pooled profiling screens project individual cells into a multidimensional phenotypic space defined by the profiling method. Pooled enrichment screens project population averages into a unidimensional phenotypic space defined by the enrichment criteria. Arrayed screens can embody either of these phenotype–genotype associations. (C) Enrichment screens subject an initial cell library to an enrichment process to select for a phenotype of interest. Perturbation enrichment is determined by comparing the abundance of perturbation barcodes in the cell library before and after selection using next generation sequencing. (D) Cells can be enriched through a fitness advantage, fluorescence‐activated cell sorting, or one of several approaches to isolate cells based on microscopy‐defined features. (E) Profiling screens subject a complete cell library to profiling. Individual cells are assigned both perturbations and multidimensional phenotypic measurements. (F) Single cell profiling methods for genetic screening include single‐cell sequencing approaches, CyTOF using protein barcodes, and microscopy‐based phenotyping with in situ genotyping. FACS, fluorescence‐activated cell sorting; IF, immunofluorescence; scRNA‐seq, single‐cell RNA sequencing; scATAC‐seq, single‐cell assay for transposase‐accessible chromatin using sequencing; CyTOF, cytometry by time‐of‐flight.
Figure 2
Figure 2. Approaches to measure perturbation barcodes in situ
(A) Perturbation barcodes are genetically encoded and may be transcribed to RNA or transcribed and translated to protein epitopes. (B) Fluorescence in situ hybridization approaches measure RNA barcodes through iterative hybridization, imaging, and stripping of fluorescent probes. Diverse encoding schemes may be used. (C) In situ sequencing approaches clonally amplify barcode sequences in situ and read out barcodes through iterative cycles of sequencing/imaging. (D) Iterative immunofluorescence approaches detect protein barcodes—unique combinations of epitopes—by iteratively staining, imaging, and destaining with fluorescently labeled antibodies. Epitopes are used combinatorially in each barcode and diverse encoding schemes may be used.
Figure 3
Figure 3. Cellular barcoding and perturbation
(A) Applications of cellular barcoding. In pooled genetic screens, genetic perturbation libraries are used to introduce one or more genetic perturbations to cells with the same genetic background. Pooled cell models use barcodes to distinguish cells of different genetic backgrounds. Static clonal barcoding experiments use barcodes to track the progeny of individual clones. Dynamic subclonal barcoding approaches use dynamic barcodes to determine subclonal relationships between cells. (B) Approaches for programmable perturbation. Genetic perturbations, or changes to DNA sequence, include gene knockouts, introduction of new DNA sequences, or precise sequence changes. Epigenetic perturbations include changes to DNA accessibility, transcription factor recruitment, DNA methylation, histone modifications, and 3D genome structure. Transcriptomic perturbations include gene knockdown and precise sequence changes. DSBs, double strand breaks; HDR, homology‐directed repair; CRISPRa, CRISPR‐mediated activation of transcription; CRISPRi, CRISPR‐mediated interference of transcription; RNAi, RNA interference.
Figure 4
Figure 4. Optical methods for multidimensional phenotypic profiling
(A) Microscopy can capture molecular, subcellular, cellular, and multicellular phenotypes. (B) Live cell microscopy captures cellular dynamics. (C) Multiplexed protein measurements enable the observation of multiple proteins in each cell. Iterative immunofluorescence approaches rely on multiple rounds of sample staining with dye‐conjugated antibodies and fluorescence imaging. Oligo‐conjugated antibodies enable measurement with hybridization of fluorescence in situ hybridization probes. (D) Multiplexed RNA measurements enable the observation of multiple RNA species in each cell through either fluorescence in situ hybridization (FISH) or in situ sequencing (ISS). Linear FISH approaches encode RNA measurements with a linear encoding relative to imaging iterations. Exponential FISH techniques facilitate measurement of an exponentially increasing number of RNA species with a linear increase in imaging iterations. ISS approaches similarly enable exponential encoding of RNA species across sequencing cycles. Encoding efficiencies are theoretical and do not account for additional imaging cycles/rounds used for error correction in exponential‐scaling techniques. (E) RNA measurements requiring spot resolution can efficiently encode many RNA species but require high‐magnification imaging, while linear encoding methods can rely on integrated intensity measurements, instead of spot resolution, to enable high throughput at lower optical magnification. (F) Spatial detail and imaging time both increase as protein localization is imaged at higher magnification, presenting a tradeoff between cellular throughput and information content. (G) Estimated imaging throughputs and multiplexing capacities for selected multiplexed RNA and protein measurement approaches, based on magnification and z‐stack requirements, fluorescence channels, imaging rounds, and theoretical encoding efficiency without error correction. For comparison, the required imaging time to genotyping one million cells with 12 cycles of in situ sequencing is shown in gray. At high multiplexes, ISS phenotyping becomes less quantitative due to optical crowding. We do not consider expansion microscopy approaches here, which can increase the maximum multiplex for resolution‐limited techniques at the cost of increased imaging time. IF, immunofluorescence; FISH, fluorescence in situ hybridization; ISS, in situ sequencing.

Similar articles

Cited by

References

    1. Abudayyeh OO, Gootenberg JS, Essletzbichler P, Han S, Joung J, Belanto JJ, Verdine V, Cox DBT, Kellner MJ, Regev A et al (2017) RNA targeting with CRISPR‐Cas13a. Nature 550: 280–284 - PMC - PubMed
    1. Adamson B, Norman TM, Jost M, Cho MY, Nuñez JK, Chen Y, Villalta JE, Gilbert LA, Horlbeck MA, Hein MY et al (2016) A multiplexed single‐cell CRISPR screening platform enables systematic dissection of the unfolded protein response. Cell 167: 1867–1882 - PMC - PubMed
    1. Almada P, Pereira PM, Culley S, Caillol G, Boroni‐Rueda F, Dix CL, Charras G, Baum B, Laine RF, Leterrier C et al (2019) Automating multimodal microscopy with NanoJ‐Fluidics. Nat Commun 10: 1223 - PMC - PubMed
    1. Alon S, Goodwin DR, Sinha A, Wassie AT, Chen F, Daugharthy ER, Bando Y, Kajita A, Xue AG, Marrett K et al (2021) Expansion sequencing: spatially precise in situ transcriptomics in intact biological systems. Science 371: eaax2656 - PMC - PubMed
    1. Anzalone AV, Randolph PB, Davis JR, Sousa AA, Koblan LW, Levy JM, Chen PJ, Wilson C, Newby GA, Raguram A et al (2019) Search‐and‐replace genome editing without double‐strand breaks or donor DNA. Nature 576: 149–157 - PMC - PubMed

Publication types