Intra-individual comparison of liver stiffness measurements by magnetic resonance elastography and two-dimensional shear-wave elastography in 888 patients
- PMID: 36366945
- PMCID: PMC9816707
- DOI: 10.14366/usg.22052
Intra-individual comparison of liver stiffness measurements by magnetic resonance elastography and two-dimensional shear-wave elastography in 888 patients
Abstract
Purpose: Quantitative elastography methods, such as ultrasound two-dimensional shear-wave elastography (2D-SWE) and magnetic resonance elastography (MRE), are used to diagnose liver fibrosis. The present study compared liver stiffness determined by 2D-SWE and MRE within individuals and analyzed the degree of agreement between the two techniques.
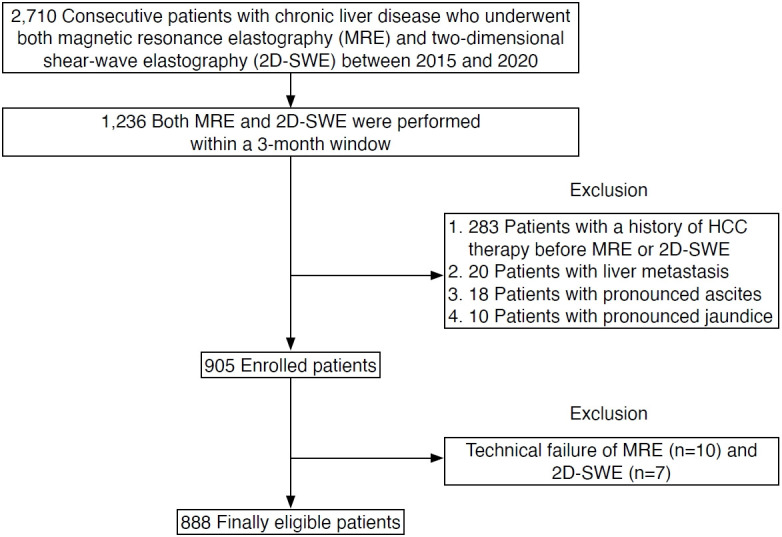
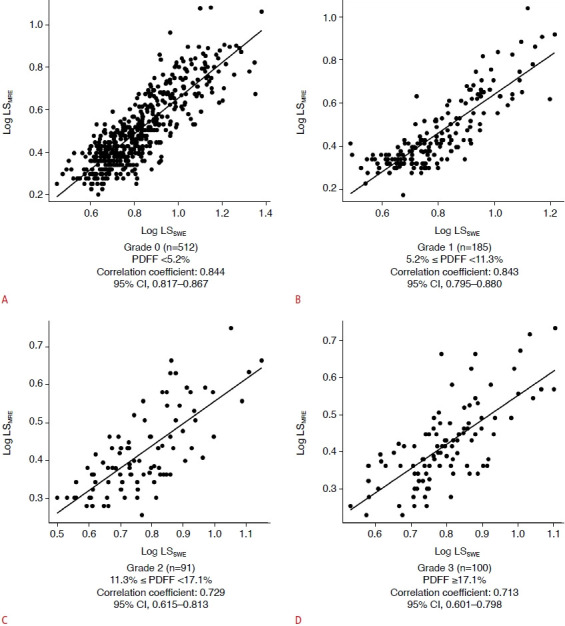
Methods: In total, 888 patients who underwent 2D-SWE and MRE were analyzed. Bland-Altman analysis was performed after both types of measurements were log-transformed to a normal distribution and converted to a common set of units using linear regression analysis for differing scales. The expected limit of agreement (LoA) was defined as the square root of the sum of the squares of 2D-SWE and MRE precision. The percentage difference was expressed as (2D-SWEMRE)/ mean of the two methods×100.
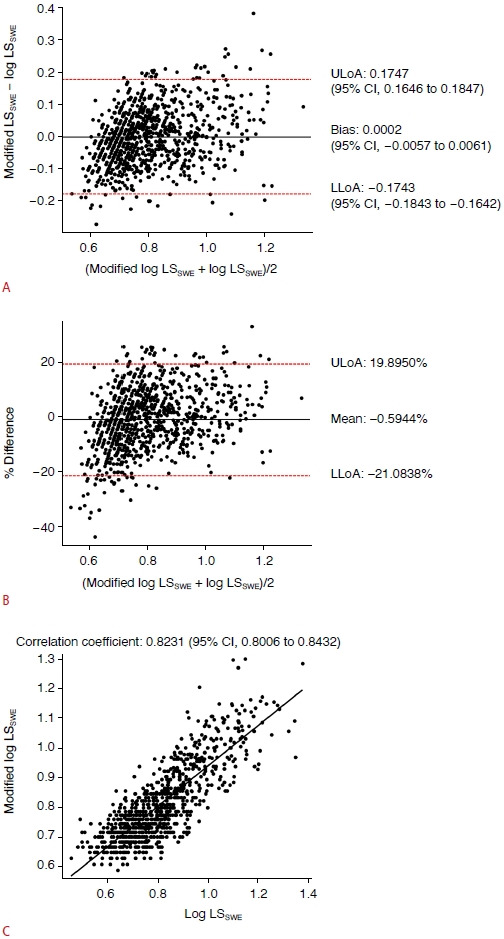
Results: A Bland-Altman plot showed that the bias and upper and lower LoAs (ULoA and LLoA) were 0.0002 (95% confidence interval [CI], -0.0057 to 0.0061), 0.1747 (95% CI, 0.1646 to 0.1847), and -0.1743 (95% CI, -0.1843 to -0.1642), respectively. In terms of percentage difference, the mean, ULoA, and LLoA were -0.5944%, 19.8950%, and -21.0838%, respectively. The calculated expected LoA was 17.1178% (95% CI, 16.6353% to 17.6002%), and 789 of 888 patients (88.9%) had a percentage difference within the expected LoA. The intraclass correlation coefficient of the two methods indicated an almost perfect correlation (0.8231; 95% CI, 0.8006 to 0.8432; P<0.001).
Conclusion: Bland-Altman analysis demonstrated that 2D-SWE and MRE were interchangeable within a clinically acceptable range.
Keywords: Bland-Altman analysis; Intraclass correlation coefficient; Magnetic resonance elastography; Proton density fat fraction; Two-dimensional shear-wave elastography.
Conflict of interest statement
No potential conflict of interest relevant to this article was reported.
Figures
References
-
- Bosch FX, Ribes J, Cleries R, Diaz M. Epidemiology of hepatocellular carcinoma. Clin Liver Dis. 2005;9:191–211. - PubMed
-
- Bravo AA, Sheth SG, Chopra S. Liver biopsy. N Engl J Med. 2001;344:495–500. - PubMed
-
- Poynard T, Lenaour G, Vaillant JC, Capron F, Munteanu M, Eyraud D, et al. Liver biopsy analysis has a low level of performance for diagnosis of intermediate stages of fibrosis. Clin Gastroenterol Hepatol. 2012;10:657–663. - PubMed
-
- Yoon JH, Lee JM, Joo I, Lee ES, Sohn JY, Jang SK, et al. Hepatic fibrosis: prospective comparison of MR elastography and US shearwave elastography for evaluation. Radiology. 2014;273:772–782. - PubMed
LinkOut - more resources
Full Text Sources