. 2022 Dec 1;95(1140):20220230.
doi: 10.1259/bjr.20220230. Epub 2022 Nov 15.

Magnetic resonance radiomic feature performance in pulmonary nodule classification and impact of segmentation variability on radiomics

Affiliations

Magnetic resonance radiomic feature performance in pulmonary nodule classification and impact of segmentation variability on radiomics

Chi Wan Koo et al. Br J Radiol. .

Abstract

Objective: Investigate the performance of multiparametric MRI radiomic features, alone or combined with current standard-of-care methods, for pulmonary nodule classification. Assess the impact of segmentation variability on feature reproducibility and reliability.

Methods: Radiomic features were extracted from 74 pulmonary nodules of 68 patients who underwent nodule resection or biopsy after MRI exam. The MRI features were compared with histopathology and conventional quantitative imaging values (maximum standardized uptake value [SUVmax] and mean Hounsfield unit [HU]) to determine whether MRI radiomic features can differentiate types of nodules and associate with SUVmax and HU using Wilcoxon rank sum test and linear regression. Diagnostic performance of features and four machine learning (ML) models were evaluated with area under the receiver operating characteristic curve (AUC) and 95% confidence intervals (CIs). Concordance correlation coefficient (CCC) assessed the segmentation variation impact on feature reproducibility and reliability.

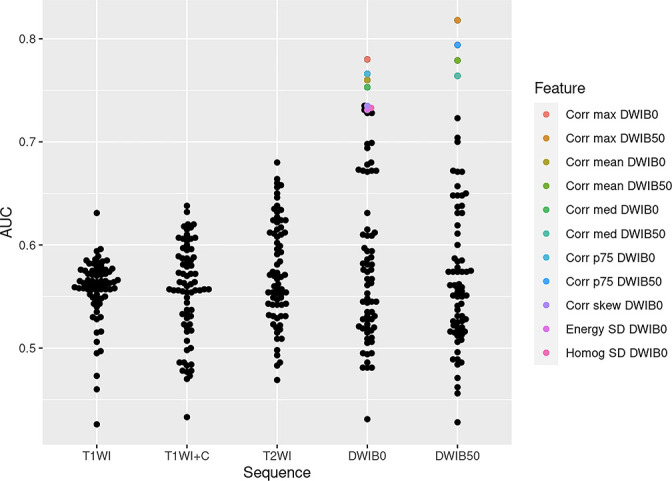
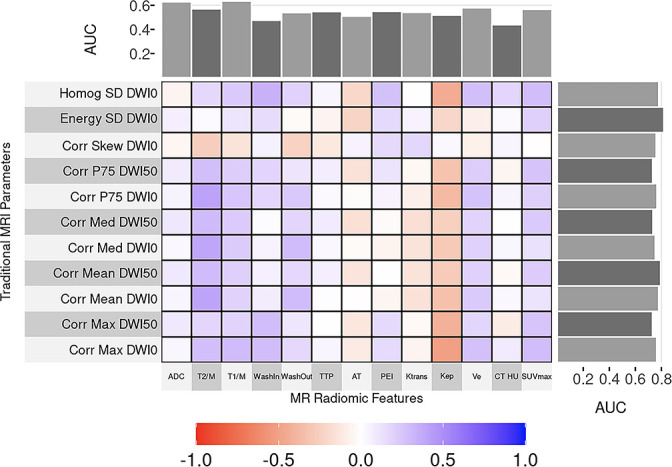
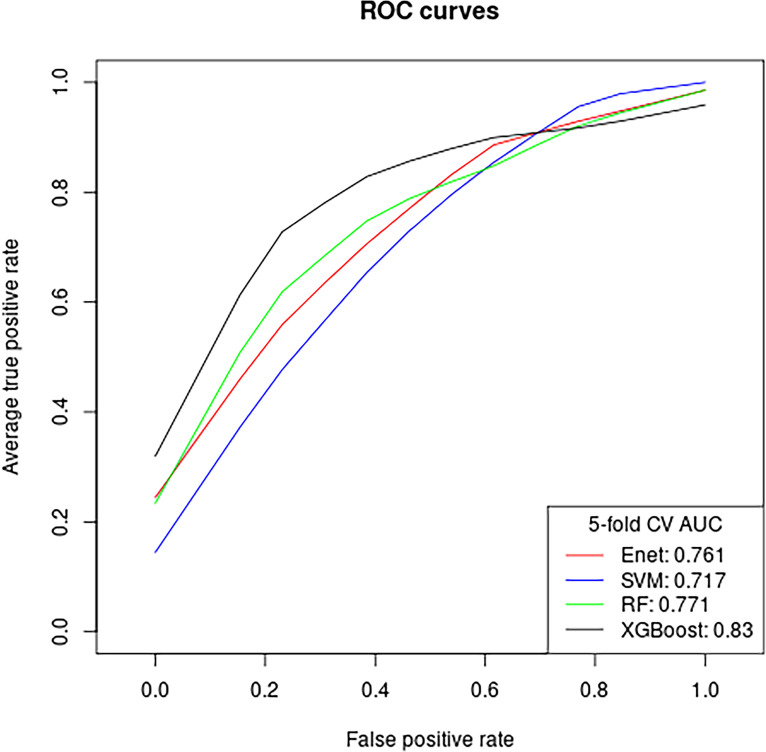
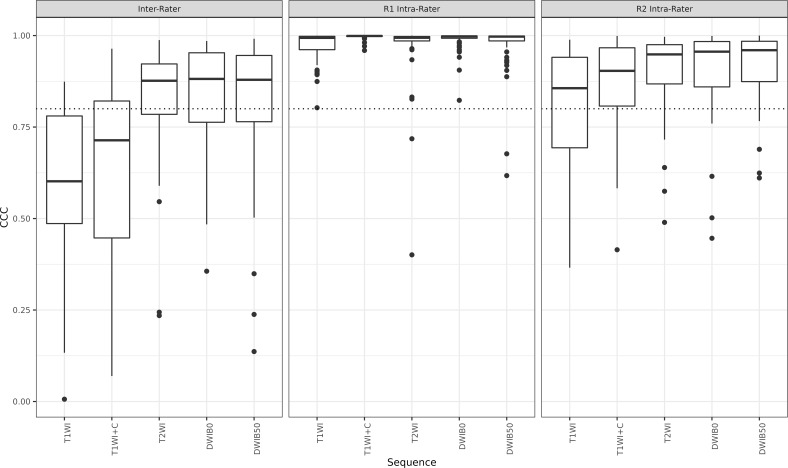
Results: Elevn diffusion-weighted features distinguished malignant from benign nodules (adjusted p < 0.05, AUC: 0.73-0.81). No features differentiated cancer types. Sixty-seven multiparametric features associated with mean CT HU and 14 correlated with SUVmax. All significant MRI features outperformed traditional imaging parameters (SUVmax, mean HU, apparent diffusion coefficient [ADC], T1, T2, dynamic contrast-enhanced imaging values) in distinguishing malignant from benign nodules with some achieving statistical significance (p < 0.05). Adding ADC and smoking history improved feature performance. Machine learning models demonstrated strong performance in nodule classification, with extreme gradient boosting (XGBoost) having the highest discrimination (AUC = 0.83, CI=[0.727, 0.932]). We found good to excellent inter- and intrareader feature reproducibility and reliability (CCC≥0.80).

Conclusion: Eleven MRI radiomic features differentiated malignant from benign lung nodules, outperforming traditional quantitative methods. MRI radiomic ML models demonstrated good nodule classification performances with XGBoost superior to three others. There was good to excellent inter- and intrareader feature reproducibility and reliability.

Advances in knowledge: Our study identified MRI radiomic features that successfully differentiated malignant from benign lung nodules and demonstrated high performance of our MR radiomic feature-based ML models for nodule classification. These new findings could help further establish thoracic MRI as a non-invasive and radiation-free alternative to standard practice for pulmonary nodule assessment.


Figures

Figure 1.
Figure 1.
A part-solid right upper lobe pathologically proven invasive adenocarcinoma outlined on computed tomography (a) was negative on positron emission tomography (b) but was correctly identified as malignant by magnetic resonance imaging (MRI) radiomics (true positive). The lesion demonstrated enhancement on post-contrast MRI (c) and hyperintensity on diffusion-weighted MRI (d). Sample of 3D-segmentation, which encompassed the entire volume of the nodule (e). Gray-level co-occurrence matrix maximum correlation texture map overlaid on the same malignant nodule (f).
Figure 2.
Figure 2.
Summary of MR radiomic feature evaluation for pulmonary nodule classification. (I) Image acquisition and lesion segmentation; (II) extraction of first- and second-order quantitative radiomic features; (III) MR feature-based machine learning model development, performance evaluation of radiomic features alone or in combination with clinical and/or traditional imaging data and machine learning models; (IV) significant MR radiomic feature identification, performance of features and machine learning classifier models. Enet = elastic net; RF = random forest; SVM = support vector machine; XGBoost = extreme gradient boosting.
Figure 3.
Figure 3.
Performance of individual radiomic features for differentiating malignant from benign pulmonary nodules. Each dot in this beeswarm plot represents an individual AUC value for each radiomic feature stratified by MRI sequence. The significant features (adjusted p < 0.05) are highlighted in color while features not statistically significant are in black. Note the AUC of the significant features are higher than those for the non-significant features. AUC = area under the receiver operating characteristic curve; Corr max DWIB0 = Correlation maximum DWI B0; Corr max DWIB50 = Correlation maximum DWI B50; Corr mean DWIB0 = Correlation mean DWI B0; Corr mean DWIB50 = Correlation mean DWI B50; Corr med DWIB0 = Correlation median DWI B0; Corr med DWIB50 = Correlation median DWI B50; Corr p75 DWIB0 = Correlation 75th percentile DWI B0; Corr p75 DWIB50 = Correlation 75th percentile DWI B50; Corr skew DWIB0 = Correlation skew DWIB0; Energy SD DWIB0 = Energy SD DWI B0; Homog SD DWIB0 = Homogeneity SD DWI B0; T1WI = T1-weighted image; T1WI + C=enhanced T1-weighted image; T2WI = T2-weighted image; DWI = diffusion-weighted image
Figure 4.
Figure 4.
Correlation and comparison of MR radiomic features and traditional quantitative imaging parameters performance. The heat map displays correlations between radiomic and traditional imaging parameters where the closer one is to purple, the better the correlation. The AUC values are included as marginal plots, with the traditional quantitative imaging parameter AUC on the top and the MR radiomic AUC on the side-of the map. Note that all MR radiomic AUC are higher than those for traditional quantitative parameters. AUC = area under the receiver operating characteristic curve; Homog SD DWI0 = Homogeneity SD DWI B0; Energy SD DWI0 = Energy SD DWI B0; Corr skew DWI0 = Correlation skew DWIB0; Corr p75 DWI50 = Correlation 75th percentile DWI B50; Corr p75 DWI0 = Correlation 75th percentile DWI B0; Corr med DWI50 = Correlation median DWI B50; Corr med DWI0 = Correlation median DWI B0; Corr mean DWI50 = Correlation mean DWI B50; Corr mean DWI0 = Correlation mean DWI B0; Corr max DWI50 = Correlation maximum DWI B50; Corr max DWI0 = Correlation maximum DWI B0; ADC = apparent diffusion coefficient; T2M = nodule to muscle signal intensity ratios in T2-weighted images; T1M = nodule to muscle signal intensity ratios in T1-weighted images; Washin = dynamic contrast wash-in; Washout = dynamic contrast washout; TTP = time to peak; AT = arrival times; PEI = peak enhancement intensity; HU = mean Hounsfield unit; SUVmax = maximum standardized uptake value
Figure 5.
Figure 5.
Diagnostic performance of machine learning models for classifying malignant and benign pulmonary nodules based on MR radiomic features. The number adjacent to each machine learning model is the area under the receiver operating characteristic curve. Enet = elastic net; SVM = support vector machine; RF = random forest; XGBoost = extreme gradient boosting.
Figure 6.
Figure 6.
Radiomic feature importance with and without addition of clinical and traditional imaging data. Mean feature importance was plotted across folds on relative scales for radiomic features (a), non-radiomic features (clinical and traditional imaging data) (b), combined radiomic and non-radiomic features (c). Note that in the combined radiomics and non-radiomics model, neither clinical data nor any of the traditional quantitative imaging parameters was listed as a top importance feature except for contrast wash-in. Wash in = dynamic contrast wash-in; HU = mean Hounsfield unit; ADC = apparent diffusion coefficient; T1/M = nodule to muscle signal intensity ratios in T1-weighted images; SUVmax = maximum standardized uptake value; T2/M = nodule to muscle signal intensity ratios in T2-weighted images; TTP = time-to-peak; AT = arrival times; Wash-out = dynamic contrast wash-out; Corr Max DWI0 = Correlation maximum DWI B0; Homog Kurtosis T1WI + C=Homogeneity kurtosis T1WI + C; Homog SD DWIB0 = Homogeneity SD DWI B0; Corr p75 DWI0 = Correlation 75th percentile DWI B0; Corr Kurtosis DWIB0 = Correlation kurtosis DWI B0; Corr Max DWI50 = Correlation maximum DWI B50; Homog Min T2WI = Homogeneity minimum T2WI.
Figure 7.
Figure 7.
Boxplot of MR radiomic feature reproducibility and reliability from inter- and intrareader segmentation variation. While Reader 1 (R1) achieved near perfect intrarater concordance with the majority of feature correlation coefficients well above the 0.8 threshold (dotted line), reader 2 (R2) demonstrated less intrarater consistency. Similarly, the interrater correlation was less than excellent. T1WI = T1 weighted image; T1WI + C=enhanced T1-weighted image; T2WI = T2-weighted image; DWI = diffusion-weighted image.

Similar articles

Cited by

References

    1. Common Cancer Types NIH . National Cancer Institutie . Available from : https://www.cancer.gov/types/common-cancers
    1. Gould MK, Tang T, Liu I-LA, Lee J, Zheng C, Danforth KN, et al. . Recent trends in the identification of incidental pulmonary nodules . Am J Respir Crit Care Med 2015. ; 192 : 1208 – 14 . doi: 10.1164/rccm.201505-0990OC - DOI - PubMed
    1. Kawakami S, Sone S, Takashima S, Li F, Yang ZG, Maruyama Y, et al. . Atypical adenomatous hyperplasia of the lung: correlation between high-resolution CT findings and histopathologic features . Eur Radiol 2001. ; 11 : 811 – 14 . doi: 10.1007/s003300000790 - DOI - PubMed
    1. Yang PS, Lee KS, Han J, Kim EA, Kim TS, Choo IW . Focal organizing pneumonia: CT and pathologic findings . J Korean Med Sci 2001. ; 16 : 573 – 78 . doi: 10.3346/jkms.2001.16.5.573 - DOI - PMC - PubMed
    1. Kim HY, Shim YM, Lee KS, Han J, Yi CA, Kim YK . Persistent pulmonary nodular ground-glass opacity at thin-section CT: histopathologic comparisons . Radiology 2007. ; 245 : 267 – 75 . doi: 10.1148/radiol.2451061682 - DOI - PubMed

MeSH terms