. 2022 Nov 22;22(23):4735-4745.
doi: 10.1039/d2lc00909a.

Rapid parallel generation of a fluorescently barcoded drop library from a microtiter plate using the plate-interfacing parallel encapsulation (PIPE) chip

Affiliations

Rapid parallel generation of a fluorescently barcoded drop library from a microtiter plate using the plate-interfacing parallel encapsulation (PIPE) chip

Geoffrey K Zath et al. Lab Chip. .

Abstract

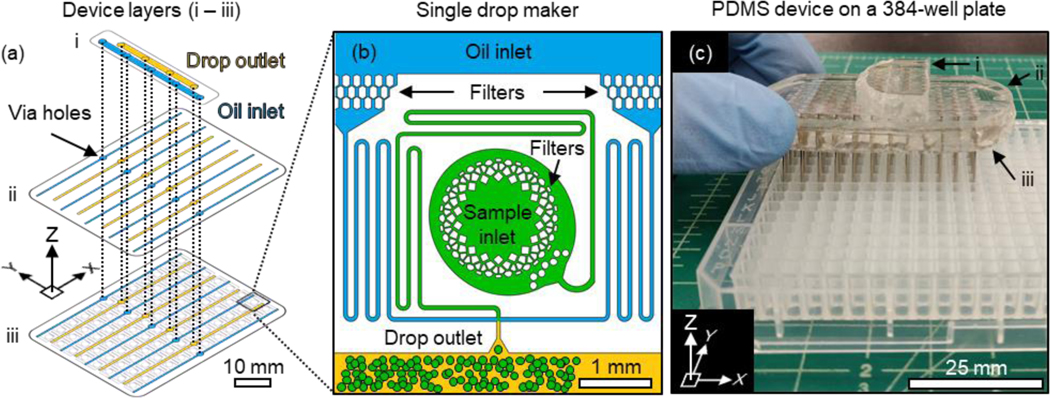
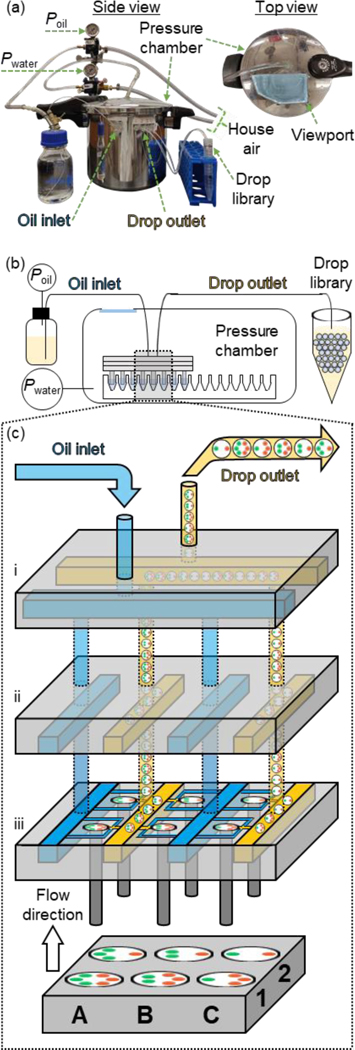
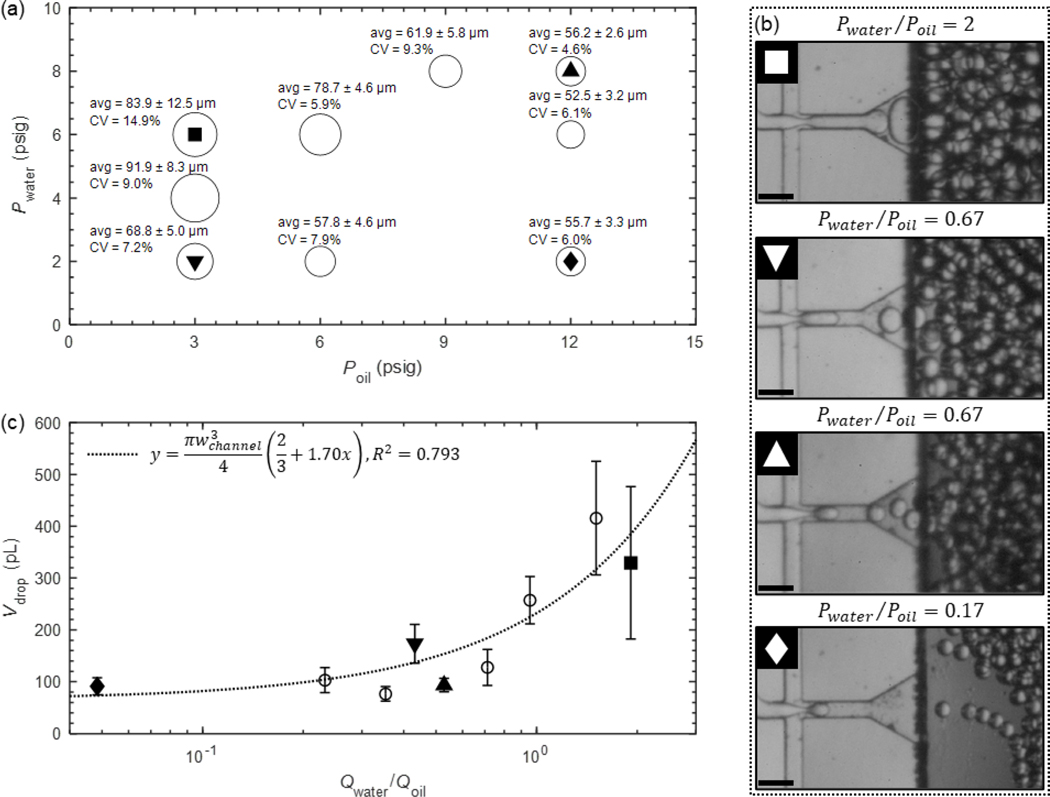
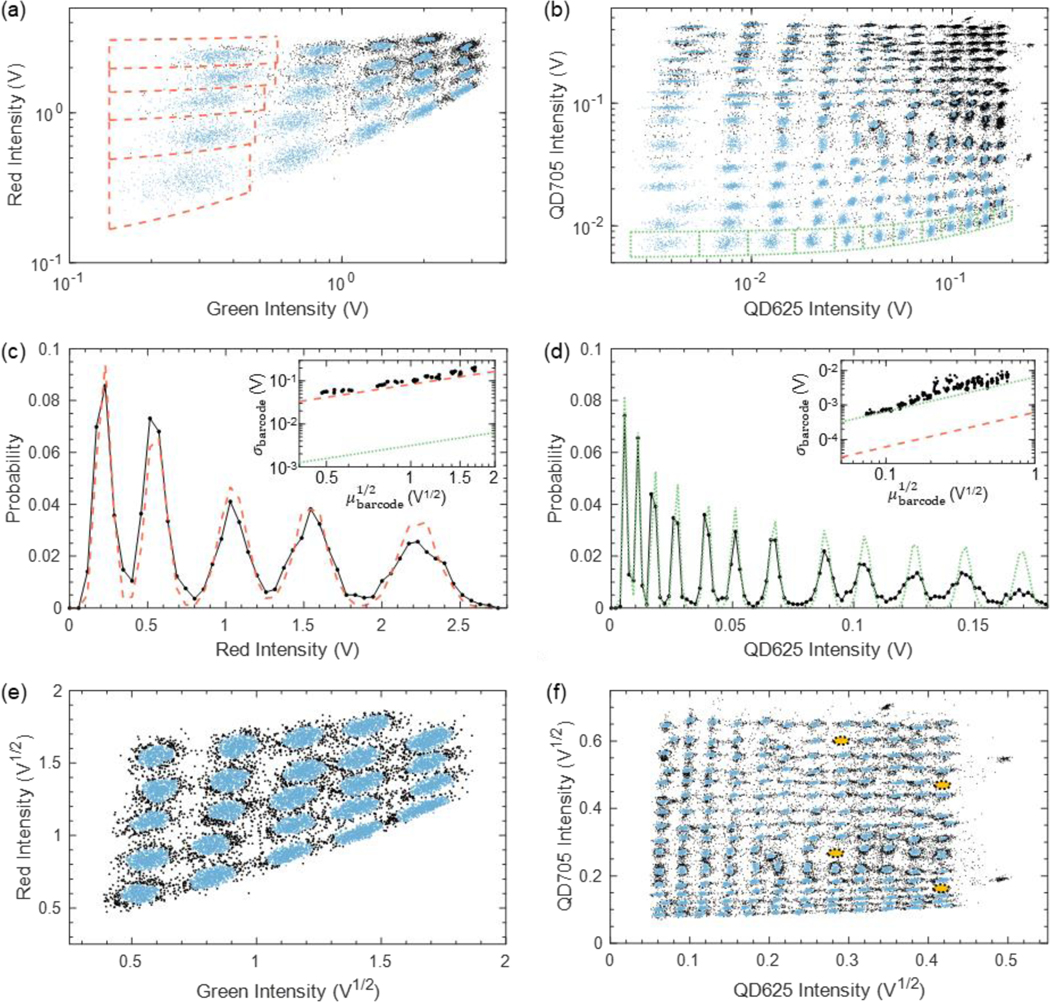
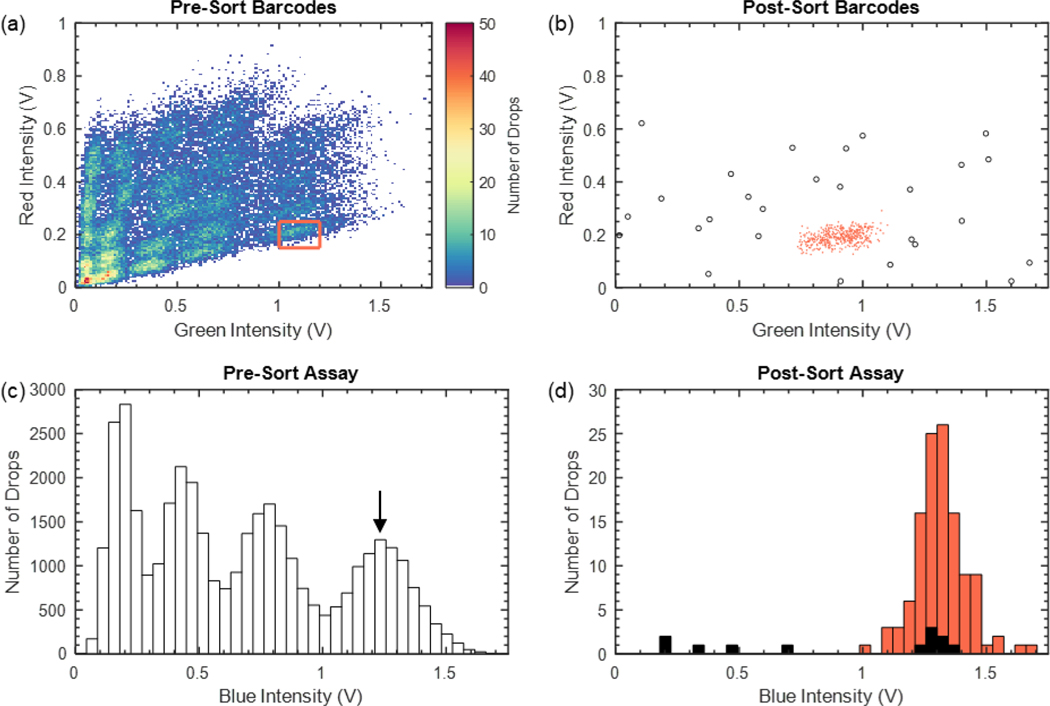
In drop-based microfluidics, an aqueous sample is partitioned into drops using individual pump sources that drive water and oil into a drop-making device. Parallelization of drop-making devices is necessary to achieve high-throughput screening of multiple experimental conditions, especially in time-sensitive studies. Here, we present the plate-interfacing parallel encapsulation (PIPE) chip, a microfluidic chip designed to generate 50 to 90 μm diameter drops of up to 96 different conditions in parallel by interfacing individual drop makers with a standard 384-well microtiter plate. The PIPE chip is used to generate two types of optically barcoded drop libraries consisting of two-color fluorescent particle combinations: a library of 24 microbead barcodes and a library of 192 quantum dot barcodes. Barcoded combinations in the drop libraries are rapidly measured within a microfluidic device using fluorescence detection and distinct barcoded populations in the fluorescence drop data are identified using DBSCAN data clustering. Signal analysis reveals that particle size defines the source of dominant noise present in the fluorescence intensity distributions of the barcoded drop populations, arising from Poisson loading for microbeads and shot noise for quantum dots. A barcoded population from a drop library is isolated using fluorescence-activated drop sorting, enabling downstream analysis of drop contents. The PIPE chip can improve multiplexed high-throughput assays by enabling simultaneous encapsulation of barcoded samples stored in a microtiter plate and reducing sample preparation time.


Conflict of interest statement

Conflicts of Interest

There are no conflicts to declare.

Figures

Fig. 1
Fig. 1
PIPE chip design and assembly. (a) The PIPE chip was assembled from three layers: (i) a top layer containing oil distribution (blue) and drop collection (yellow) channels connected to a single inlet and outlet, respectively; (ii) a middle layer which reduces fluidic resistance by providing additional height to the oil and drop collection distribution channels on the bottom layer; and (iii) a bottom layer which contains an array of 96 drop makers (eight rows of twelve drop makers) with channels for oil distribution (five rows, blue) and drop collection (four rows, yellow). (b) Detailed view of one of the 96 drop makers positioned on the bottom layer. Colors are used to distinguish oil inlet (blue), aqueous sample inlet (green), and drop outlet (yellow) channels. (c) Image of a completed device interfaced with ¼ of a 384-well plate. Each layer (i – iii) of the fully assembled device from part (a) is indicated using black arrows. Stainless steel sample inlet capillary tubes are visible extending into the microtiter plate wells below.
Fig. 2
Fig. 2
PIPE chip operation and barcoded drop library production. (a) Side view and top view profiles of the PIPE chip apparatus and components. (b) PIPE chip operation schematic for the encapsulation of 96 wells from a 384-well microtiter plate. Pressure Poil is applied to an external oil reservoir to provide oil to the device within the pressure chamber while a second pressure Pwater applied to the chamber pushes fluid from sample wells into the microfluidic device. Barcoded drops travel through tubing past a sealed opening in the wall of the chamber for collection in a drop library. (c) Detailed schematic of the internal channels and flows within the PIPE chip. Samples in wells (indexed A – C and 1 – 2) barcoded with different concentrations of green and red microbeads are encapsulated in layer (iii), collected in large drop channels (yellow) formed from both layers (ii) and (iii) where they are transported to perpendicular drop collection channels in layer (i). The barcoded drops flow out of the device in a shared drop outlet.
Fig. 3
Fig. 3
Characterization of drop sizes produced by the PIPE chip. (a) Drop diameter average, standard deviation, and CV at various water pressures Pwater and oil pressures Poil. For additional visualization, the relative size of each open circle corresponds to the relative mean drop diameter measured. Solid shapes indicate conditions used for high-speed image capture in (b). (b) High-speed image capture of drop formation, ordered by descending Ddrop, for high water pressure (■, Pwater = 6 psig and Poil = 3 psig, Pwater/Poil = 2), low combined pressure (▼, Pwater = 2 psig and Poil = 3 psig, Pwater/Poil = 0.67), high combined pressure (▲, Pwater = 8 and Poil = 12 psig, Pwater/Poil = 0.67), and high oil pressure (♦, Pwater = 2 psig and Poil = 12 psig, Pwater/Poil = 0.17) conditions. Scale bars = 100 μm. (c) Corresponding drop volumes Vdrop versus the volumetric flowrate ratio Qwater/Qoil (open circles or solid shapes). Vdrop scales with Qwater/Qoil following a drop scaling law (dotted black line). Error bars represent one standard deviation from the mean.
Fig. 4
Fig. 4
Analysis of microbead and QD barcoded drop libraries. Scatter plots of (a) microbead and (b) QD fluorescence intensity in the drop library. Clusters identified by DBSCAN are indicated in blue while noise is in black. Probability distributions of (c) five red microbead barcoded drop populations (black dots) plotted against the particle loading noise estimate (dashed red line, R2 = 0.931) and (d) twelve QD625 barcoded drop populations (black dots) plotted against the shot noise estimate (dotted green line, R2 = 0.852). Solid black lines guide the eye for the measured microbead and QD625 data. Inset (c-d): standard deviations of each barcode σbarcode (black dots) plotted against μbarcode1/2 with estimates for σparticle (dashed red line) and σshot (dotted green line). Scatter plots of (e) microbead and (f) QD drop library data scaled by V1/2. Clusters identified by DBSCAN are indicated in blue while noise is in black. Missing clusters in (f) are due to two clogged channels in the PIPE chip and are indicated by dotted yellow ovals.
Fig. 5
Fig. 5
Fluorescence-activated drop sorting of a microbead-barcoded drop library. (a) Fluorescence intensity of barcoded drops before sorting. The sorted region is indicated by the red box. (b) Fluorescence intensity of barcoded drops after sorting. DBSCAN is used to separate the outlier data points (open black circles) from the target barcode population (red dots). (c) Distribution of four concentrations of blue microbead drops within the drop library. (d) Distribution of blue microbeads in the sorted barcoded drop population shows a single peak corresponding to the largest concentration of blue microbeads. DBSCAN is used to separate the outliers (black bars) from the target sorted population (red bars).

Similar articles

Cited by

References

    1. Agresti JJ, Antipov E, Abate AR, Ahn K, Rowat AC, Baret J-C, Marquez M, Klibanov AM, Griffiths AD and Weitz DA, Proceedings of the National Academy of Sciences, 2010, 107, 4004–4009. - PMC - PubMed
    1. Guo MT, Rotem A, Heyman JA and Weitz DA, Lab on a Chip, 2012, 12, 2146–2155. - PubMed
    1. Kulesa A, Kehe J, Hurtado JE, Tawde P and Blainey PC, Proceedings of the National Academy of Sciences, 2018, 115, 6685–6690. - PMC - PubMed
    1. Ackerman CM, Myhrvold C, Thakku SG, Freije CA, Metsky HC, Yang DK, Simon HY, Boehm CK, Kosoko-Thoroddsen T-SF and Kehe JJN, Nature, 2020, 1–6. - PMC - PubMed
    1. Scheler O, Makuch K, Debski PR, Horka M, Ruszczak A, Pacocha N, Sozański K, Smolander O-P, Postek W and Garstecki P. J. S. r., Scientific Reports (Nature Publisher Group), 2020, 10, 1–8. - PMC - PubMed

Publication types

MeSH terms