Metabolomic analysis and pharmacological validation of the cerebral protective effect of 3,4‑dihydroxybenzaldehyde on cerebral ischemia‑reperfusion injury
- PMID: 36367170
- PMCID: PMC9685269
- DOI: 10.3892/mmr.2022.12896
Metabolomic analysis and pharmacological validation of the cerebral protective effect of 3,4‑dihydroxybenzaldehyde on cerebral ischemia‑reperfusion injury
Abstract
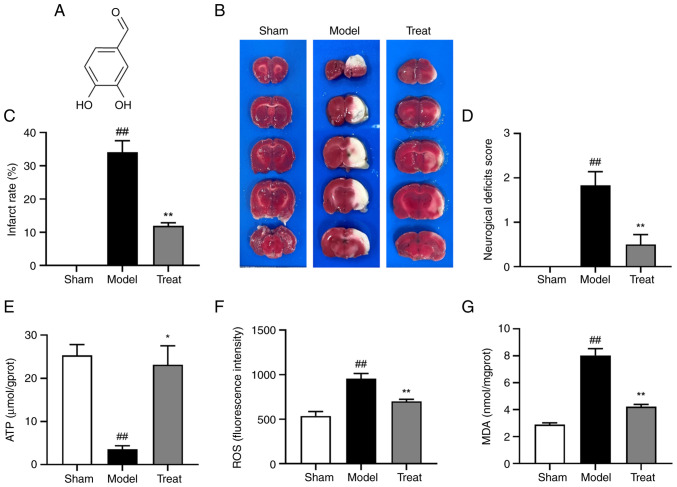
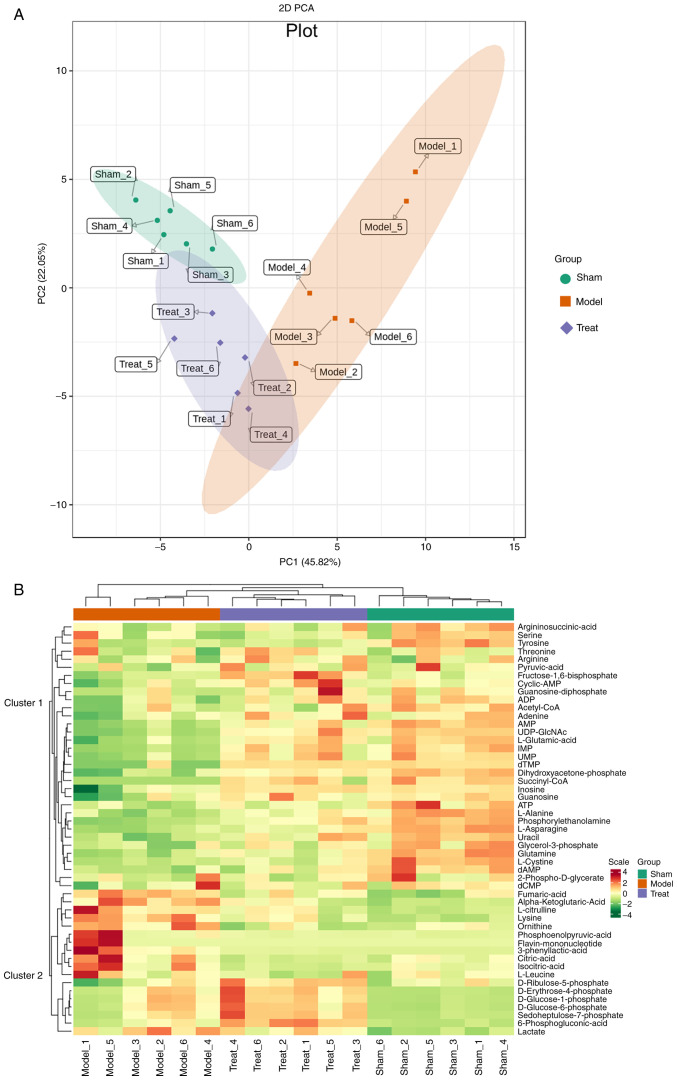
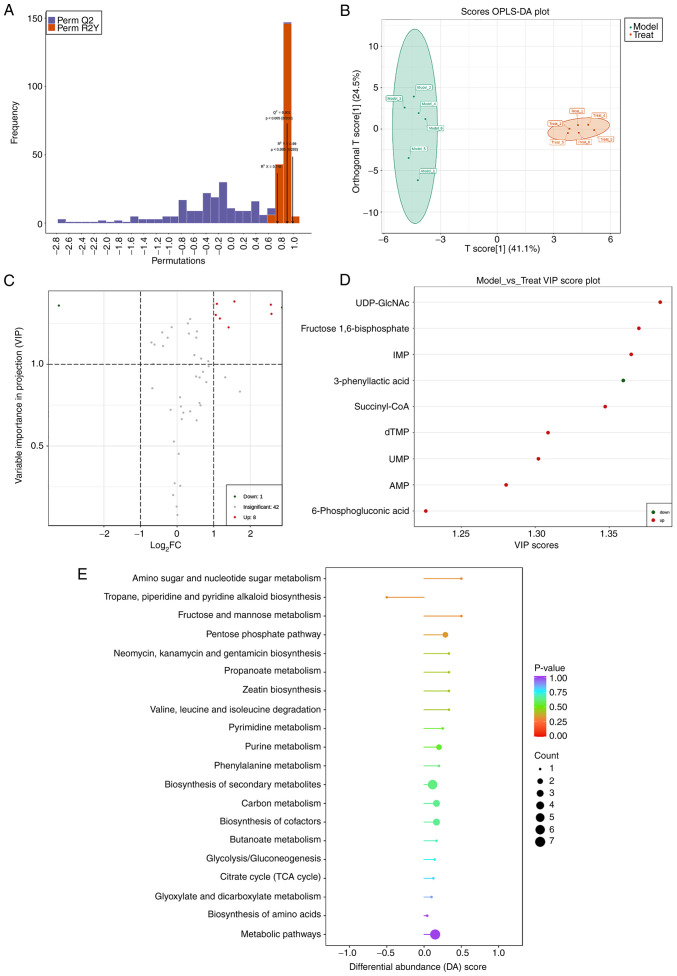
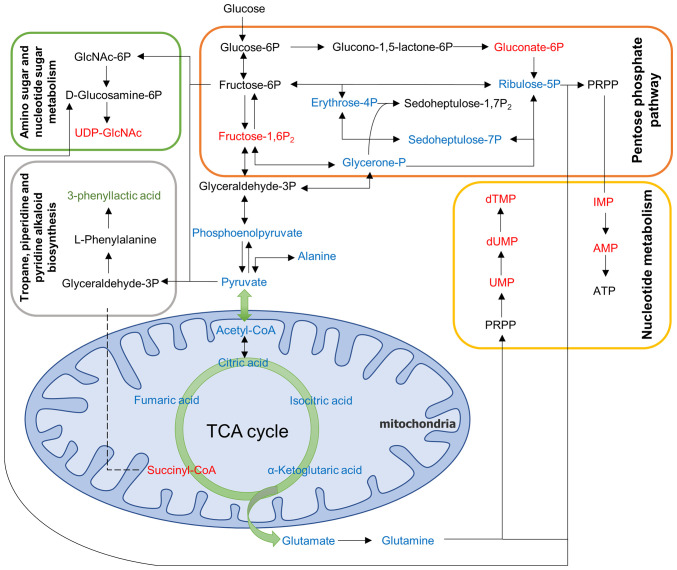
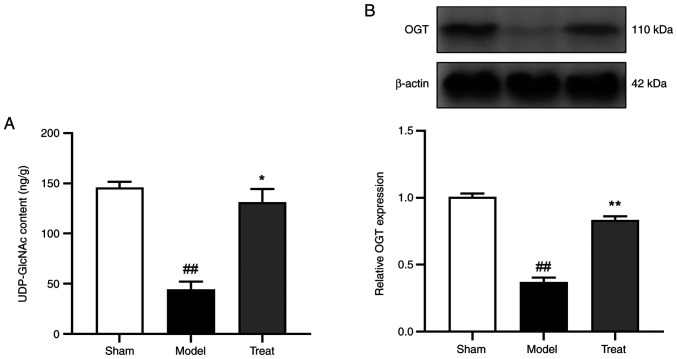
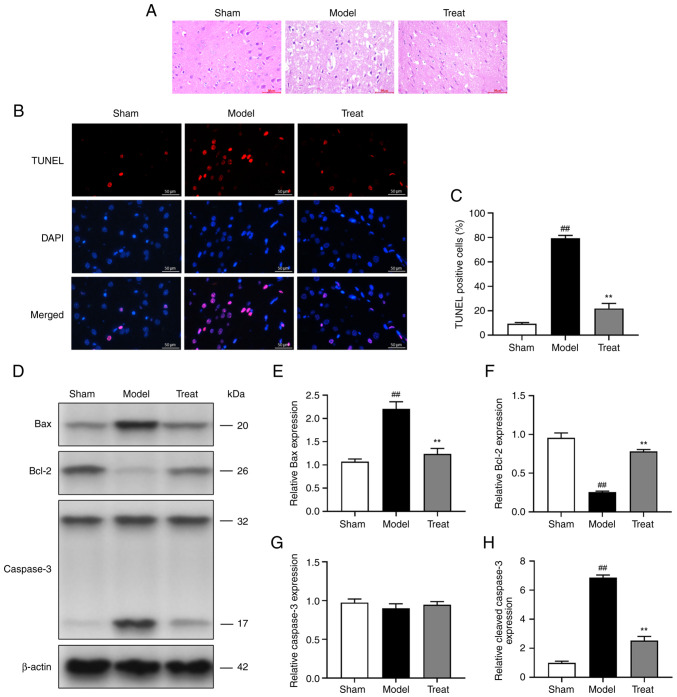
3,4‑Dihydroxybenzaldehyde (DBD), one of the active components of Gastrodia elata, has a cerebral protective effect and can effectively combat cerebral ischemia/reperfusion (I/R) injury in rats. However, the metabolite profiles and underlying mechanisms associated with DBD remain unclear. To explore the level of energy metabolism and pharmacological targets in brain tissue following DBD treatment of stroke. The right middle cerebral artery of the rats was occluded for 2 h and reperfused for 24 h to simulate brain I/R injury. Pharmacological results showed that DBD reduced cerebral infarct volume, improved neurological function and increased adenosine triphosphate (ATP) content. Mitochondria are the primary sites for ATP generation and cellular energy supply and decreasing mitochondrial dysfunction can alleviate the energy expenditure of ischemic stroke. Through further experiments, it was found that mitochondrial damage was recovered following DBD treatment, which was manifested by the improvement of mitochondrial morphology under an electron microscope and the reduction of oxidative stress damage. The metabolomics of middle cerebral artery occlusion/reperfusion (MCAO/R) rat brain tissue was studied by the liquid chromatography‑tandem mass spectrometry metabolomics method. Significantly different metabolites were screened and the pathways involved included amino sugar and nucleotide sugar metabolism and pentose phosphate pathway. Finally, the present study performed targeted metabolic profiling and validated potential therapeutic targets. Uridine diphosphate N‑acetylglucosamine (UDP‑GlcNAc) levels were decreased in the MCAO/R group but significantly increased in the DBD group. TdT‑mediated dUTP nick end labeling (TUNEL) staining, hematoxylin and eosin staining and western blotting showed that brain cell apoptosis was inhibited and neuronal morphology improved. Among them, the regulatory enzyme O‑GlcNAc transferase (OGT) of UDP‑GlcNAc appeared to be significantly increased and neuronal apoptosis was inhibited following DBD treatment, which was verified by western blotting. Therefore, by analyzing mitochondrial dysfunction following I/R and the characterization of potential markers in mitochondrial energy metabolism, it was shown that OGT could inhibit neuronal apoptosis as a potential therapeutic target for brain I/R injury.
Keywords: 3; 4‑dihydroxybenzaldehyde; O‑GlcNAc transferase; ischemic stroke; metabolomics; mitochondrial dysfunction; uridine diphosphate N‑acetylglucosamine.
Conflict of interest statement
The authors declare that they have no competing interests.
Figures

Similar articles
-
Plasma metabonomic study on the effect of Para‑hydroxybenzaldehyde intervention in a rat model of transient focal cerebral ischemia.Mol Med Rep. 2023 Nov;28(5):224. doi: 10.3892/mmr.2023.13111. Epub 2023 Oct 6. Mol Med Rep. 2023. PMID: 37800608 Free PMC article.
-
P‑hydroxybenzyl alcohol ameliorates neuronal cerebral ischemia‑reperfusion injury by activating mitochondrial autophagy through SIRT1.Mol Med Rep. 2023 Mar;27(3):68. doi: 10.3892/mmr.2023.12955. Epub 2023 Feb 17. Mol Med Rep. 2023. PMID: 36799156 Free PMC article.
-
[Quality control mechanism of mitochondria by 3,4-dihydroxybenzaldehyde through OGT-PINK1 pathway].Zhongguo Zhong Yao Za Zhi. 2023 Jun;48(12):3308-3316. doi: 10.19540/j.cnki.cjcmm.20221212.401. Zhongguo Zhong Yao Za Zhi. 2023. PMID: 37382015 Chinese.
-
An Updated Review of Mitochondrial Transplantation as a Potential Therapeutic Strategy Against Cerebral Ischemia and Cerebral Ischemia/Reperfusion Injury.Mol Neurobiol. 2023 Apr;60(4):1865-1883. doi: 10.1007/s12035-022-03200-y. Epub 2023 Jan 3. Mol Neurobiol. 2023. PMID: 36595193 Review.
-
Emerging Treatment Strategies for Cerebral Ischemia-Reperfusion Injury.Neuroscience. 2022 Dec 15;507:112-124. doi: 10.1016/j.neuroscience.2022.10.020. Epub 2022 Oct 28. Neuroscience. 2022. PMID: 36341725 Review.
Cited by
-
Plasma metabonomic study on the effect of Para‑hydroxybenzaldehyde intervention in a rat model of transient focal cerebral ischemia.Mol Med Rep. 2023 Nov;28(5):224. doi: 10.3892/mmr.2023.13111. Epub 2023 Oct 6. Mol Med Rep. 2023. PMID: 37800608 Free PMC article.
-
O-GlcNAcylation: a pro-survival response to acute stress in the cardiovascular and central nervous systems.Eur J Med Res. 2024 Mar 16;29(1):174. doi: 10.1186/s40001-024-01773-z. Eur J Med Res. 2024. PMID: 38491477 Free PMC article. Review.
-
Ferrostatin-1 Reversed Chronic Intermittent Hypoxia-Induced Ferroptosis in Aortic Endothelial Cells via Reprogramming Mitochondrial Function.Nat Sci Sleep. 2024 Apr 23;16:401-411. doi: 10.2147/NSS.S442186. eCollection 2024. Nat Sci Sleep. 2024. PMID: 38680190 Free PMC article.
-
Metabolomic discoveries for early diagnosis and traditional Chinese medicine efficacy in ischemic stroke.Biomark Res. 2024 Jun 20;12(1):63. doi: 10.1186/s40364-024-00608-7. Biomark Res. 2024. PMID: 38902829 Free PMC article. Review.
-
Roles of O-GlcNAcylation in Mitochondrial Homeostasis and Cardiovascular Diseases.Antioxidants (Basel). 2024 May 6;13(5):571. doi: 10.3390/antiox13050571. Antioxidants (Basel). 2024. PMID: 38790676 Free PMC article. Review.
References
-
- Feigin VL, Roth GA, Naghavi M, Parmar P, Krishnamurthi R, Chugh S, Mensah GA, Norrving B, Shiue I, Ng M, et al. Global burden of stroke and risk factors in 188 countries, during 1990–2013: A systematic analysis for the global burden of disease Study 2013. Lancet Neurol. 2016;15:913–924. doi: 10.1016/S1474-4422(16)30073-4. - DOI - PubMed
MeSH terms
Substances
LinkOut - more resources
Full Text Sources
Miscellaneous