. 2023 Jan 9;24(1):e55197.
doi: 10.15252/embr.202255197. Epub 2022 Nov 11.

Retrotransposon insertions associated with risk of neurologic and psychiatric diseases

Affiliations

Retrotransposon insertions associated with risk of neurologic and psychiatric diseases

Hyo Won Ahn et al. EMBO Rep. .

Abstract

Transposable elements (TEs) are active in neuronal cells raising the question whether TE insertions contribute to risk of neuropsychiatric disease. While genome-wide association studies (GWAS) serve as a tool to discover genetic loci associated with neuropsychiatric diseases, unfortunately GWAS do not directly detect structural variants such as TEs. To examine the role of TEs in psychiatric and neurologic disease, we evaluated 17,000 polymorphic TEs and find 76 are in linkage disequilibrium with disease haplotypes (P < 10-6 ) defined by GWAS. From these 76 polymorphic TEs, we identify potentially causal candidates based on having insertions in genomic regions of regulatory chromatin and on having associations with altered gene expression in brain tissues. We show that lead candidate insertions have regulatory effects on gene expression in human neural stem cells altering the activity of a minimal promoter. Taken together, we identify 10 polymorphic TE insertions that are potential candidates on par with other variants for having a causal role in neurologic and psychiatric disorders.

Keywords: Alu; GWAS; neurologic disease; psychiatric disease; transposable elements.


Figures

Figure 1
Figure 1. Polymorphic transposable elements (TEs) in linkage disequilibrium (LD) with trait‐associated SNPs (TASs) of neurologic and psychiatric diseases
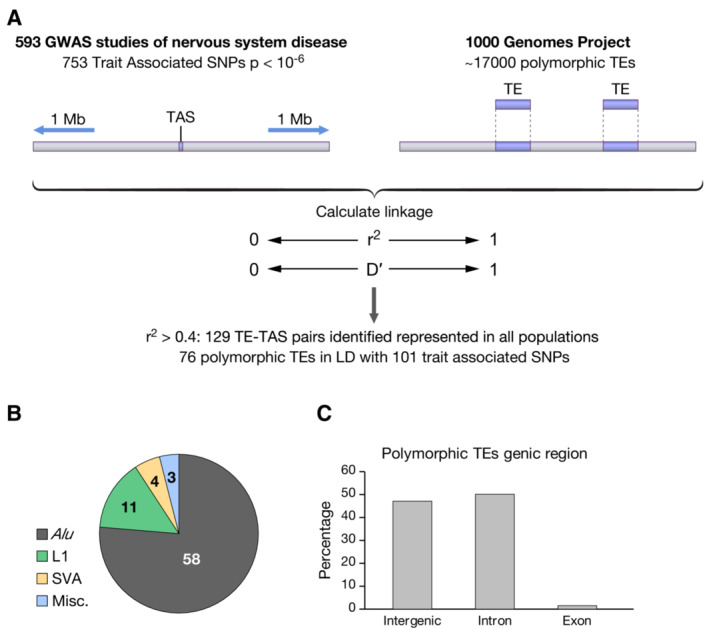
  1. Polymorphic TEs within 1 Mb of a TAS were evaluated for LD with the TAS.

  2. Classification of TEs in LD with TASs.

  3. Genic location of TEs in LD with TASs.

Figure 2
Figure 2. Genetic map and chromatin states of causal transposable element (TE) candidate locus number 1 (LN1)
The location of causal candidate LN1 is indicated as is the position of the linked trait‐associated SNP (TAS) rs2303565 associated with amyotrophic lateral sclerosis. The structures of transcripts indicate the exons (blue) and introns (gray with >). The color key indicates the chromatin states as defined by ChromHMM analysis of epigenomic data from the NIH Roadmap Epigenomics Consortium. Chromatin states are shown for brain tissues, neural progenitor cells (NPCs), and a variety of other tissues. See Appendix Fig S1A and Materials and Methods for specific tissues. Next to the color key, NCBI dbVar ID for TE, SNP ID for TAS, genic location of TAS, TE name, and r 2 value are shown. *r 2 value verified by genotyping PCR. ChIP‐seq peaks of transcription factors from ENCODE are shown below ChromHMM chromatin states.
Figure 3
Figure 3. Genetic map and chromatin states of causal transposable element (TE) candidate LN2
The location of causal candidate LN2 is indicated as is the position of the linked trait‐associated SNP (TAS) rs11759769 associated with migraine disorder. The structures of transcripts indicate the exons (blue) and introns (gray with >). L1MA5 indicates the position of an L1 element fixed in the genome. The color key indicates the chromatin states as defined by ChromHMM analysis of epigenomic data from the NIH Roadmap Epigenomics Consortium. Chromatin states are shown for brain tissues, neural progenitor cells, and a variety of other tissues. See Appendix Fig S2A and Materials and Methods for specific tissues. Next to the color key, NCBI dbVar ID for TE, SNP ID for TAS, genic location of TAS, TE name, and r 2 value are shown. *r 2 value verified by genotyping PCR. ChIP‐seq peaks of transcription factors from ENCODE are shown below ChromHMM chromatin states and peaks for two transcription factors known for heterochromatin formation located around the site of LN2 insertion are labeled.
Figure 4
Figure 4. Genetic map and chromatin states of causal transposable element (TE) candidate LN16
The location of causal candidate LN16 is indicated as is the position of the linked trait‐associated SNP (TAS) rs12185268 associated with Parkinson's disease. The structures of transcripts indicate the exons (blue) and introns (gray with >). The color key indicates the chromatin states as defined by ChromHMM analysis of epigenomic data from the NIH Roadmap Epigenomics Consortium. Chromatin states are shown for brain tissues, neural progenitor cells, and a variety of other tissues. See Appendix Fig S10A and Materials and Methods for specific tissues. Next to the color key, NCBI dbVar ID for TE, SNP ID for TAS, genic location of TAS, TE name, and r 2 value are shown. *r 2 value verified by genotyping PCR. ChIP‐seq peaks of transcription factors from ENCODE are shown below ChromHMM chromatin states. The position of the LN16 TE is enlarged in an inset. Source data are available online for this figure.
Figure 5
Figure 5. Transcription activity of causal transposable element (TE) candidates
Approximately 500 bp of genomic sequence, with and without Alu inserts was assayed for transcription activity when inserted upstream of a minimal promoter in a luciferase vector transfected into NCRM1 cells. The orientation (white triangle) of the Alu and its associated genomic sequence (yellow box) is diagramed at top. Forward orientation (Fwd) indicates plus strand sequence of the reference genome. The minimal promoter is symbolized by a black rectangle with an arrow indicating the direction of transcription. The causal TE candidates tested, their linked trait‐associated SNPs, and their ChromHMM status are indicated at right. Luciferase values are normalized to transfection efficiency (renilla) for each of four independent transfections and subsequently to luciferase expression from the minimal promoter alone. Mean values (± SD) were determined, and statistical significance was analyzed by Student's two‐sample unequal variance t‐test with a one‐tailed distribution. Each locus was examined in four independent experiments and a representative dataset is shown here. ☨: P < 0.05 in two experiments and P > 0.05 in two experiments. ns: P > 0.05. Source data are available online for this figure.
Figure 6
Figure 6. Models for how insertions of candidate causal transposable elements may alter expression of genes
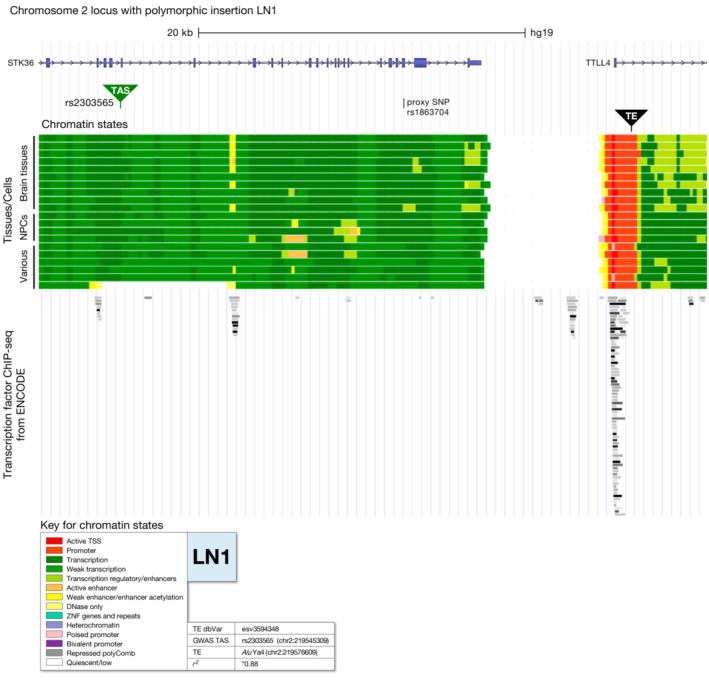
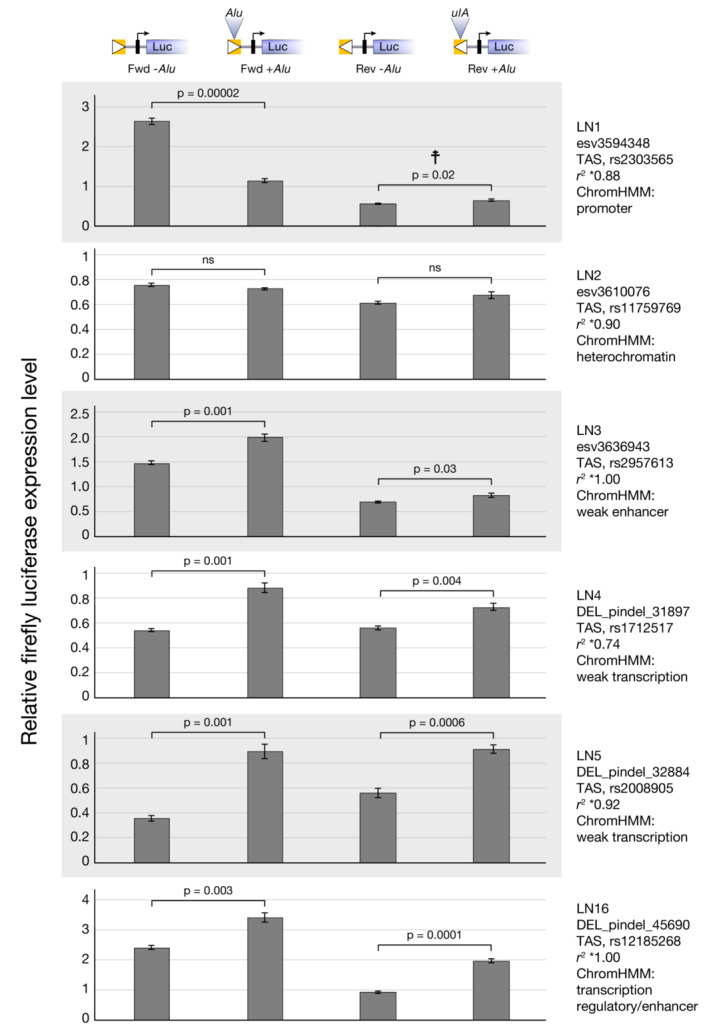
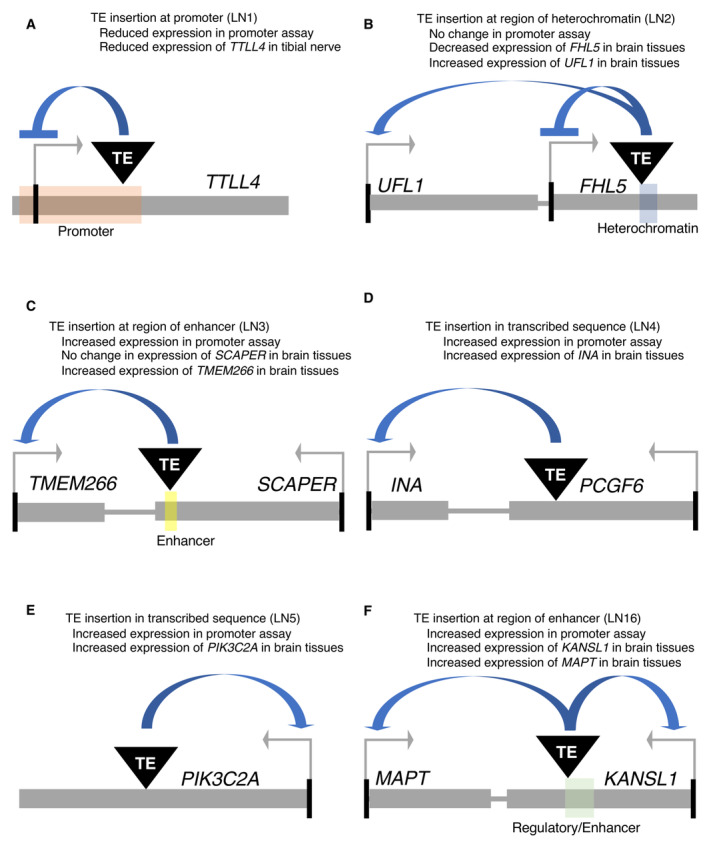
  1. Locus number 1 (LN1) is located in promoter chromatin of TTLL4 and may disrupt promoter function.

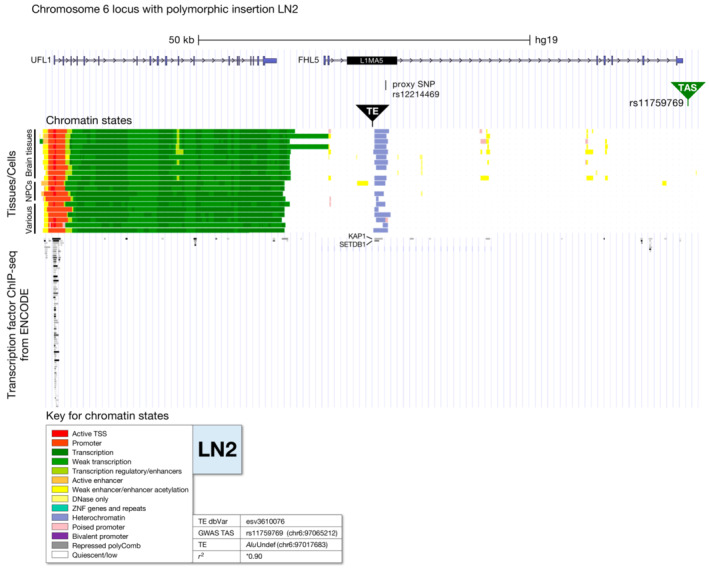
  2. LN2 is within an island of heterochromatin and may alter chromatin interactions to increase expression of UFL1 and reduce FHL5 expression.

  3. LN3 is positioned within enhancer chromatin and may increase expression of TMEM266 by contributing activator sequence.

  4. LN4 is located in transcribed sequence and may increase expression of INA by contributing activator sequence.

  5. LN5 is located in transcribed sequence and may increase expression of PIK3C2A by contributing activator sequence.

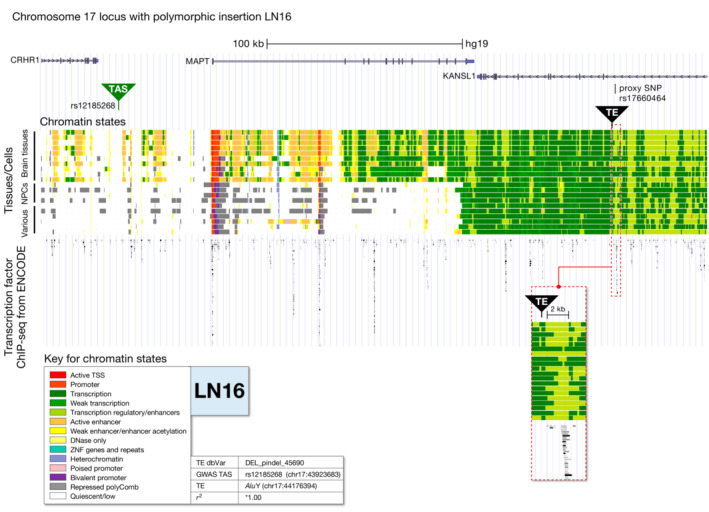
  6. LN16 is positioned in enhancer chromatin and may increase expression of MAPT and KANSL1 by contributing activator sequence.

Similar articles

Cited by

References

    1. 1000 Genomes Project Consortium , Auton A, Brooks LD, Durbin RM, Garrison EP, Kang HM, Korbel JO, Marchini JL, McCarthy S, McVean GA et al (2015) A global reference for human genetic variation. Nature 526: 68–74 - PMC - PubMed
    1. Ahmeti KB, Ajroud‐Driss S, Al‐Chalabi A, Andersen PM, Armstrong J, Birve A, Blauw HM, Brown RH, Bruijn L, Chen W et al (2013) Age of onset of amyotrophic lateral sclerosis is modulated by a locus on 1p34.1. Neurobiol Aging 34: 357 - PMC - PubMed
    1. Anttila V, Winsvold BS, Gormley P, Kurth T, Bettella F, McMahon G, Kallela M, Malik R, de Vries B, Terwindt G et al (2013) Genome‐wide meta‐analysis identifies new susceptibility loci for migraine. Nat Genet 45: 912–917 - PMC - PubMed
    1. Baillie JK, Barnett MW, Upton KR, Gerhardt DJ, Richmond TA, De Sapio F, Brennan PM, Rizzu P, Smith S, Fell M et al (2011) Somatic retrotransposition alters the genetic landscape of the human brain. Nature 479: 534–537 - PMC - PubMed
    1. Barrett JC, Fry B, Maller J, Daly MJ (2005) Haploview: analysis and visualization of LD and haplotype maps. Bioinformatics 21: 263–265 - PubMed

Publication types