. 2022 Nov 22;16(11):19551-19566.
doi: 10.1021/acsnano.2c10043. Epub 2022 Nov 11.

Rescuing Cardiac Cells and Improving Cardiac Function by Targeted Delivery of Oxygen-Releasing Nanoparticles after or Even before Acute Myocardial Infarction

Affiliations

Rescuing Cardiac Cells and Improving Cardiac Function by Targeted Delivery of Oxygen-Releasing Nanoparticles after or Even before Acute Myocardial Infarction

Ya Guan et al. ACS Nano. .

Abstract

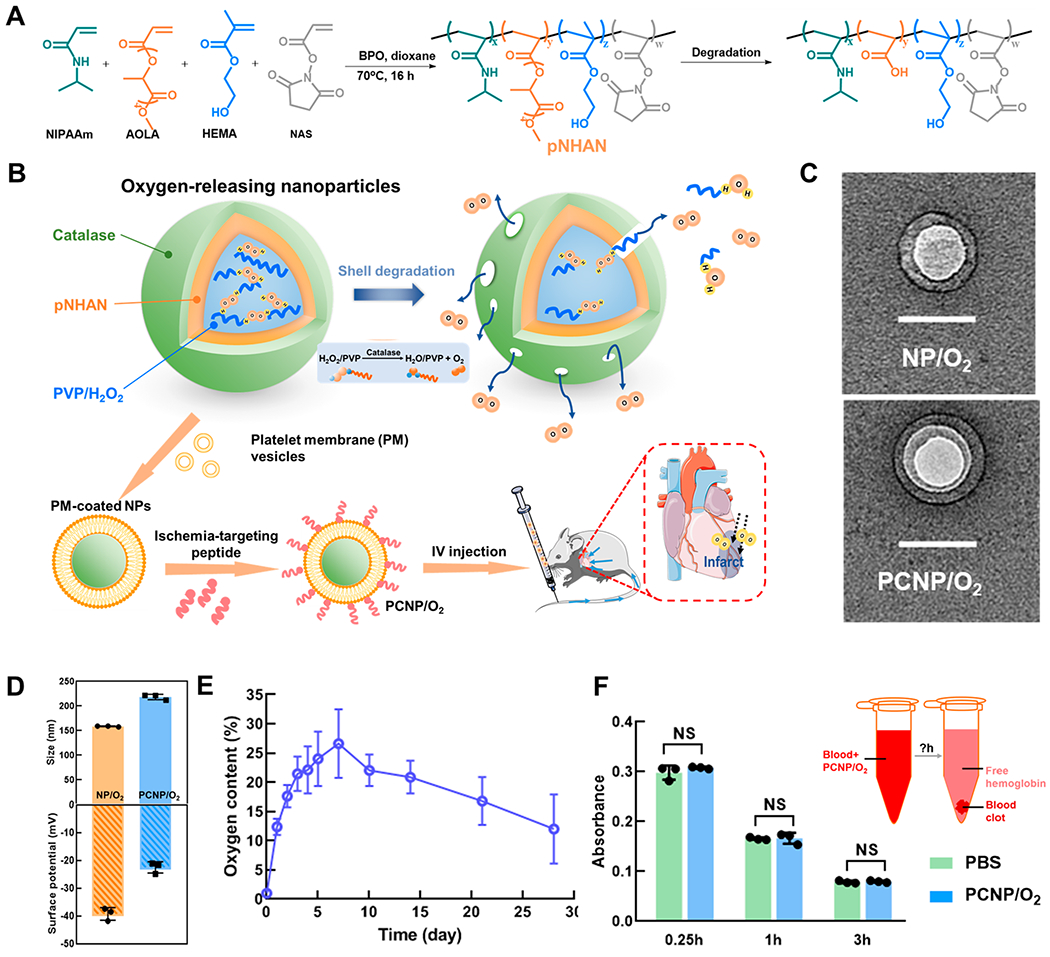
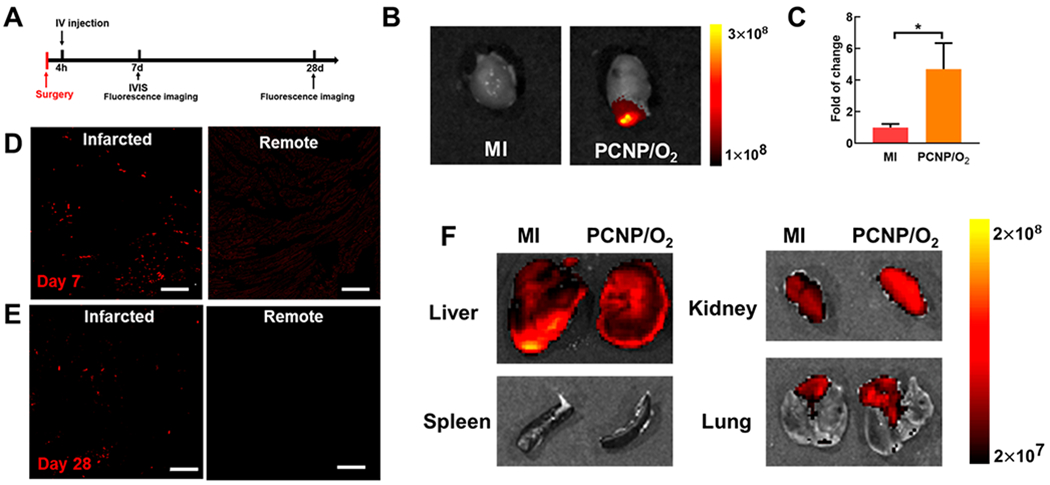
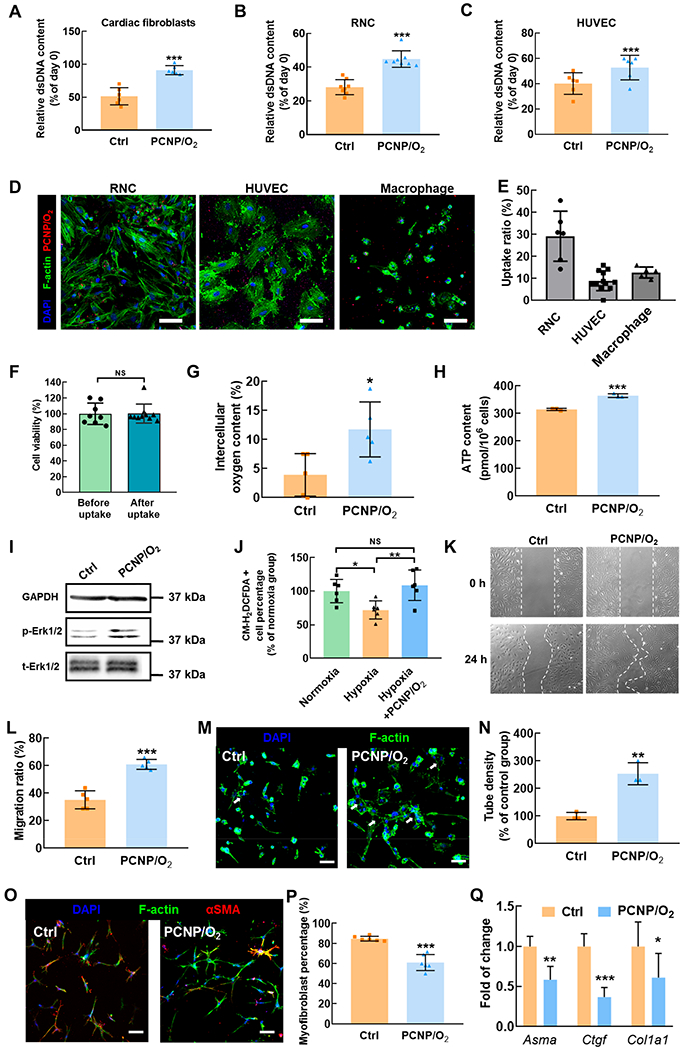
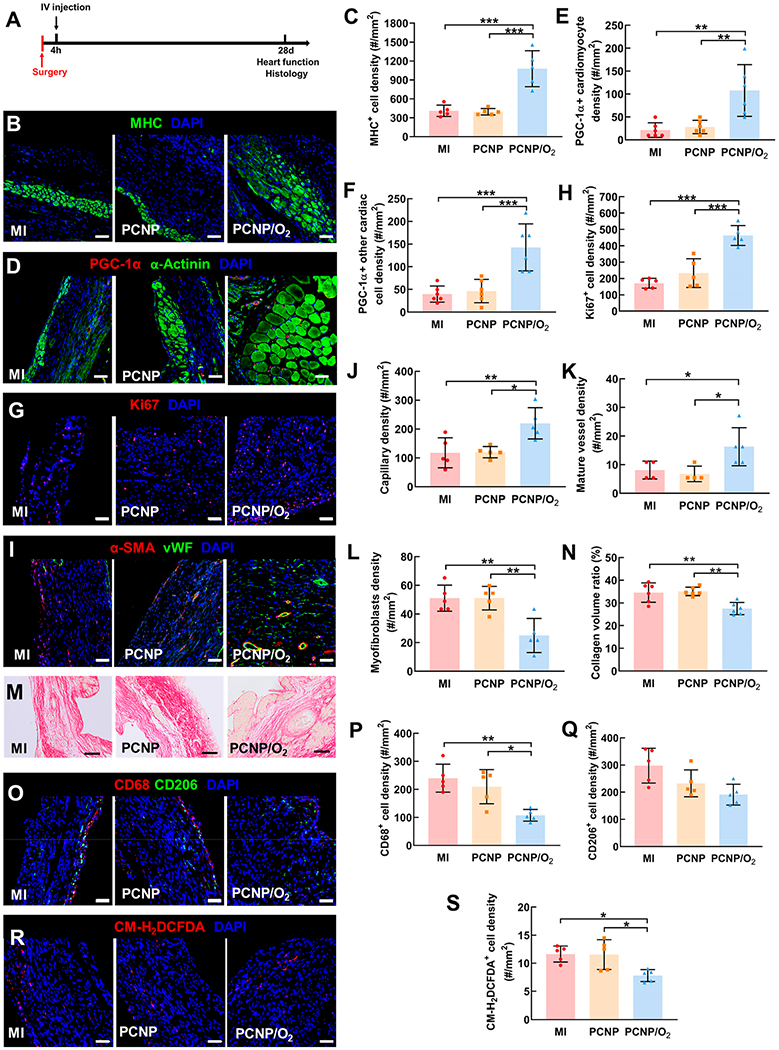
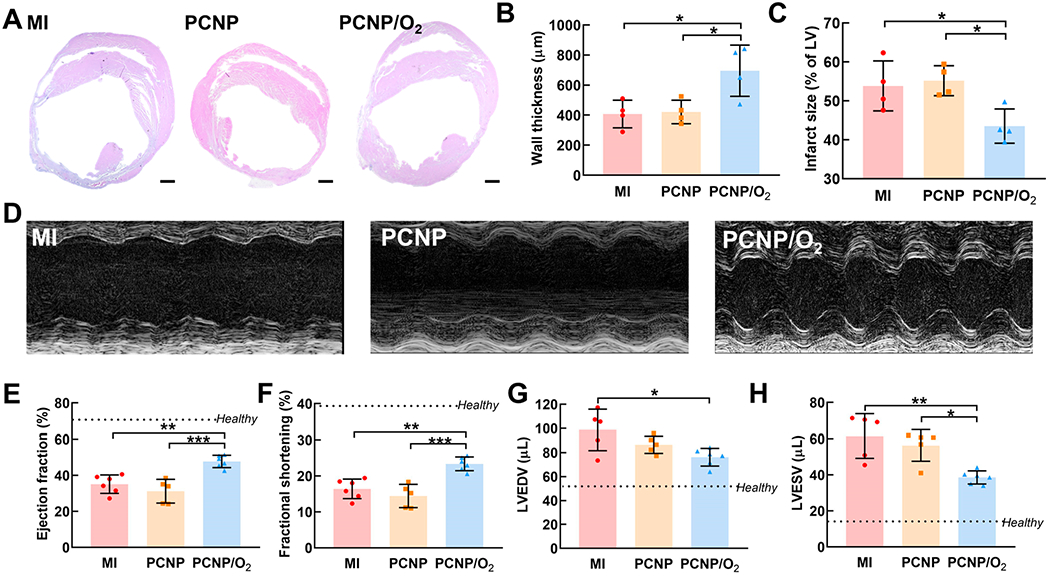
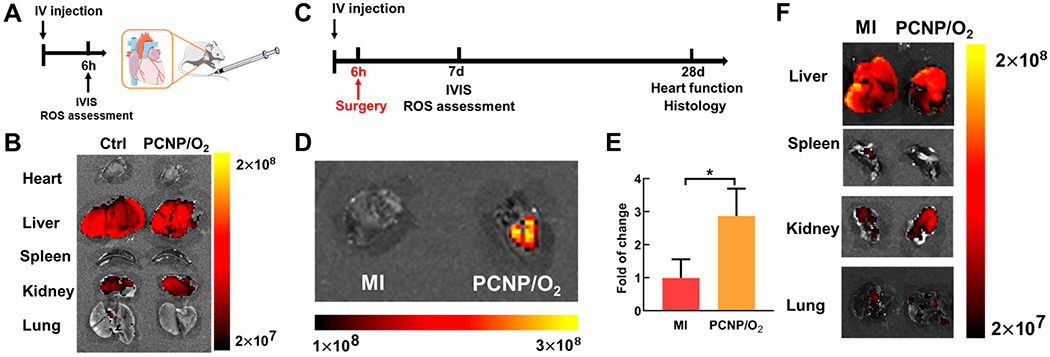
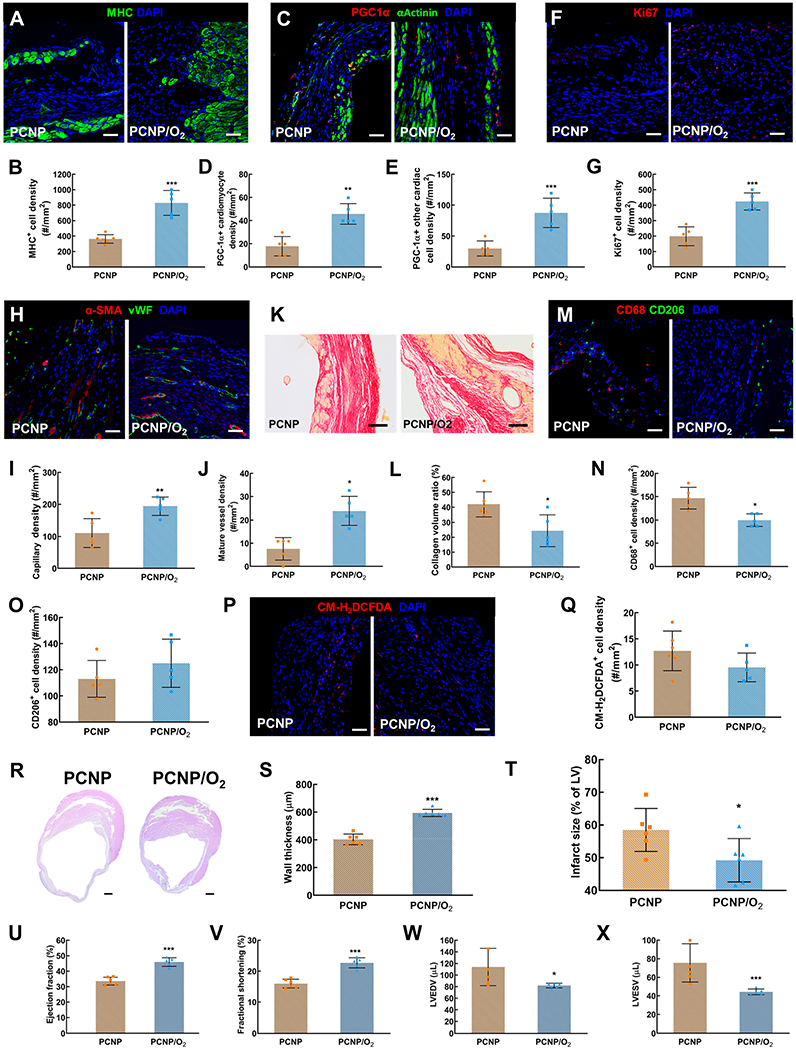
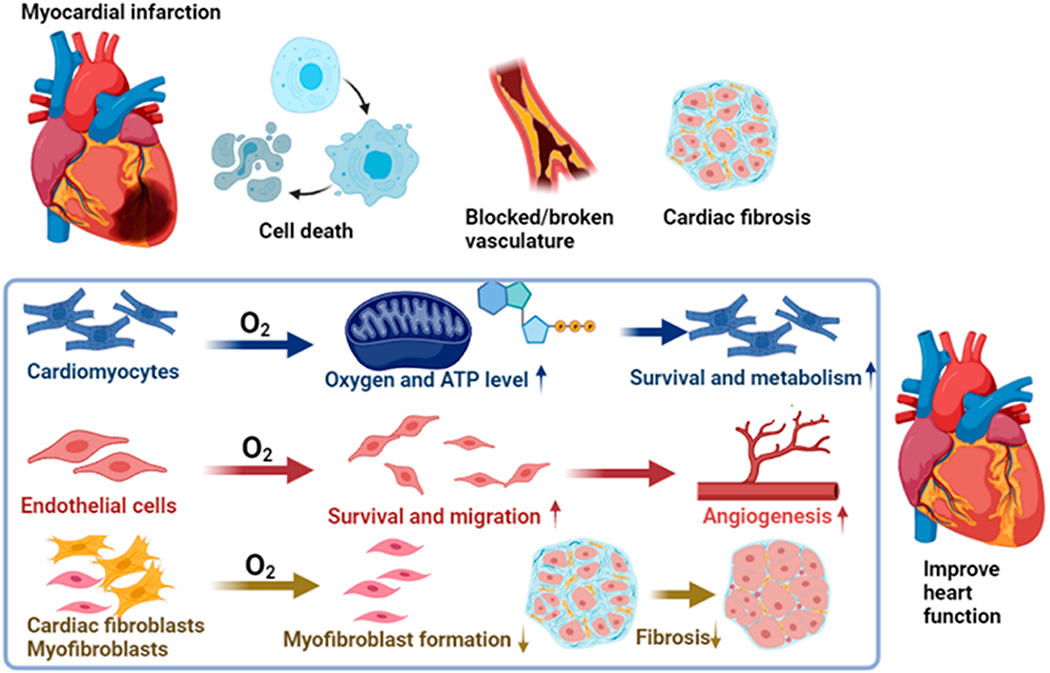
Myocardial infarction (MI) causes massive cell death due to restricted blood flow and oxygen deficiency. Rapid and sustained oxygen delivery following MI rescues cardiac cells and restores cardiac function. However, current oxygen-generating materials cannot be administered during acute MI stage without direct injection or suturing methods, both of which risk rupturing weakened heart tissue. Here, we present infarcted heart-targeting, oxygen-releasing nanoparticles capable of being delivered by intravenous injection at acute MI stage, and specifically accumulating in the infarcted heart. The nanoparticles can also be delivered before MI, then gather at the injured area after MI. We demonstrate that the nanoparticles, delivered either pre-MI or post-MI, enhance cardiac cell survival, stimulate angiogenesis, and suppress fibrosis without inducing substantial inflammation and reactive oxygen species overproduction. Our findings demonstrate that oxygen-delivering nanoparticles can provide a nonpharmacological solution to rescue the infarcted heart during acute MI and preserve heart function.

Keywords: acute myocardial infarction; controlled release of oxygen; myocardial repair; nanoparticles; targeted delivery.


Conflict of interest statement

The authors declare no competing financial interest.

Figures

Figure 1.
Figure 1.
Design and characterization of oxygen-releasing nanoparticles. (A) Synthesis and degradation of poly(N-isopropylacrylamide-co-hydroxyethyl methacrylate-co-acrylate-oligolactide-co-N-acryloxysuccinimide) (pNHAN). (B) Schematic illustration of the synthesis of oxygen-releasing nanoparticles and the release mechanism. (C) TEM images of the nanoparticles (NP/O2) and the platelet membrane coated, CST conjugated nanoparticles (PCNP/O2). Scale bar = 100 nm. (D) Hydrodynamic diameter and surface ζ potential of NP/O2 and PCNP/O2 (n = 3). (E) Oxygen release kinetics of the nanoparticles for 28 days (n = 5). (F) Thromboresistance test of PCNP/O2. After the blood was incubated with PCNP/O2 or DPBS, the absorbance of hemoglobin (540 nm) released from free red blood cells that were not in the blood clot was measured at 0.25, 1, and 3 h (n = 3). NS = not significant (P > 0.05).
Figure 2.
Figure 2.
Infarcted heart-targeting capability of PCNP/O2 delivered after MI. (A) Timeline for the animal study to examine the infarcted heart-targeting capability of the PCNP/O2. (B, C) IVIS images and quantification of the hearts harvested 7 days after MI surgery (n = 3). *P < 0.05. (D, E) Fluorescent images of the infarcted and remote regions of the myocardium 7 days (D) and 28 days (E) after surgery. Scale bar = 50 μm. (F) IVIS images of liver, spleen, kidney, and lung harvested 7 days after MI. Bronchi connected to the lung were not removed. It showed autofluorescence.
Figure 3.
Figure 3.
Effect of released oxygen on cardiac cell survival, endothelial cell morphogenesis, and fibroblast differentiation into myofibroblast under hypoxia. (A,B,C) Relative dsDNA content of cardiac fibroblasts (A), rat neonatal cardiomyocytes (RNC) (B) and HUVEC (C) after 5-day culture under 1% O2 with PCNP/O2 (n ≥ 6). The nanoparticles without oxygen release were used as control. (D) Fluorescent images of RNCs, HUVECs, and macrophages after taking up PCNP/O2. Scale bar = 50 μm. (E) Quantification of the uptake ratio. (F) RNC viability before and after taking up the nanoparticles without oxygen release (n ≥ 8). (G) Intracellular oxygen content in cardiac fibroblasts after 24-h culture under 1% O2 with and without PCNP/O2 (n = 5). (H) Intracellular ATP content in HUVEC after 24-h culture under 1% O2 with and without PCNP/O2 (n = 3). (I) Immunoblotting of phosphorylated and total Erk1/2 in cardiac fibroblasts cultured under 1% O2 for 24 h. GAPDH serves as a loading control. (J) ROS content in cardiac fibroblasts cultured under normoxia, hypoxia (1% O2), and hypoxia with PCNP/O2 for 5 days (n = 3). (K) Migration of HUVECs cultured under 1% O2 with and without PCNP/O2 (n = 4). (L) Quantification of migration ratio. (M) Endothelial cells tube formation. HUVECs were cultured under 1% O2 with and without PCNP/O2 for 24 h (n = 3). Nuclei and cytoplasm were stained with DAPI and F-actin, respectively. Scale bar = 50 μm. (N) Quantification of tube density. (O) Immunofluorescence staining of alpha smooth muscle actin (αSMA, red) on cardiac fibroblasts cultured on collagen gel under 1% O2 for 24 h (n = 3). TGFβ1 was supplemented at a concentration of 5 ng/mL. Scale bar = 50 μm. (P) Quantification of αSMA positive myofibroblast density. (Q) Gene expression of Asma, Ctgf, and Col1a1 in cardiac fibroblasts cultured on collagen gel under 1% O2 for 24 h (n ≥ 5). Actb was used as a housekeeping gene. *P < 0.05, **P < 0.01, ***P < 0.001.
Figure 4.
Figure 4.
Effect of oxygen-releasing nanoparticles on cell survival and metabolism, angiogenesis, cardiac fibrosis, inflammation, and oxidative stress after MI. (A) Timeline for the animal study. (B) Immunofluorescence staining of myosin heavy chain (MHC, green). Images were taken in the infarcted region of the heart 28 days after MI (same below). Scale bar = 50 μm (same below, unless otherwise specified). (C) Quantification of MHC positive cell density. (D) Immunofluorescence staining of PGC-1α (red) and α-Actinin (green). (E) Quantification of PGC-1α positive cardiomyocyte density. (F) Quantification of PGC1α positive cardiac cells (excluding cardiomyocytes) density. (G) Immunofluorescence staining of Ki67 (red). (H) Quantification of Ki67 positive cell density. (I) Immunofluorescence staining of αSMA (red) and vWF (green). (J) Quantification of capillary density. (K) Quantification of mature vessel density. (L) Quantification of myofibroblast density. (M) Picrosirius staining of the infarcted heart. Scale bar = 100 μm. (N) Quantification of the collagen volume ratio. (O) Immunofluorescence staining of CD68 (red) and CD206 (green). (P) Quantification of CD68 positive cell density. (Q) Quantification of CD206 positive cell density. (R) ROS staining using CM-H2DCFDA. (S) Quantification of CM-H2DCFDA positive cell density. *P < 0.05, **P < 0.01, ***P < 0.001.
Figure 5.
Figure 5.
Oxygen-releasing nanoparticles delivered at acute MI stage increased wall thickness and augmented heart function. (A) H&E staining of the heart harvested 28 days after MI. Scale bar = 500 μm. (B) Quantification of left ventricle wall thickness. (C) Quantification of infarct size. (D to H) Echocardiographic analysis to assess heart function 28 days after MI. (D) Representative M-mode images and cardiac functional measurement including (E) ejection fraction (EF), (F) fractional shortening (FS), (G) left ventricle end-diastolic volume (LVEDV), and (H) left ventricle end-systolic volume (LVESV). *P < 0.05, **P < 0.01, ***P < 0.001.
Figure 6.
Figure 6.
Infarcted heart-targeting capability of the oxygen-releasing nanoparticles delivered before MI. (A) Timeline for the animal study of PCNP/O2 biodistribution after intravenous injection. (B) IVIS images of major organs harvested 6 h after intravenous injection. No injection group was used as the control (Ctrl). (C) Timeline for the animal study of PCNP/O2 delivered before MI. (D,E) IVIS images and quantification of the heart harvested 7 days after MI (n = 3). P < 0.05. (F) IVIS images of major organs harvested 7 days after MI. Bronchi connected to the lung were removed.
Figure 7.
Figure 7.
Effect of oxygen-releasing nanoparticles delivered before MI on cardiac repair following MI. (A) Immunofluorescence staining of myosin heavy chain (MHC, green). Images were taken in the infarcted region of the heart 28 days after MI (same below). (B) Quantification of MHC positive cell density. (C) Immunofluorescence staining of PGC1α (red) and α-Actinin (green). (D) Quantification of PGC1α positive cell density. (E) Quantification of PGC1α positive cardiac cells (excluding cardiomyocytes) density. (F) Immunofluorescence staining of Ki67 (red). (G) Quantification of Ki67 positive cell density. (H) Immunofluorescence staining of αSMA (red) and vWF (green). (I) Quantification of capillary density. (J) Quantification of mature vessel density. (K) Picrosirius staining of the infarcted heart. (L) Quantification of the collagen volume ratio. (M) Immunofluorescence staining of CD68 (red) and CD206 (green). (N) Quantification of CD68 positive cell density. (O) Quantification of CD206 positive cell density. (P) ROS staining using CM-H2DCFDA. (Q) Quantification of CM-H2DCFDA positive cell density. (R) H&E staining of the heart harvested 28 days after MI. Scale bar = 500 μm. (S) Quantification of left ventricle wall thickness. (T) Quantification of infarct size. (U) to (X) Echocardiographic analysis to assess heart function 28 days after MI, including (U) ejection fraction (EF), (V) fractional shortening (FS), (W) left ventricle end-diastolic volume (LVEDV), and (X) left ventricle end-systolic volume (LVESV). *P < 0.05, **P < 0.01, ***P < 0.001.
Figure 8.
Figure 8.
Mechanism of oxygen-mediated cardiac repair and heart function restoration.

Similar articles

Cited by

References

    1. GBD 2017 Causes of Death Collaborators. Global, regional, and national age-sex-specific mortality for 282 causes of death in 195 countries and territories, 1980–2017: a systematic analysis for the Global Burden of Disease Study 2017. Lancet 2018, 392 (10159), 1736–1788. - PMC - PubMed
    1. Fryar CD; Chen T-C; Li X Prevalence of uncontrolled risk factors for cardiovascular disease: United States, 1999–2010. NCHS Data Br. 2012, 103, 1–8. - PubMed
    1. Konstantinidis K; Whelan RS; Kitsis RN Mechanisms of cell death in heart disease. Arterioscler. Thromb. Vasc. Biol 2012, 32 (7), 1552–1562. - PMC - PubMed
    1. Shuvy M; Atar D; Gabriel Steg P; Halvorsen S; Jolly S; Yusuf S; Lotan C Oxygen therapy in acute coronary syndrome: are the benefits worth the risk? Eur. Heart J 2013, 34 (22), 1630–1635. - PubMed
    1. Raut MS; Maheshwari A Oxygen supplementation in acute myocardial infarction: To be or not to be? Ann. Card. Anaesth 2016, 19 (2), 342–344. - PMC - PubMed

Publication types