

The FADS1 rs174550 Genotype Modifies the n-3 and n-6 PUFA and Lipid Mediator Responses to a High Alpha-Linolenic Acid and High Linoleic Acid Diets
- PMID: 36367234
- PMCID: PMC10077898
- DOI: 10.1002/mnfr.202200351
The FADS1 rs174550 Genotype Modifies the n-3 and n-6 PUFA and Lipid Mediator Responses to a High Alpha-Linolenic Acid and High Linoleic Acid Diets
Abstract
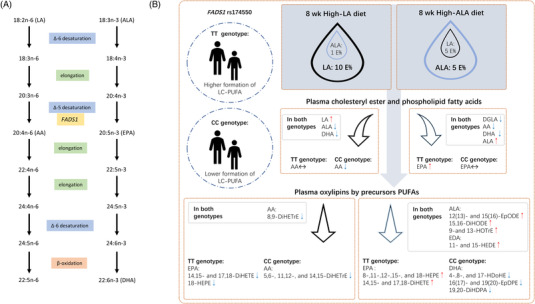
Scope: The fatty acid composition of plasma lipids, which is associated with biomarkers and risk of non-communicable diseases, is regulated by dietary polyunsaturated fatty acids (PUFAs) and variants of fatty acid desaturase (FADS). We investigated the interactions between dietary PUFAs and FADS1 rs174550 variant.
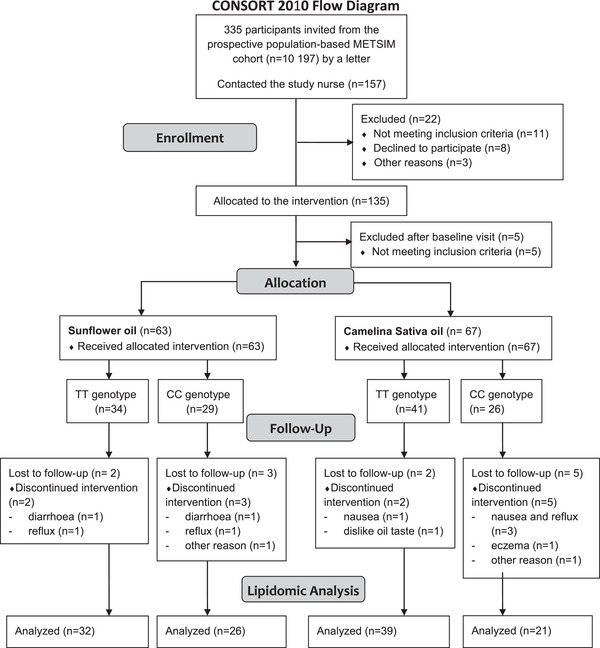
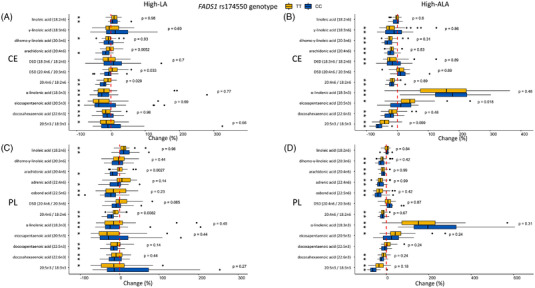
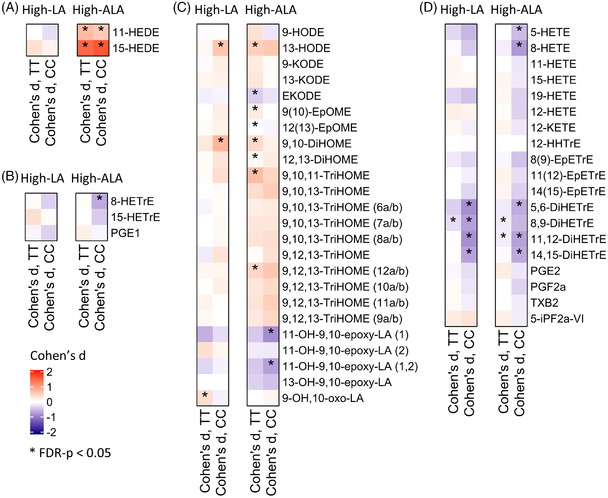
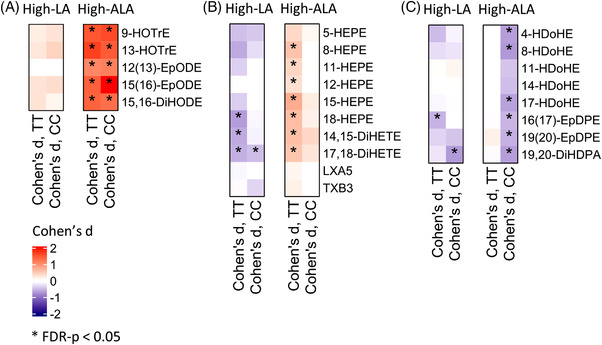
Methods and results: Participants (n = 118), homozygous for FADS1 rs174550 variant (TT and CC) followed a high alpha-linolenic acid (ALA, 5 percent of energy (E-%)) or a high linoleic acid (LA, 10 E-%) diet during an 8-week randomized controlled intervention. Fatty acid composition of plasma lipids and PUFA-derived lipid mediators were quantified by gas and liquid chromatography mass spectrometry, respectively. The high-LA diet increased the concentration of plasma LA, but not its lipid mediators. The concentration of plasma arachidonic acid decreased in carriers of CC and remained unchanged in the TT genotype. The high-ALA diet increased the concentration of plasma ALA and its cytochrome P450-derived epoxides and dihydroxys, and cyclooxygenase-derived monohydroxys. Concentrations of plasma eicosapentaenoic acid and its mono- and dihydroxys increased only in TT genotype carriers.
Conclusions: These findings suggest the potential for genotype-based recommendations for PUFA consumption, resulting in modulation of bioactive lipid mediators which can exert beneficial effects in maintaining health.
Keywords: FADS; alpha-linolenic acid; eicosanoid; eicosapentaenoic acid; linoleic acid; octadecanoid.
© 2022 The Authors. Molecular Nutrition & Food Research published by Wiley-VCH GmbH.
Conflict of interest statement
The authors declare no conflict of interest.
Figures
References
-
- Glaser C., Heinrich J., Koletzko B., Metabolism 2010, 59, 993. - PubMed
-
- Kathiresan S., Willer C. J., Peloso G. M., Demissie S., Musunuru K., Schadt E. E., Kaplan L., Bennett D., Li Y., Tanaka T., Voight B. F., Bonnycastle L. L., Jackson A. U., Crawford G., Surti A., Guiducci C., Burtt N. P., Parish S., Clarke R., Zelenika D., Kubalanza K. A., Morken M. A., Scott L. J., Stringham H. M., Galan P., Swift A. J., Kuusisto J., Bergman R. N., Sundvall J., Laakso M., et al., Nat. Genet. 2009, 41, 56. - PMC - PubMed
-
- Lankinen M. A., Fauland A., Shimizu B.‐i., Ågren J., Wheelock C. E., Laakso M., Schwab U., Pihlajamäki J., Am. J. Clin. Nutr. 2019, 109, 165. - PubMed
