Matrix Adhesiveness Regulates Myofibroblast Differentiation from Vocal Fold Fibroblasts in a Bio-orthogonally Cross-linked Hydrogel
- PMID: 36367478
- PMCID: PMC10350853
- DOI: 10.1021/acsami.2c13852
Matrix Adhesiveness Regulates Myofibroblast Differentiation from Vocal Fold Fibroblasts in a Bio-orthogonally Cross-linked Hydrogel
Abstract
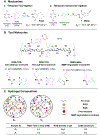
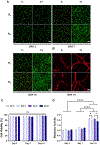
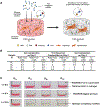
Repeated mechanical and chemical insults cause an irreversible alteration of extracellular matrix (ECM) composition and properties, giving rise to vocal fold scarring that is refractory to treatment. Although it is well known that fibroblast activation to myofibroblast is the key to the development of the pathology, the lack of a physiologically relevant in vitro model of vocal folds impedes mechanistic investigations on how ECM cues promote myofibroblast differentiation. Herein, we describe a bio-orthogonally cross-linked hydrogel platform that recapitulates the alteration of matrix adhesiveness due to enhanced fibronectin deposition when vocal fold wound healing is initiated. The synthetic ECM (sECM) was established via the cycloaddition reaction of tetrazine (Tz) with slow (norbornene, Nb)- and fast (trans-cyclooctene, TCO)-reacting dienophiles. The relatively slow Tz-Nb ligation allowed the establishment of the covalent hydrogel network for 3D cell encapsulation, while the rapid and efficient Tz-TCO reaction enabled precise conjugation of the cell-adhesive RGDSP peptide in the hydrogel network. To mimic the dynamic changes of ECM composition during wound healing, RGDSP was conjugated to cell-laden hydrogel constructs via a diffusion-controlled bioorthognal ligation method 3 days post encapsulation. At a low RGDSP concentration (0.2 mM), fibroblasts residing in the hydrogel remained quiescent when maintained in transforming growth factor beta 1 (TGF-β1)-conditioned media. However, at a high concentration (2 mM), RGDSP potentiated TGF-β1-induced myofibroblast differentiation, as evidenced by the formation of an actin cytoskeleton network, including F-actin and alpha-smooth muscle actin. The RGDSP-driven fibroblast activation to myofibroblast was accompanied with an increase in the expression of wound healing-related genes, the secretion of profibrotic cytokines, and matrix contraction required for tissue remodeling. This work represents the first step toward the establishment of a 3D hydrogel-based cellular model for studying myofibroblast differentiation in a defined niche associated with vocal fold scarring.
Keywords: cell-adhesive peptide; myofibroblasts; tetrazine ligation; transforming growth factor beta1; vocal fold fibroblasts.
Figures


Similar articles
-
Inhibition of the MRTF-A/SRF signaling axis alleviates vocal fold scarring.Matrix Biol. 2025 May;137:1-11. doi: 10.1016/j.matbio.2025.02.004. Epub 2025 Feb 14. Matrix Biol. 2025. PMID: 39956286
-
Inhibitory effects of hepatocyte growth factor and interleukin-6 on transforming growth factor-beta1 mediated vocal fold fibroblast-myofibroblast differentiation.Ann Otol Rhinol Laryngol. 2010 May;119(5):350-7. doi: 10.1177/000348941011900513. Ann Otol Rhinol Laryngol. 2010. PMID: 20524582 Free PMC article.
-
Featured Article: TGF-β1 dominates extracellular matrix rigidity for inducing differentiation of human cardiac fibroblasts to myofibroblasts.Exp Biol Med (Maywood). 2018 Apr;243(7):601-612. doi: 10.1177/1535370218761628. Epub 2018 Mar 4. Exp Biol Med (Maywood). 2018. PMID: 29504479 Free PMC article.
-
Myofibroblast differentiation during fibrosis: role of NAD(P)H oxidases.Kidney Int. 2011 May;79(9):944-56. doi: 10.1038/ki.2010.516. Epub 2011 Feb 9. Kidney Int. 2011. PMID: 21307839 Free PMC article. Review.
-
The myofibroblast, a key cell in normal and pathological tissue repair.Cell Mol Life Sci. 2016 Mar;73(6):1145-57. doi: 10.1007/s00018-015-2110-0. Epub 2015 Dec 17. Cell Mol Life Sci. 2016. PMID: 26681260 Free PMC article. Review.
Cited by
-
Modeling the Maturation of the Vocal Fold Lamina Propria Using a Bioorthogonally Tunable Hydrogel Platform.Adv Healthc Mater. 2023 Nov;12(29):e2301701. doi: 10.1002/adhm.202301701. Epub 2023 Aug 13. Adv Healthc Mater. 2023. PMID: 37530909 Free PMC article.
-
Adiponectin inhibits TGF-β1-induced skin fibroblast proliferation and phenotype transformation via the p38 MAPK signaling pathway.Open Life Sci. 2023 Aug 10;18(1):20220679. doi: 10.1515/biol-2022-0679. eCollection 2023. Open Life Sci. 2023. PMID: 37589003 Free PMC article.
-
Injectable, pore-forming, self-healing, and adhesive hyaluronan hydrogels for soft tissue engineering applications.Sci Rep. 2023 Aug 31;13(1):14303. doi: 10.1038/s41598-023-41468-9. Sci Rep. 2023. PMID: 37652951 Free PMC article.
-
Novel application of bone marrow mesenchymal stem cells combined with hepatocyte growth factor on subacute vocal fold wound healing.World J Otorhinolaryngol Head Neck Surg. 2024 Sep 16;11(2):264-275. doi: 10.1002/wjo2.215. eCollection 2025 Jun. World J Otorhinolaryngol Head Neck Surg. 2024. PMID: 40535737 Free PMC article.
-
A Promotion Role of MIR31 in the Process of Vocal Fold Wound Healing.PPAR Res. 2023 Aug 8;2023:4672827. doi: 10.1155/2023/4672827. eCollection 2023. PPAR Res. 2023. PMID: 37588448 Free PMC article.
References
-
- Hirano M Morphological structure of the vocal cord as a vibrator and its variations. Folia phoniatrica et logopaedica 1974, 26 (2), 89–94. - PubMed
-
- Friedrich G; Dikkers F; Arens C; Remacle M; Hess M; Giovanni A; Duflo S; Hantzakos A; Bachy V; Gugatschka M Vocal fold scars: current concepts and future directions. Consensus report of the Phonosurgery Committee of the European Laryngological Society. Eur. Arch. Otorhinolaryngol 2013, 270 (9), 2491–2507. - PubMed
-
- Gray SD Cellular physiology of the vocal folds. Otolaryngol. Clin. North Am 2000, 33 (4), 679–697. - PubMed
-
- Catten M; Gray SD; Hammond TH; Zhou R; Hammond E Analysis of cellular location and concentration in vocal fold lamina propria. Otolaryngol Head Neck Surg 1998, 118 (5), 663–667. - PubMed
-
- Tateya T; Tateya I; Sohn JH; Bless DM Histological study of acute vocal fold injury in a rat model. Ann. Otol. Rhinol. Laryngol 2006, 115 (4), 285–292. - PubMed
MeSH terms
Substances
Grants and funding
LinkOut - more resources
Full Text Sources

