. 2022 Dec;44(6):2757-2770.
doi: 10.1007/s11357-022-00685-2. Epub 2022 Nov 11.

Associations between biomarkers of cellular senescence and physical function in humans: observations from the lifestyle interventions for elders (LIFE) study

Affiliations

Associations between biomarkers of cellular senescence and physical function in humans: observations from the lifestyle interventions for elders (LIFE) study

Roger A Fielding et al. Geroscience. 2022 Dec.

Abstract

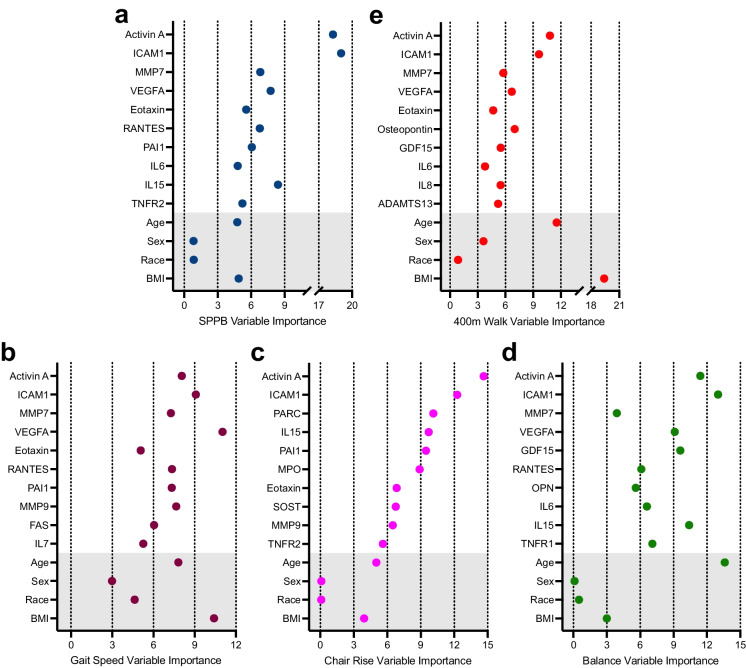
Cellular senescence is a plausible mediator of age-associated declines in physical performance. To test this premise, we examined cross-sectional associations between circulating components of the senescence-associated secretory phenotype (SASP) and measures of physical function and muscle strength in 1377 older adults. We showed significant associations between multiple SASP proteins and the short physical performance battery (SPPB), its subcomponents (gait speed, balance, chair rise time), and 400-m walk time. Activin A, ICAM1, MMP7, VEGFA, and eotaxin showed strong associations based on gradient boost machine learning (GBM), and, when combined with other proteins, effectively identified participants at the greatest risk for mobility disability (SPPB score [Formula: see text] 7). Senescence biomarkers were also associated with lower grip strength, and GBM identified PARC, ADAMTS13, and RANTES as top candidates in females, and MMP2, SOST, and MCP1 in males. These findings highlight an association between senescence biomarkers and physical performance in older adults. ClinicalTrials.gov Identifier: NCT01072500.

Keywords: Aging; Biomarkers; Frailty; Physical function; Sarcopenia; Short physical performance battery.


Conflict of interest statement

Mayo Clinic, TAW, and NKL have an intellectual property related to this work. This research has been reviewed by the Mayo Clinic Conflict of Interest Review Board and is being conducted in compliance with Mayo Clinic Conflict of Interest policies.

Figures

Fig. 1
Fig. 1
Biomarkers of cellular senescence associated with measures of physical functioning. a Heatmap representing the unadjusted Spearman’s rank correlations of 27 senescence-associated biomarkers and physical function outcomes (SPPB, 4 m gait speed, chair rise time, balance score, and 400 m walk time) (n = 1377). b Unadjusted Spearman correlation between SPPB score (0–12 score) and activin A, with Spearman Rho and P value in top right. c Unadjusted Spearman correlation between 4 m gait speed (m/s) and MMP7, with Spearman Rho and P value in top right. d Unadjusted Spearman correlation between Chair Rise Time (s) and ICAM1, with Spearman Rho and P value in top right. e Unadjusted Spearman correlation between balance score (0–4 score) and activin A, with Spearman Rho and P value in top right. f Unadjusted Spearman correlation between 400 m walk time (s) and activin A, with Spearman Rho and P value in top right. All biomarker measures were standardized by subtracting the mean and dividing by the standard deviation
Fig. 2
Fig. 2
Biomarkers of senescence are robust determinants of physical functioning. The top ten biomarkers along with age (years), sex (female, male), race (White, Black or African American, Hispanic, Asian, or Other), and BMI (kg/ht m.2) selected by gradient boost modeling for a SPPB (0–12 score). b 4 m gait speed (m/s), c chair rise time (s), d balance score (0–4 score), and e 400 m walk time
Fig. 3
Fig. 3
Biomarkers of cellular senescence identify risk for mobility disability. Receiver operator characteristic (ROC) curves to distinguish participants with higher (8–12) and lower SPPB scores (< 8) in a training data (n = 1,050) and b test data (n = 327). ROC curve to distinguish between participants with slower (≤ 0.8 m/s) and faster gait speeds, c in training data (n = 1049) and d test data (n = 327). Figures reflect the discriminatory ability of the top ten biomarkers selected by gradient boost modeling plus age, sex race, and BMI (Model 1), the top ten biomarkers alone (Model 2), and age, sex, race, and BMI alone (Model 3). The area under the curve values appears in the bottom right of each panel
Fig. 4
Fig. 4
Biomarkers of cellular senescence and muscle strength. a Heatmap representing the unadjusted Spearman’s rank correlations of 27 senescence-associated biomarkers and grip strength in females (top row) and males (bottom row). b Unadjusted Spearman correlation between grip strength (kg) in females and RAGE, with Spearman Rho and P value in top right. c, Unadjusted Spearman correlation between grip strength (kg) in males and SOST, with Spearman Rho and P value in the top right. All biomarker measures were standardized by subtracting the mean and dividing by the standard deviation. Top ten biomarkers along with age (years), sex (female, male), race (White, Black or African American, Hispanic, Asian, or Other)), and BMI (kg/ht m.2) selected by gradient boost modeling for grip strength in females (d) and males (e)
Fig. 5
Fig. 5
Biomarkers of cellular senescence and risk for muscle weakness. Receiver operator characteristic (ROC) curves to identify female participants with poor grip strength (< 20 kg) in a training data (n = 649) and b test data (n = 331). ROC curves to identify male participants with poor grip strength (< 35.5 kg) in c training data (n = 331) and d test data (n = 109). Figures reflect the discriminatory ability of the top ten biomarkers selected by gradient boost modeling plus age, sex race, and BMI (Model 1), the top ten biomarkers alone (Model 2), and age, sex, race, and BMI alone (Model 3). The area under the curve values appears in the bottom right of each panel

References

    1. Carter CS, Sonntag WE, Onder G, Pahor M. Physical performance and longevity in aged rats. J Gerontol A Biol Sci Med Sci. 2002;57(5):B193–197. doi: 10.1093/gerona/57.5.B193. - DOI - PubMed
    1. Guralnik JM, Simonsick EM, Ferucci L, et al. A short physical performance battery assessing lower extremity function: association with self-reported disability and prediction of mortality in nursing home admission. J Gerontol. 1994;49:M85–M94. doi: 10.1093/geronj/49.2.M85. - DOI - PubMed
    1. Newman AB, Simonsick EM, Naydeck BL, et al. Association of long-distance corridor walk performance with mortality, cardiovascular disease, mobility limitation, and disability. JAMA. 2006;295(17):2018–2026. doi: 10.1001/jama.295.17.2018. - DOI - PubMed
    1. Rantanen T, Guralnik JM, Foley D, et al. Midlife hand grip strength as a predictor of old age disability. JAMA. 1999;281(6):558–560. doi: 10.1001/jama.281.6.558. - DOI - PubMed
    1. Cawthon PM, Manini T, Patel SM, et al. Putative cut-points in sarcopenia components and incident adverse health outcomes: an SDOC analysis. J Am Geriatr Soc. 2020;68(7):1429–1437. doi: 10.1111/jgs.16517. - DOI - PMC - PubMed

Publication types

Associated data