. 2022 Nov 22;16(11):18568-18578.
doi: 10.1021/acsnano.2c06897. Epub 2022 Nov 11.

Phase Reconstruction of Low-Energy Electron Holograms of Individual Proteins

Affiliations

Phase Reconstruction of Low-Energy Electron Holograms of Individual Proteins

Hannah Ochner et al. ACS Nano. .

Abstract

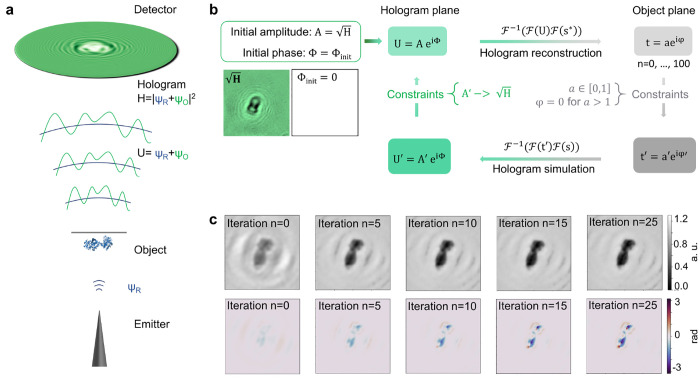
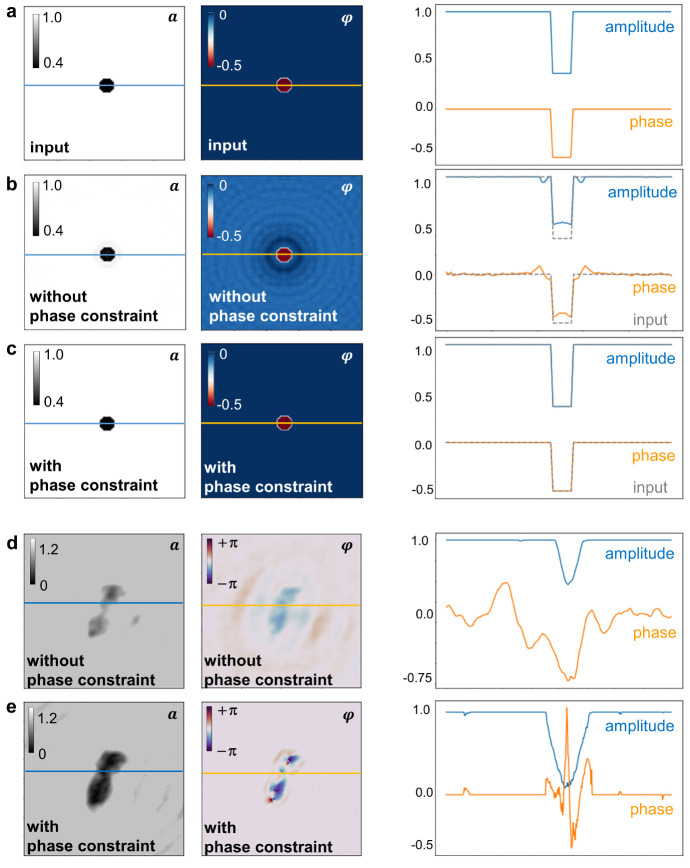
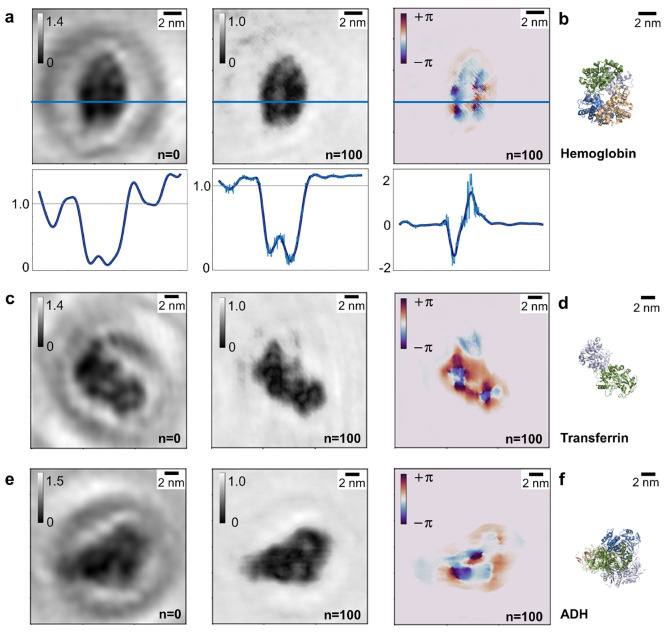
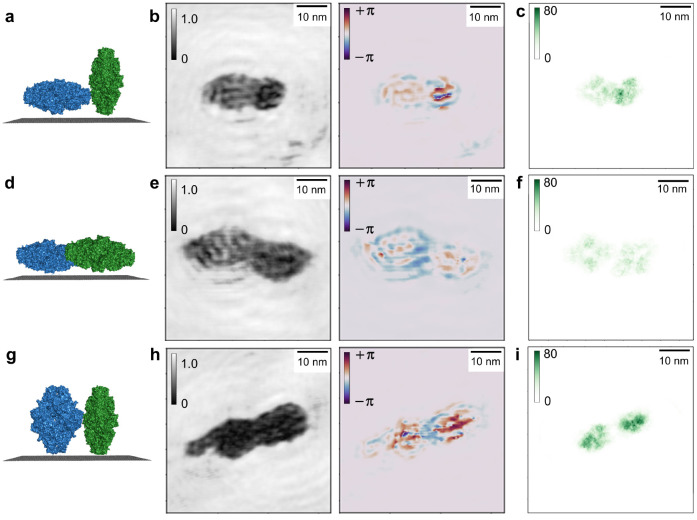
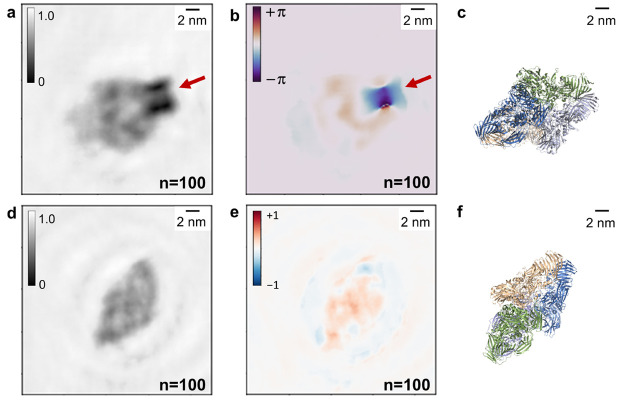
Low-energy electron holography (LEEH) is one of the few techniques capable of imaging large and complex three-dimensional molecules, such as proteins, on the single-molecule level at subnanometer resolution. During the imaging process, the structural information about the object is recorded both in the amplitude and in the phase of the hologram. In low-energy electron holography imaging of proteins, the object's amplitude distribution, which directly reveals molecular size and shape on the single-molecule level, can be retrieved via a one-step reconstruction process. However, such a one-step reconstruction routine cannot directly recover the phase information encoded in the hologram. In order to extract the full information about the imaged molecules, we thus implemented an iterative phase retrieval algorithm and applied it to experimentally acquired low-energy electron holograms, reconstructing the phase shift induced by the protein along with the amplitude data. We show that phase imaging can map the projected atomic density of the molecule given by the number of atoms in the electron path. This directly implies a correlation between reconstructed phase shift and projected mean inner potential of the molecule, and thus a sensitivity to local changes in potential, an interpretation that is further substantiated by the strong phase signatures induced by localized charges.

Keywords: hologram reconstruction; low-energy electron holography; phase retrieval; protein imaging; single-molecule imaging.


Conflict of interest statement

The authors declare no competing financial interest.

Figures

Figure 1
Figure 1
Hologram generation and iterative hologram reconstruction algorithm. (a) Sketch of the LEEH setup, consisting of an electron emitter, a protein sample deposited on free-standing single-layer graphene (the object) and a detector to record the hologram. The hologram (H) is generated as the interference pattern between the wave scattered by the object (ΨO) and the unscattered incident reference wave (ΨR). (b) Schematic representation of the iterative reconstruction algorithm used for the reconstructing amplitude and phase images of the object. During the reconstruction process, a complex wave field is propagated between the hologram plane and the object plane using a numerical implementation of a Fresnel–Kirchhoff integral. In both planes, a separate set of constraints is applied in each iteration step. (c) Amplitude (top) and phase (bottom) reconstructions after n = 0, 5, 10, 15, and 25 iteration steps. All images are scaled to the same value range as indicated by the color bars. In this example, convergence is reached after approximately 25 iterations. The elimination of the fringe pattern in the background of the reconstructed images with an increasing number of iterations demonstrates that the iterative process removes the contributions originating from the twin image.
Figure 2
Figure 2
Comparison of iterative phase retrieval with and without phase constraint. (a–c) Simulated example. (a) Left to right: input amplitude and phase distributions, along with the corresponding cross sections along the lines indicated in the images, used to simulate the hologram from which the reconstructions in (b) and (c) are obtained. (b) Left to right: Reconstructed amplitude and phase distributions resulting from an iterative phase retrieval algorithm enforcing only the amplitude constraint, but not the phase constraint in the object plane. The corresponding cross sections are depicted as solid lines; for comparison, the cross sections through the input are added as gray dashed lines. (c) Left to right: Reconstructed amplitude and phase distribution resulting from the iterative routine employing both the amplitude and the phase constraint in the object plane. The input (a) is perfectly reconstructed as demonstrated by the comparison of both the images and the cross sections. (d, e) Experimental example. (d) Left to right: Amplitude and phase reconstruction and corresponding cross sections of an experimentally acquired hologram of a transferrin molecule reconstructed without phase constraint. (e) Left to right: Amplitude and phase reconstruction and corresponding cross sections of the same hologram as in (d) reconstructed with both amplitude and phase constraint.
Figure 3
Figure 3
Amplitude and phase reconstructions of protein holograms. (a) Left to right: one-step amplitude reconstruction, iterated amplitude reconstruction after 100 iterations, and phase reconstruction after 100 iterations of a hemoglobin molecule and cross sections along the blue lines indicated in the images. The cross sections (light blue) have been smoothed with a Savitzky–Golay filter (dark blue) for enhanced clarity. (b) Crystallographic model of a hemoglobin molecule (PDB: 1FSX(39)) in an orientation matching the one observed in (a). (c) Left to right: one-step amplitude reconstruction, iterated amplitude reconstruction after 100 iterations, and phase reconstruction after 100 iterations of a transferrin molecule. (d) Crystallographic model of a transferrin molecule (PDB: 1JNF(40)) in an orientation matching the one observed in (c). (e) Left to right: one-step amplitude reconstruction, iterated amplitude reconstruction after 100 iterations and phase reconstruction after 100 iterations of an ADH molecule. (f) Crystallographic model of an ADH molecule (PDB: 7KCQ(41)) in an orientation matching the one observed in (e).
Figure 4
Figure 4
Correlation between reconstructed phase shift and projected atomic density. (a) Schematic of the orientation of the two β-galactosidase molecules in (b) with respect to the graphene substrate. The molecule on the left is in a flat orientation, whereas the molecule on the right is in an upright orientation; i.e., the molecules have different thicknesses as measured from the graphene. (b) Amplitude and phase reconstruction of a hologram featuring two β-galactosidase molecules in different orientations with respect to the substrate as schematically depicted in (a). (c) Projected atomic density of models of β-galactosidase (PDB: 6CVM) in orientations matching those in (b). Each pixel on the grid is colored according to the number of atoms projected into the pixel. The molecule in a flat orientation exhibits a lower overall projected atomic density than the molecule in upright orientation, which is reflected by the difference in overall phase shift generated by the two molecules. (d) Schematic of two β-galactosidase molecules in flat orientation. (e) Amplitude and phase reconstruction of a hologram featuring two β-galactosidase molecules in flat orientations with respect to the surface as sketched in (d). (f) Projected atomic density of the models corresponding to the orientations in (e). The overall projected atomic density as well as the overall phase shift of both molecules is similar. (g) Schematic of two β-galactosidase molecules in upright orientation. (h) Amplitude and phase reconstruction of a hologram featuring two β-galactosidase molecules in upright orientations with respect to the surface as sketched in (g). (i) Projected atomic density of the models corresponding to the orientations in (h). The overall projected atomic density as well as the overall phase shift of both molecules is similar, a slightly higher phase shift on the right can be correlated with an increased projected atomic density within the molecule on the right.
Figure 5
Figure 5
Sensitivity of the phase reconstruction to localized charges. (a, b) Iterative amplitude reconstruction (a) and iterative phase reconstruction (b) after 100 iterations of a hologram of a β-galactosidase molecule featuring a localized charge. The location of the charge is indicated by the red arrows. The charged feature is dominant, especially in the phase reconstruction. (c) Model of a β-galactosidase molecule (PDB: 6CVM(43)) in an orientation matching the one observed in the reconstructed images in (a, b). (d, e) Iterative amplitude reconstruction (d) and iterative phase reconstruction (e) after 100 iterations of a hologram of a β-galactosidase molecule in a similar orientation as the molecule in (a, b), but without a localized charged feature. Both amplitude and phase distribution feature values in a range similar to that observed in the protein signal in (a, b). (f) Model of a β-galactosidase molecule (PDB: 6CVM(43)) in an orientation matching the one observed in the reconstructed images in (d, e).

Similar articles

Cited by

References

    1. Fink H.-W.; Stocker W.; Schmid H. Holography with Low-Energy Electrons. Phys. Rev. Lett. 1990, 65, 1204–1206. 10.1103/PhysRevLett.65.1204. - DOI - PubMed
    1. Fink H.-W.; Schmid H.; Ermantraut E.; Schulz T. Electron Holography of Individual DNA Molecules. J. Opt. Soc. Am. A 1997, 14, 2168–2172. 10.1364/JOSAA.14.002168. - DOI
    1. Ochner H.; Szilagyi S.; Abb S.; Gault J.; Robinson C. V.; Malavolti L.; Rauschenbach S.; Kern K. Low-Energy Electron Holography Imaging of Conformational Variability of Single-Antibody Molecules from Electrospray Ion Beam Deposition. Proc. Natl. Acad. Sci. U. S. A 2021, 118 (51), e2112651118.10.1073/pnas.2112651118. - DOI - PMC - PubMed
    1. Longchamp J.-N.; Rauschenbach S.; Abb S.; Escher C.; Latychevskaia T.; Kern K.; Fink H.-W. Imaging Proteins at the Single-Molecule Level. Proc. Natl. Acad. Sci. U. S. A 2017, 114, 1474–1479. 10.1073/pnas.1614519114. - DOI - PMC - PubMed
    1. Nakane T.; Kotecha A.; Sente A.; McMullan G.; Masiulis S.; Brown P. M. G. E.; Grigoras I. T.; Malinauskaite L.; Malinauskas T.; Miehling J.; Uchanski T.; Yu L.; Karia D.; Pechnikova E. V.; de Jong E.; Keizer J.; Bischoff M.; McCormack J.; Tiemeijer P.; Hardwick S. W.; et al. Single-Particle cryo-EM at Atomic Resolution. Nature 2020, 587, 152–156. 10.1038/s41586-020-2829-0. - DOI - PMC - PubMed