. 2023 Feb 6;220(2):e20221333.
doi: 10.1084/jem.20221333. Epub 2022 Nov 11.

Intestinal toxicity to CTLA-4 blockade driven by IL-6 and myeloid infiltration

Affiliations

Intestinal toxicity to CTLA-4 blockade driven by IL-6 and myeloid infiltration

Yifan Zhou et al. J Exp Med. .

Abstract

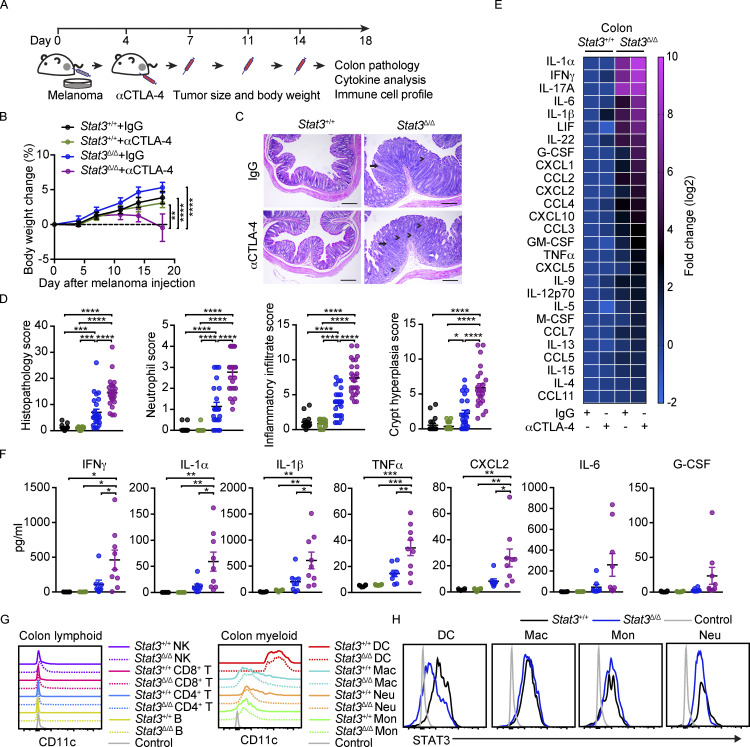
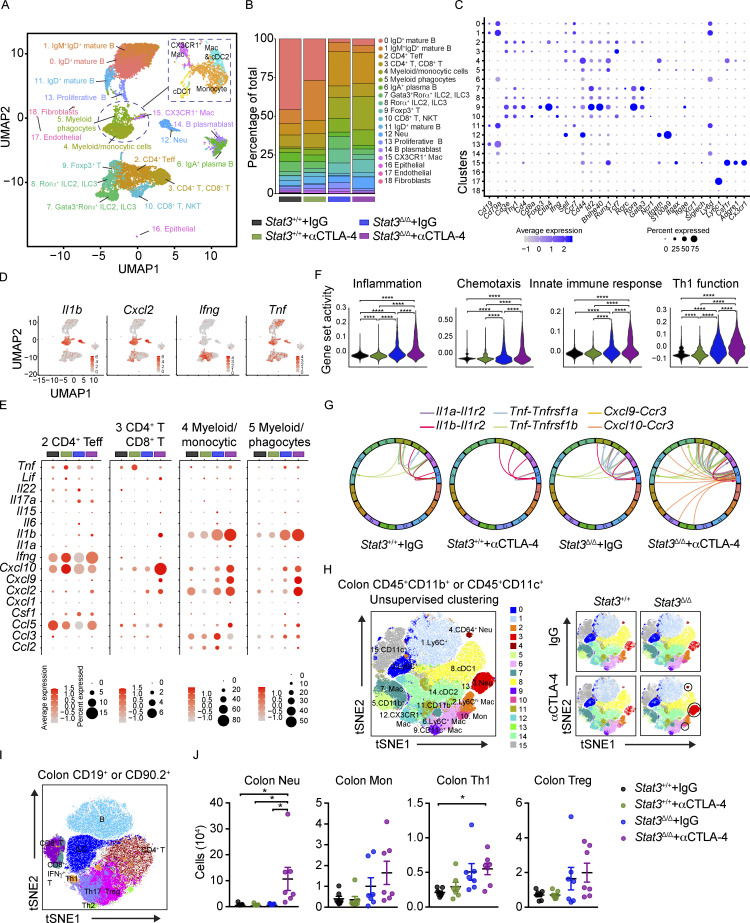
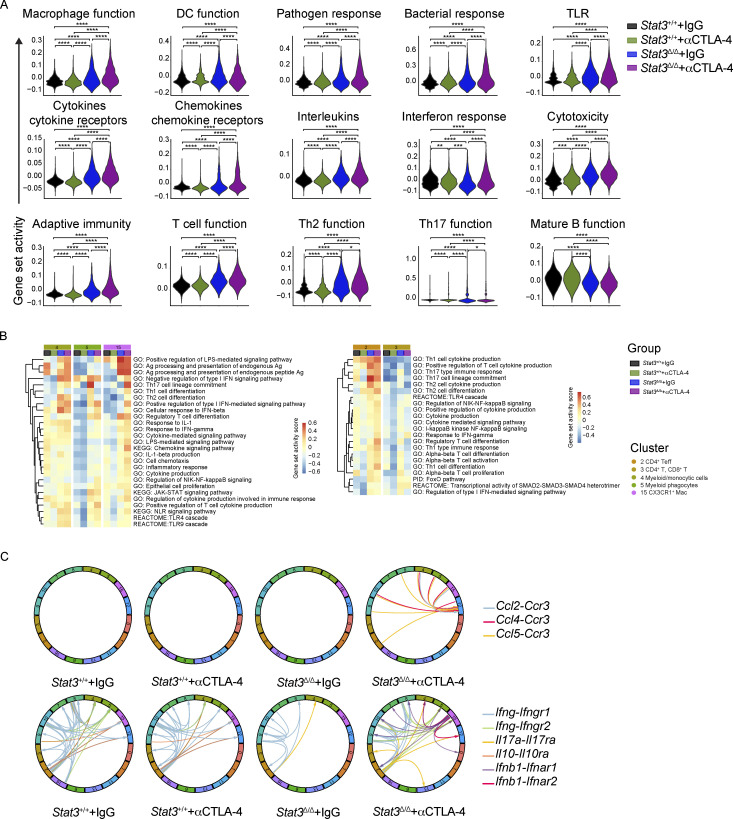
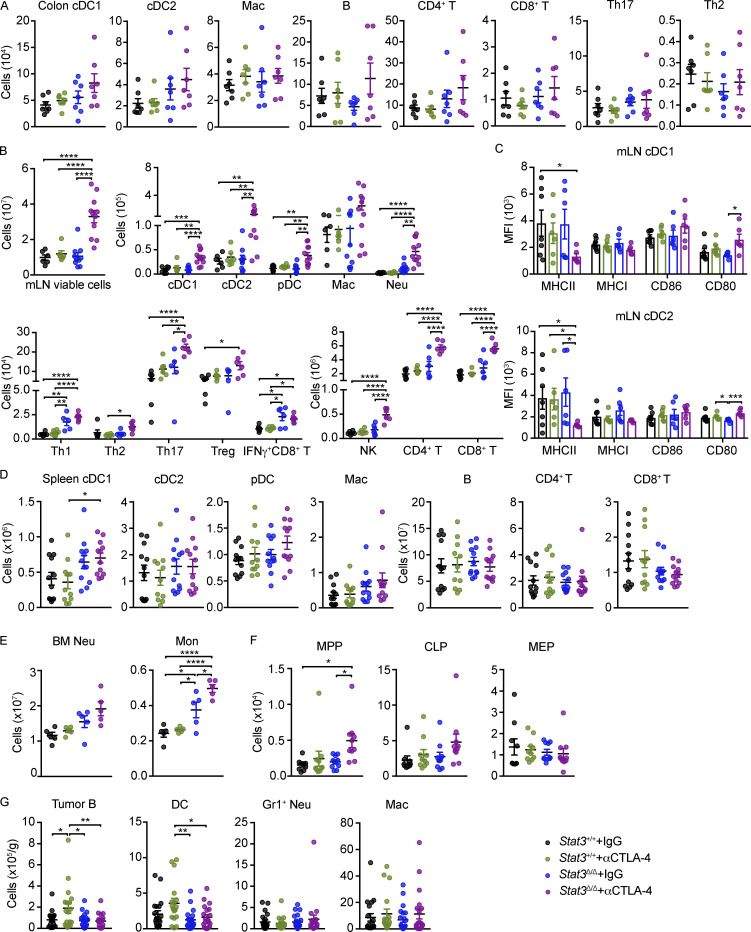
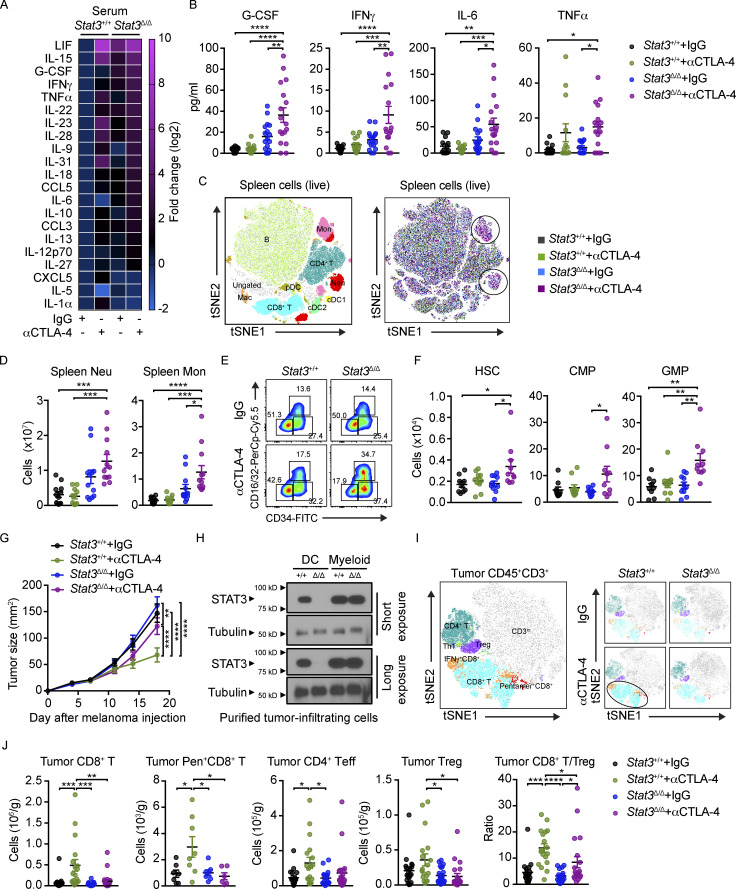
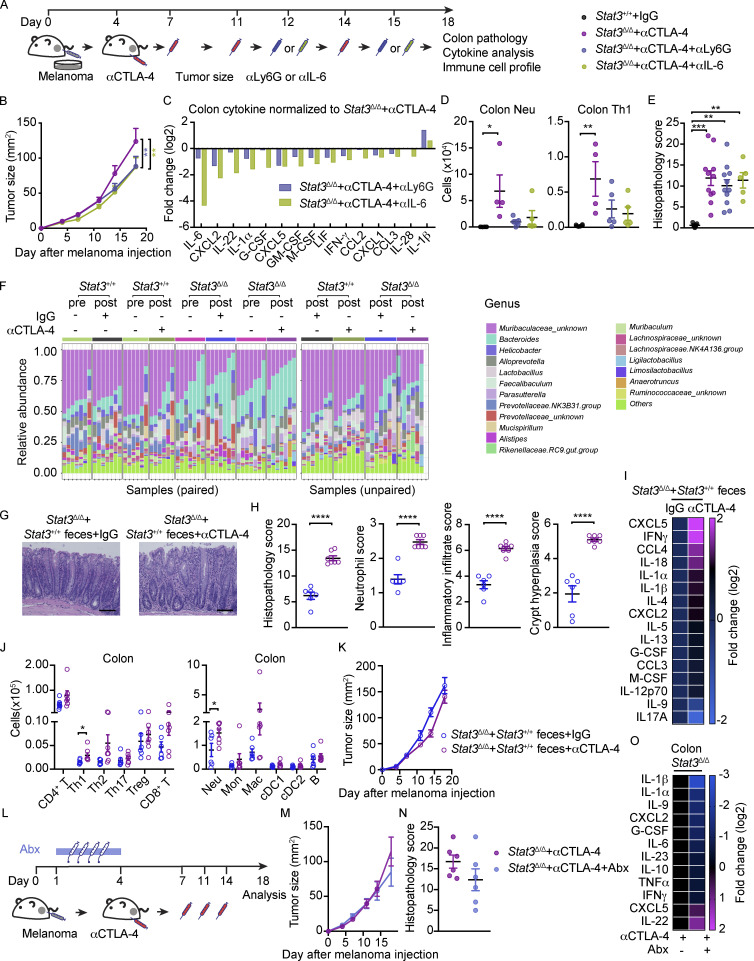
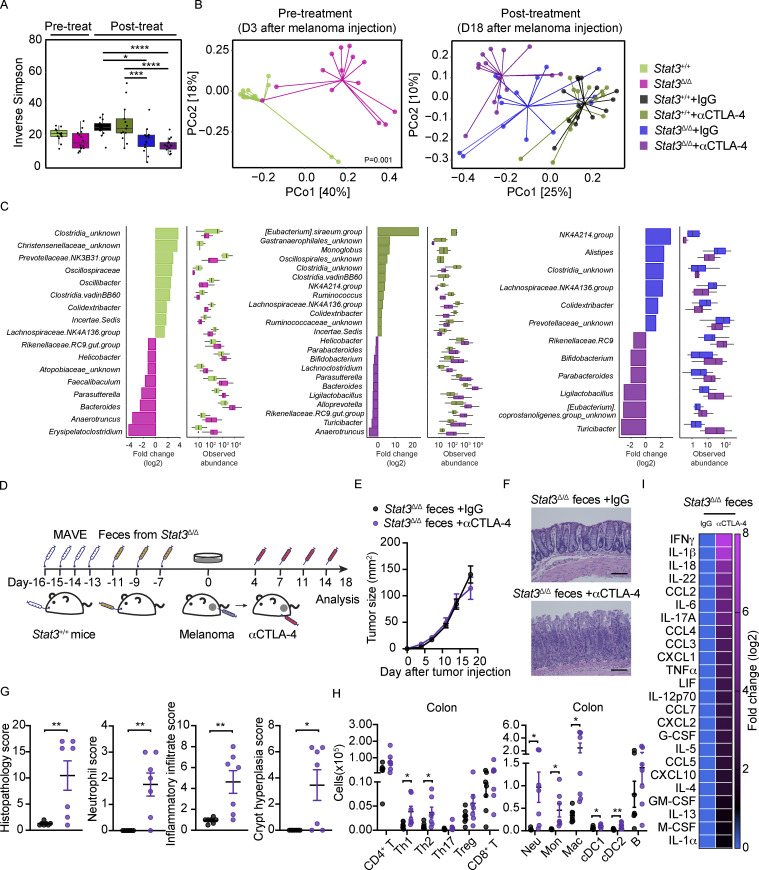
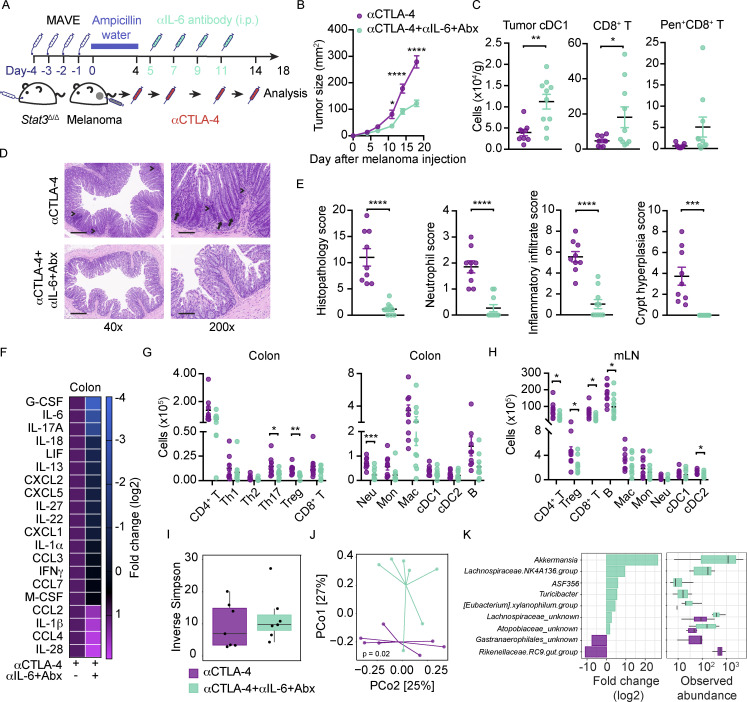
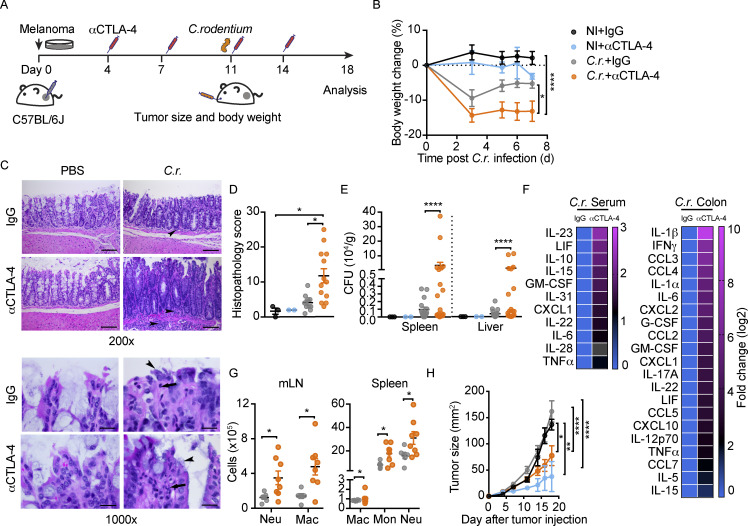
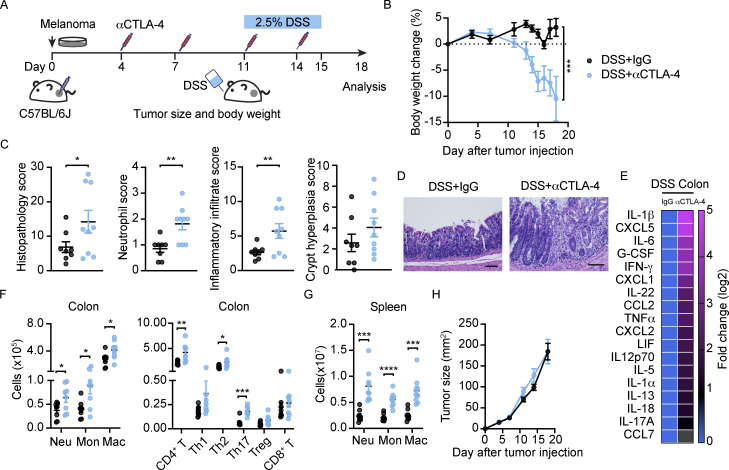
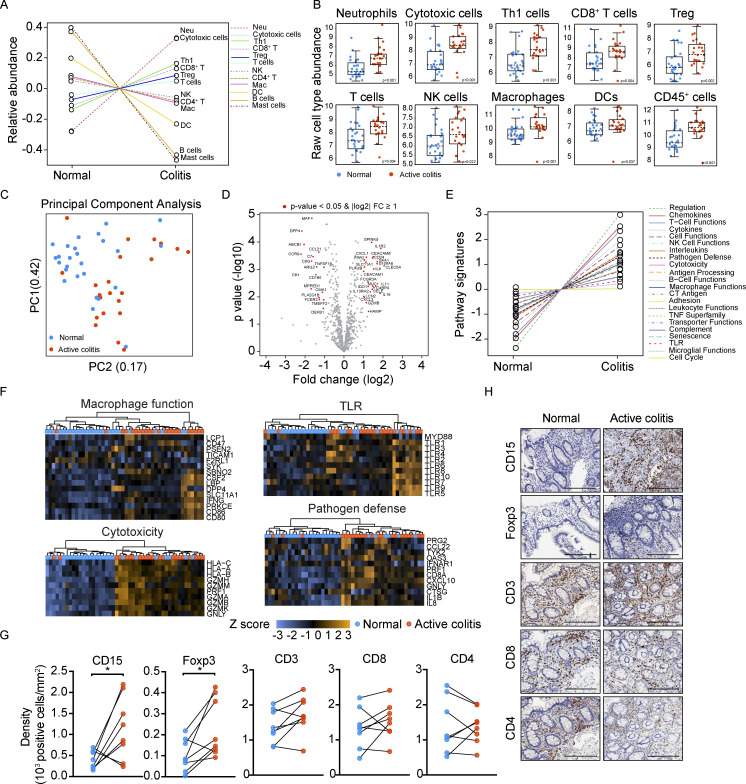
Immune checkpoint blockade (ICB) has revolutionized cancer treatment, yet quality of life and continuation of therapy can be constrained by immune-related adverse events (irAEs). Limited understanding of irAE mechanisms hampers development of approaches to mitigate their damage. To address this, we examined whether mice gained sensitivity to anti-CTLA-4 (αCTLA-4)-mediated toxicity upon disruption of gut homeostatic immunity. We found αCTLA-4 drove increased inflammation and colonic tissue damage in mice with genetic predisposition to intestinal inflammation, acute gastrointestinal infection, transplantation with a dysbiotic fecal microbiome, or dextran sodium sulfate administration. We identified an immune signature of αCTLA-4-mediated irAEs, including colonic neutrophil accumulation and systemic interleukin-6 (IL-6) release. IL-6 blockade combined with antibiotic treatment reduced intestinal damage and improved αCTLA-4 therapeutic efficacy in inflammation-prone mice. Intestinal immune signatures were validated in biopsies from patients with ICB colitis. Our work provides new preclinical models of αCTLA-4 intestinal irAEs, mechanistic insights into irAE development, and potential approaches to enhance ICB efficacy while mitigating irAEs.


Conflict of interest statement

Disclosures: A.P. Cogdill reported “other” from Immunai, Vastbiome, and Daiichi Sankyo outside the submitted work. D.H. Johnson reported personal fees from Bristol Meyers Squibb, AstraZeneca, Nektar Therapeutics, Pfizer, Brightpath Therapeutics, and Sanofi-Regeneron outside the submitted work. W. Peng reported personal fees from Fresh Wind Biotechnologies outside the submitted work. M. Tetzlaff reported personal fees from Myriad Genetics outside the submitted work. M.M. Gubin reported a personal honorarium of $1,000.00 USD per year from Springer Nature Ltd. for serving as an associate editor for the journal Nature Precision Oncology. P. Hwu reported “other” from Immatics SAB and Dragonfly SAB outside the submitted work. J.A. Wargo reported being an inventor on a U.S. patent application (PCT/US17/53.717) submitted by the University of Texas MD Anderson Cancer Center, which covers methods to enhance immune checkpoint blockade responses by modulating the microbiome; compensation for speaker’s bureau and honoraria from Imedex, Dava Oncology, Omniprex, Illumina, Gilead, PeerView, Physician Education Resource, MedImmune, Exelixis, and Bristol Myers Squibb; and has served as a consultant/advisory board member for Roche/Genentech, Novartis, AstraZeneca, GlaxoSmithKline, Bristol Myers Squibb, Micronoma, OSE Therapeutics, Merck, and Everimmune. In addition, J.A. Wargo receives stock options from Micronoma and OSE therapeutics. S.S. Watowich reported “other” from SniprBiome outside the submitted work, and served as a consultant/advisory board member for Asylia Therapeutics and Cellino Biotech. No other disclosures were reported.

Figures

Figure 1.
Figure 1.
αCTLA-4–mediated intestinal toxicity in inflammation-prone mice. Stat3Δ/Δ and Stat3+/+ mice bearing B16-OVA tumors were treated biweekly for 2 wk with IgG or αCTLA-4 beginning 4 d after tumor establishment, as indicated. Body weight was measured over time. Colon pathology was evaluated 18–19 d following tumor establishment. (A) Schematic diagram of the experimental approach. (B) Body weight over time; n = 21 per group. (C) Representative photomicrographs of colonic mucosa; intense inflammatory infiltrate in the LP (arrowheads) and crypt hyperplasia (arrow) are indicated; scale bar = 100 microns; H&E. (D) Summed scores for histopathology, neutrophil infiltrate, mixed inflammatory cell infiltrate, and crypt hyperplasia are shown; n = 18–24 per group. (E) Mean concentration of differentially expressed cytokines and chemokines in colon tissue (fold change absolute log2 > 1), determined by multiplex assays. Results were normalized to Stat3+/+ + IgG group and transformed to log2; n = 6–9 per group. (F) Cytokine concentration in colon tissues from individual mice (each mouse represented by one dot) determined by multiplex assays; n = 6–9 per group. (G) CD11c expression on colonic LP immune cells. (H) Intracellular staining of STAT3 in colonic LP myeloid cells. Data shown as mean ± SEM. Results from two to five independent experiments. Data were analyzed by two-way ANOVA (B), one-way ANOVA (D and F). * P < 0.05, ** P < 0.01, *** P < 0.001, **** P < 0.0001.
Figure S1.
Figure S1.
Flow cytometry gating strategy for colonic LP immune cells and scRNAseq analysis of colonic LP immune cells following αCTLA-4 therapy. (A) Gating strategy of colonic LP lymphoid cell subsets. (B) Gating strategy of colonic LP myeloid cell subsets. (C–E) Stat3Δ/Δ and Stat3+/+ mice bearing B16-OVA tumors were treated biweekly for 2 wk with IgG or αCTLA-4. Colonic LP immune cells were subjected to scRNAseq as indicated in Fig. 2; n = 7–8 per group. (C) Distinct composition of colonic LP immune cell populations in mice of indicated genotypes and treatments (left), with expanded view of myeloid clusters (right). (D) Feature plots of selected cluster-defining genes. (E) Heatmap of the top five differentially expressed genes in each cluster.
Figure 2.
Figure 2.
αCTLA-4 therapy remodels the intestinal immune landscape in inflammation-prone conditions. Stat3Δ/Δ and Stat3+/+ mice bearing B16-OVA tumors were treated biweekly for 2 wk with IgG or αCTLA-4. Colonic LP immune cells (live CD45+ cells) were isolated by FACS 18–19 d after tumor establishment and completion of therapy. (A–G) Colonic LP immune cells were subjected to scRNAseq. (A) UMAP plot showing distinct clusters generated from a merged dataset of the four experimental groups, based on transcriptomic analysis of 14,039 individual cells. Results represent 4,461 cells from the Stat3+/+ + IgG group, 4,734 cells from the Stat3+/+ + αCTLA-4 group, 1,341 cells from the Stat3Δ/Δ + IgG group, and 3,503 cells from the Stat3Δ/Δ + αCTLA-4 group; from seven to eight mice per group. Dimensionality reduction analysis identified 16 major immune clusters and three minor nonimmune clusters. (B) Proportion of individual clusters in each experimental group. (C) Dot plots of selected cluster-defining genes. (D) Feature plots of combined groups depicting single-cell mRNA expression of proinflammatory factors. (E) Dot plots showing differentially expressed cytokines and chemokines in T cell and myeloid clusters among experimental groups. (F) Expression module scores of Gene Ontology terms (inflammation, chemotaxis, innate immune response, and Th1 function) computed for the aggregated dataset of individual experimental groups. (G) Analysis of cytokine and chemokine receptor–ligand pairs across clusters of each experimental group. All shown interactions were statistically significant based on a permutation test. Arrows denote directionality from ligand to receptor. (H–J) Colonic LP immune cells were analyzed by multiparameter flow cytometry. (H) tSNE plots showing unsupervised analyses of merged live myeloid cells (CD11b+ or CD11c+) from the four experimental groups (left); tSNE plots of aggregated myeloid cells of individual experimental groups (right); n = 7 in each group. (I) tSNE plot showing prospective analyses of merged live lymphoid cells (CD90.2+ or CD19+) from colonic LP from the four experimental groups; n = 7 per group. (J) Absolute counts of neutrophils, monocytes, Th1, and Treg cells in colonic LP; n = 7 per group. Data shown as mean ± SEM. (H–J) Results from two independent experiments. Data were analyzed by one-way ANOVA (F and J). * P < 0.05, **** P < 0.0001.
Figure S2.
Figure S2.
Expression of pro-inflammatory factor mRNAs in colonic LP immune cells from mice on αCTLA-4 therapy. Colonic LP immune cells were subjected to scRNAseq as indicated in Fig. 2; n = 7–8 per group. (A) Feature plots of combined groups depicting single-cell mRNA expression of pro-inflammatory factors. (B) Dot plots showing differentially expressed cytokines across clusters and treatment groups. (C) Cytotoxic gene signature in T cells across different treatment groups.
Figure S3.
Figure S3.
Pathway analysis of colonic LP immune cells from mice on αCTLA-4 therapy. Colonic LP immune cells were subjected to scRNAseq as indicated in Fig. 2; n = 7–8 per group. (A) Expression module scores of Gene Ontology (GO) terms, computed for the aggregated dataset of individual groups. (B) Gene set activation score of myeloid (left) and T (right) cells in each experimental group computed by GSVA. (C) Analysis of cytokine and chemokine receptor–ligand pairs across clusters of each experimental group. All shown interactions were statistically significant based on a permutation test (Table S3). Arrows denote directionality from ligand to receptor.
Figure S4.
Figure S4.
Characterization of immune responses in mice on αCTLA-4 therapy. Stat3Δ/Δ and Stat3+/+ mice with B16-OVA tumors were treated biweekly for 2 wk with IgG or αCTLA-4. (A) Absolute numbers of colonic LP immune subsets; n = 7 per group. (B) Absolute numbers of mLN immune cell populations. For plots of viable cells and myeloid cells, n = 5–11 per group. For plots of lymphoid cells, n = 5–6 per group. (C) Mean fluorescence intensity (MFI) of MHC and co-stimulatory molecules on mLN DCs; n = 6–7 per group. (D) Absolute numbers of splenic immune cells; n = 11–12 per group. (E) Absolute numbers of neutrophils and monocytes in BM; n = 5 per group. (F) Absolute numbers of MPPs (multipotent progenitors), CLPs (common lymphoid progenitors) and MEPs (megakaryocyte-erythroid progenitors) in BM; n = 9–10 per group. (G) Absolute number of tumor-infiltrating B cells, DCs, neutrophils, and macrophages; n = 18–21 per group. Data shown as mean ± SEM. Results from two to five independent experiments. Data were analyzed by one-way ANOVA (D, F, and G). * P < 0.05, ** P < 0.01, *** P < 0.001, **** P < 0.0001.
Figure 3.
Figure 3.
Systemic cytokine release and myelopoiesis with αCTLA-4 therapy in inflammation-prone conditions. Stat3Δ/Δ and Stat3+/+ mice with B16-OVA tumors were treated biweekly for 2 wk with IgG or αCTLA-4. Serum cytokines and spleen and BM immune cells were analyzed 18–19 d after tumor establishment and completion of therapy. (A) Mean concentration of differently expressed cytokines in serum, determined by multiplex assays, fold change absolute log2 > 1; n = 13–17 per group. (B) Serum cytokines from individual mice analyzed by multiplex assays; n = 13–17 per group. (C) tSNE plot showing prospective clustering of live spleen cells merged from the four experimental groups (left); distribution of spleen immune cells, colored based on experimental groups (right); n = 6–7 in each group. (D) Neutrophil and monocyte amounts in spleen; n = 11–12 per group. (E) Representative flow plots showing CD34+ CD16/32 CMPs, CD34+ CD16/32+ GMPs, and CD34 CD16/32 MEPs (megakaryocyte-erythroid progenitors) gated from the lin Sca-1 CD117+ population. (F) Absolute amounts of HSCs, CMPs, GMPs in each experimental group; n = 9–10 per group. (G) Tumor size over time; n = 24–30 per group. (H) STAT3 expression in tumor-infiltrating DCs (CD11c+) or myeloid cells (CD11b+ CD11c) determined by immunoblotting. The filter was cut horizontally to separate differentially sized proteins and probed with antibodies to STAT3 or tubulin. The filters were reassembled according to the original gel orientation for each exposure time. (I) tSNE plots showing merged CD45+ CD3+ cells from the four experimental groups (left), and tSNE plots of aggregated CD45+ CD3+ cells of individual experimental groups (right); n = 6–8 per group. (J) Number of tumor-infiltrating CD8+ T cells, OVA-specific SIINFEKL/H-2Kb pentamer+ CD8+ T cells, CD4+ Foxp3 Teff cells, CD4+ Foxp3+ Treg, and CD8+/Treg ratios. For SIINFEKL/H-2Kb pentamer+ CD8+ T cells, n = 6–8 per group; for other plots, n = 18–21 per group. Data shown as mean ± SEM. Results from two to five independent experiments. Data were analyzed by one-way ANOVA (B, D, F, and J) or two-way ANOVA (G). * P < 0.05, ** P < 0.01, *** P < 0.001, **** P < 0.0001. Source data are available for this figure: SourceData F3.
Figure S5.
Figure S5.
Effects of neutrophil depletion, IL-6 blockade, antibiotics, or FMT from WT mice on αCTLA-4–associated toxicity. (A–E) Stat3Δ/Δ mice with B16-OVA tumors were treated biweekly for 2 wk with IgG or αCTLA-4; Ly6G or IL-6 antibodies (αLy6G or αIL-6, respectively) were injected 12 and 15 d after tumor establishment. Colon cytokines and immune subsets were analyzed 18 d after tumor establishment and completion of therapy. (A) Schematic diagram of experiment. (B) Tumor growth over time; n = 11–17 per group. (C) Differentially expressed cytokines in colon (i.e., cytokines with fold change <0.7 or >1.4); expression normalized to mean concentration in αCTLA-4–treated Stat3Δ/Δ mice; n = 8–14 per group. (D) Neutrophil and Th1 cell numbers in colonic LP; n = 4–6 per group. (E) Histopathology score; n = 5–11 per group. (F) Stat3Δ/Δ and Stat3+/+ mice with B16-OVA tumors were treated biweekly for 2 wk with IgG or αCTLA-4. Fecal samples were collected prior to (3 d) and following αCTLA-4 treatment (18 d); microbiome composition was characterized by 16S rRNA gene profiling, as described in Fig. 4. Composition plots representing relative abundance of microbial taxa (obtained from 16S rRNA gene profiling of the fecal samples) at the genus level. (G–K) Recipient Stat3Δ/Δ mice were given fecal transplantation from donor Stat3+/+ mice. Recipient Stat3Δ/Δ mice were injected with B16-OVA cells and treated with αCTLA-4 or IgG i.p. biweekly for 2 wk. Organ samples were collected 18 d after melanoma injection. (G) Representative photomicrographs of colonic mucosa, scale bar = 100 microns; H&E. (H) Summed scores for histopathology, neutrophil infiltrate, mixed inflammatory cell infiltrate, and crypt hyperplasia are shown; n = 6–7 per group. (I) Differentially expressed cytokines in colon (i.e., cytokines with fold change <0.7 or >1.4); n = 6–7 per group. (J) Absolute amounts of immune cells in colonic LP; n = 6–7 per group. (K) Tumor size over time; n = 6–7 per group. (L–O) Stat3Δ/Δ mice with B16-OVA tumors were treated biweekly for 2 wk with αCTLA-4. Mice received broad-spectrum antibiotics (metronidazole, ampicillin, vancomycin, and enrofloxacin; Abx) daily for 4 d prior to first αCTLA-4 injection. (L) Schematic diagram of experiment. (M) Tumor size over time; n = 11–16 per group. (N) Histopathology scores; n = 6 for each group. (O) Differentially expressed cytokines from colon (i.e., cytokines with fold change <0.7 or >1.4), normalized to mean concentration in αCTLA-4–treated Stat3Δ/Δ mice; n = 6 for each group. Data shown as mean ± SEM. Results from two to three independent experiments. Data were analyzed by two-way ANOVA (B), one-way ANOVA (D and E), statistical method implemented in the R package DESeq2 (F), two-tailed unpaired Student’s t test (H and J). * P < 0.05, ** P < 0.01, *** P < 0.001, **** P < 0.0001.
Figure 4.
Figure 4.
Dysbiosis and FMT induces sensitivity to αCTLA-4–mediated irAE. (A–C) Stat3Δ/Δ and Stat3+/+ mice with B16-OVA tumors were treated biweekly for 2 wk with IgG or αCTLA-4. Feces were collected prior to (day 3) or following αCTLA-4 treatment (day 18); fecal microbiome composition was determined by 16S rRNA gene profiling. (A) Box-and-whisker plot represents within-sample diversity using Inverse Simpson diversity scores of indicated mice and treatments groups; n = 13–14 per group. (B) Beta diversity analysis using Bray–Curtis dissimilarity compares between-sample diversity of the indicated groups. Based on PCA each of the fecal microbiome profiles are represented in terms of the top-two principal components; n = 13–14 per group. (C) Using microbial abundance data aggregated at the genus level, each of the three plot-pair shows significant differentially abundant taxa (P value <0.05) are associated with the indicated treatment groups. The bar plot shows the log-fold change, and the box-and-whisker plot shows the normalized abundance of the differentially abundant taxa identified using DESeq2; n = 13–14 per group. (D–I) Recipient Stat3+/+ mice were given fecal transplantation by feces suspension from donor Stat3Δ/Δ mice following microbiome depletion by broad spectrum antibiotics (metronidazole, ampicillin, vancomycin, and enrofloxacin; MAVE), then Stat3+/+ mice were injected with B16-OVA cells and treated with αCTLA-4 or IgG i.p. biweekly for 2 wk. Organ samples were collected 18 d after melanoma injection. (D) Schematic diagram of the experimental approach. (E) Tumor size over time; n = 7 per group. (F) Representative photomicrographs of colonic mucosa; scale bar = 100 microns; H&E. (G) Summed scores for histopathology, neutrophil infiltrate, mixed inflammatory cell infiltrate, and crypt hyperplasia are shown; n = 7 per group. (H) Absolute amounts of immune cells in colonic LP; n = 7 per group. (I) Differential cytokine amounts in colon tissue (n = 7 per group), fold change <0.7 or >1.4. Data shown as mean ± SEM. Results from two independent experiments. Data were analyzed by Wilcoxon Rank-Sum test (A), Bray–Curtis dissimilarity (B), statistical test implemented in the R package DESeq2 (C), two-tailed unpaired Student’s t test (G and H). * P < 0.05, ** P < 0.01, *** P < 0.001, **** P < 0.0001.
Figure 5.
Figure 5.
Combination treatment with αIL-6 and antibiotics enhances αCTLA-4 efficacy and reduces irAEs. Stat3Δ/Δ mice were given broad-spectrum Abx (metronidazole, ampicillin, vancomycin, and enrofloxacin; MAVE) by oral gavage for 4 d. B16-OVA tumors were established, and mice were maintained on ampicillin-containing drinking water until initiation of αCTLA-4 therapy. Mice were treated biweekly for 2 wk with αCTLA-4. αIL-6 was injected (i.p.) on day 5, 7, 9, and 11. (A) Schematic diagram of the experiment. (B) Tumor growth over time; n = 9–10 per group. (C) Numbers of tumor-infiltrating cDC1s, CD8+, and OVA-specific SIINFEKL/H-2Kb pentamer+ CD8+ T cells; n = 9–10 per group. (D) Representative photomicrographs of colonic mucosa; intense inflammatory (arrowheads) and neutrophil (arrow) infiltrate in the LP are indicated; scale bar = 500 μm for 40× magnification, 100 μm for 200× magnification; H&E. (E) Histopathology scores; n = 9–10 for each group. (F) Differentially expressed cytokines from colon (i.e., cytokines with fold change <0.7 or >1.4), normalized to mean concentration in αCTLA-4–treated Stat3Δ/Δ mice; n = 5 for each group. (G and H) Absolute amounts of immune cells in colonic LP (G) and mLN (H); n = 9–10 per group. (I) Box-and-whisker plot of within-sample diversity using Inverse Simpson diversity measure of indicated treatments groups. (J) Beta diversity analysis using Bray–Curtis dissimilarity compares between-sample diversity of the indicated groups. The ordination plot represents the microbiome profile of the samples in terms of the top-two PCs obtained from the principal coordinate; n = 7 per group. (K) Using microbial abundance data aggregated at the family level, the analysis (using R package DESeq2) identifies significant differentially abundant taxa (P < 0.05) associated with the indicated treatment groups. For the identified taxa, the bar plot (left) reports log-fold change and the box-and-whisker plot (right) compares the indicated two-treatment groups in terms of normalized abundance data; n = 7 per group. Data shown as mean ± SEM from two independent experiments. Data were analyzed by two-way ANOVA (B), two-tailed unpaired Student’s t test (C, E, G, and H), Bray–Curtis dissimilarity (J), statistical test implemented in the R package DESeq2 (K). * P < 0.05, ** P < 0.01, *** P < 0.001, **** P < 0.0001.
Figure 6.
Figure 6.
Disruption of gut homeostasis by acute intestinal infection associates with αCTLA-4–induced toxicity. C57BL/6J mice with B16-OVA tumors were treated biweekly for 2 wk with IgG or αCTLA-4. Mice were infected with 4–6 × 10⁹ C. rodentium on day 11 by oral gavage (C.r.) or remained uninfected (NI). Animals were euthanized 18 d after tumor establishment and completion of therapy. (A) Schematic diagram of experiment. (B) Body weight change over time; n = 2–5 per NI group, n = 11–12 per C.r. group. (C) Representative photomicrographs of proximal colonic mucosa. Note the intense inflammatory infiltrate in the LP (arrowheads), scale bar = 100 microns (upper panels); and neutrophil infiltrate (arrow) and C. rodentium load on colonic epithelium (arrowheads), scale bar = 20 microns (lower panels); H&E. (D) Histopathological scores of proximal colon at the experimental endpoint; n = 2–3 per NI group, n = 11–13 per C.r. group. (E) CFUs in spleen and liver as indicated; n = 2–3 per NI group, n = 16–20 per C.r. group. (F) Differential cytokine amounts in colon tissue (n = 2 per group) and serum (n = 10 for C.r. + IgG group, n = 11 for C.r. + αCTLA-4 group) as indicated, fold change absolute log 2 > 1. (G) Absolute amounts of immune cells in mLN and spleen as indicated; n = 6–8 per group. (H) Tumor size over time; n = 2–3 per NI group, n = 9–11 per C.r. group. Data shown as mean ± SEM, from four independent experiments. Data were analyzed by two-way ANOVA (B and H), one-way ANOVA (D), F test to compare variations (E), and two-tailed unpaired Student’s t test (G). * P < 0.05, ** P < 0.01, **** P < 0.0001.
Figure 7.
Figure 7.
Disruption of gut homeostasis by DSS associates with αCTLA-4–induced toxicity. C57BL/6J mice with B16-OVA tumors were treated biweekly for 2 wk with IgG or αCTLA-4. Mice were given 2.5% DSS in drinking water on day 11–15 after tumor establishment. Animals were euthanized 18 d after tumor establishment. (A) Schematic diagram of experiment. (B) Body weight change over time; n = 8 per group. (C) Histopathological scores of colon at the experimental endpoint; n = 8–9 per group. (D) Representative photomicrographs of colonic mucosa, scale bar = 100 microns; H&E. (E) Differential cytokine amounts in colon tissue, fold change absolute log 2 > 1; n = 8–9 per group. (F and G) Absolute amounts of immune cells in colon (F) and spleen (G) as indicated; n = 8–9 per group. (H) Tumor size over time; n = 8 per group. Data are shown as mean ± SEM, from two independent experiments. Data were analyzed by two-way ANOVA (B) and two-tailed unpaired Student’s t test (C, F and G). * P < 0.05, ** P < 0.01, *** P < 0.001, **** P < 0.0001.
Figure 8.
Figure 8.
Immune signatures and association with αCTLA-4 response of human intestinal irAE. (A–F) Colitis regions (n = 22, from 15 individuals with ICB-associated colitis) and normal intestinal biopsies (n = 26, from 19 individuals with colorectal carcinoma and 7 with ICB-associated colitis) were evaluated by NanoString using the human nCounter PanCancer Immune Profiling Panel of 770 cancer-related and immune response genes. (A) Estimation of immune subset abundance using expression of cell type–specific marker genes. Data represent relative abundance scores. (B) Data shown indicate raw cell type abundance scores of individual immune subsets. (C) PCA of all biopsies. (D) Volcano plot showing differential gene expression. Results are normalized to healthy tissue biopsy group. (E) Plot of pathway signature scores for colitis and normal biopsy samples. (F) Heatmaps showing gene expression in individual pathways and samples. (G and H) Staining density (G) and representative IHC images (H) from CD15, Foxp3, CD3, CD8, or CD4 detection in intestinal biopsies from melanoma patients with ICB-associated colitis; scale bar = 200 μm. Matched biopsies diagnosed as active colitis and without diagnostic abnormality from a total of eight patients were analyzed. (B and D) Two-tailed unpaired Student’s t test. * P < 0.05.

References

    1. Abu-Sbeih, H., Faleck D.M., Ricciuti B., Mendelsohn R.B., Naqash A.R., Cohen J.V., Sellers M.C., Balaji A., Ben-Betzalel G., Hajir I., et al. . 2020. Immune checkpoint inhibitor therapy in patients with preexisting Inflammatory Bowel Disease. J. Clin. Oncol. 38:576–583. 10.1200/JCO.19.01674 - DOI - PMC - PubMed
    1. Andrews, M.C., Duong C.P.M., Gopalakrishnan V., Iebba V., Chen W.S., Derosa L., Khan M.A.W., Cogdill A.P., White M.G., Wong M.C., et al. . 2021. Gut microbiota signatures are associated with toxicity to combined CTLA-4 and PD-1 blockade. Nat. Med. 27:1432–1441. 10.1038/s41591-021-01406-6 - DOI - PMC - PubMed
    1. Bamias, G., Delladetsima I., Perdiki M., Siakavellas S.I., Goukos D., Papatheodoridis G.V., Daikos G.L., and Gogas H.. 2017. Immunological characteristics of colitis associated with anti-CTLA-4 antibody therapy. Cancer Invest. 35:443–455. 10.1080/07357907.2017.1324032 - DOI - PubMed
    1. Bouladoux, N., Harrison O.J., and Belkaid Y.. 2017. The Mouse Model of infection with citrobacter rodentium. Curr. Protoc. Immunol. 119:19.15.11–19.15.25. 10.1002/cpim.34 - DOI - PMC - PubMed
    1. Bruewer, M., Luegering A., Kucharzik T., Parkos C.A., Madara J.L., Hopkins A.M., and Nusrat A.. 2003. Proinflammatory cytokines disrupt epithelial barrier function by apoptosis-independent mechanisms. J. Immunol. 171:6164–6172. 10.4049/jimmunol.171.11.6164 - DOI - PubMed

Publication types