. 2022 Nov 8;14(23):9579-9598.
doi: 10.18632/aging.204373. Epub 2022 Nov 8.

MAGE-A3 regulates tumor stemness in gastric cancer through the PI3K/AKT pathway

Affiliations

MAGE-A3 regulates tumor stemness in gastric cancer through the PI3K/AKT pathway

Qi-Ying Yu et al. Aging (Albany NY). .

Abstract

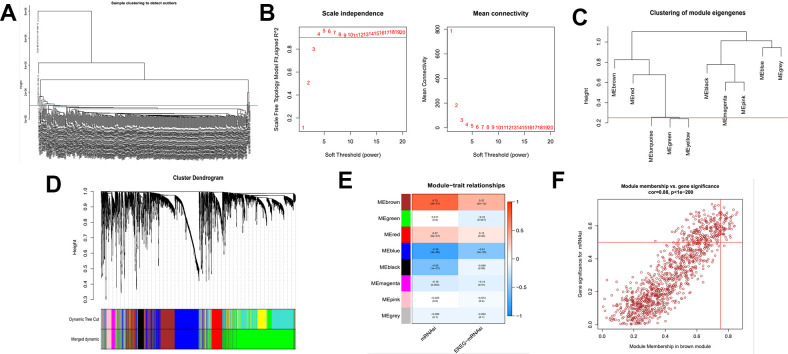
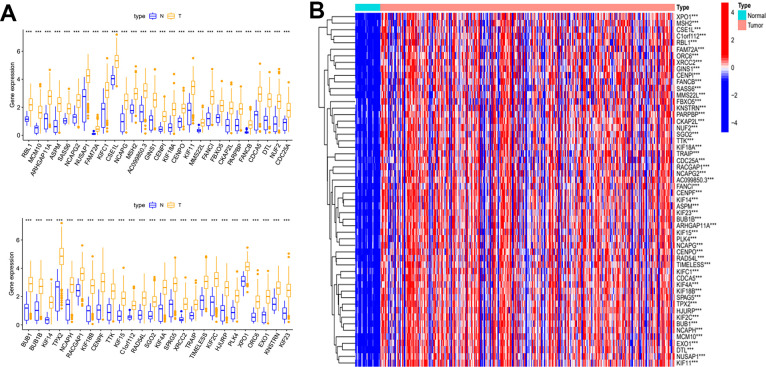
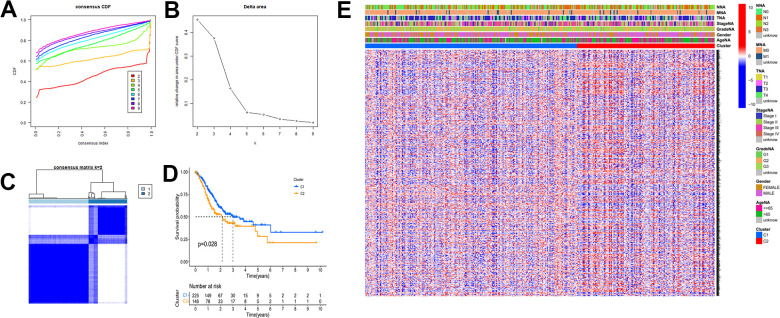
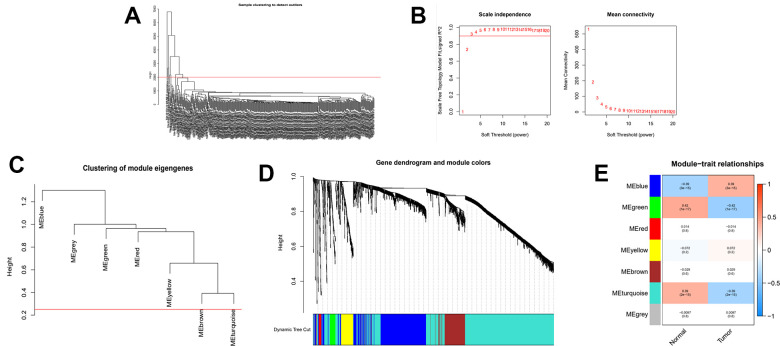
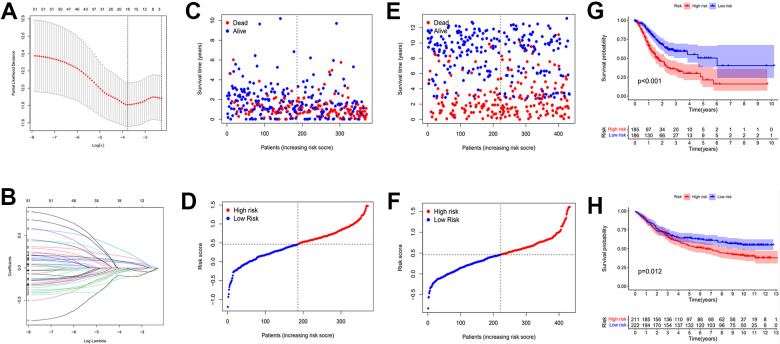
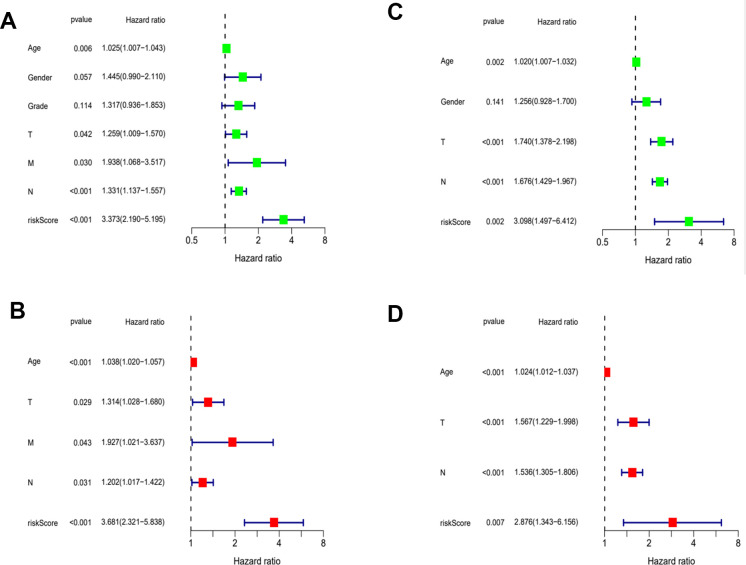
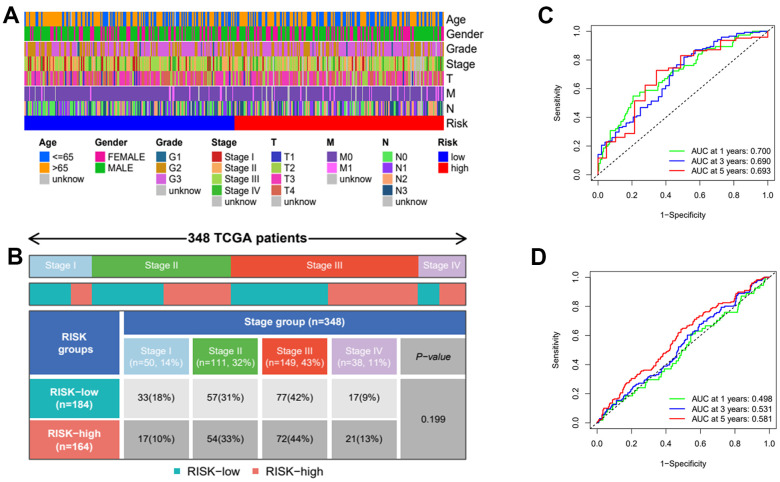
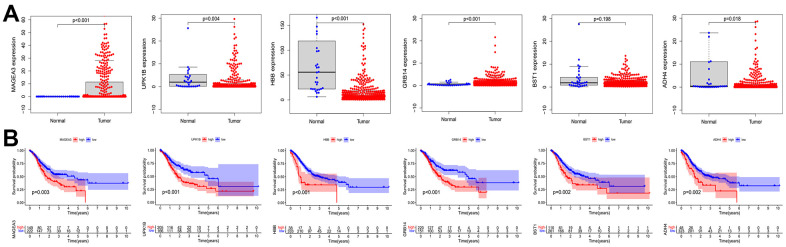
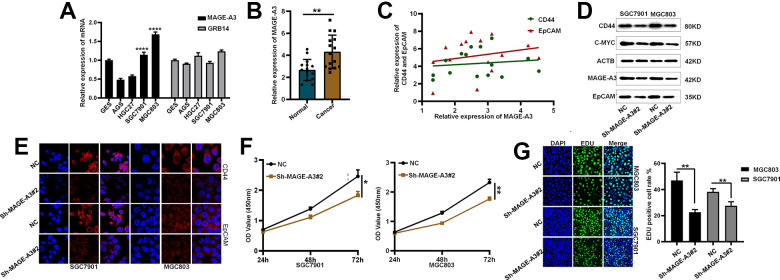
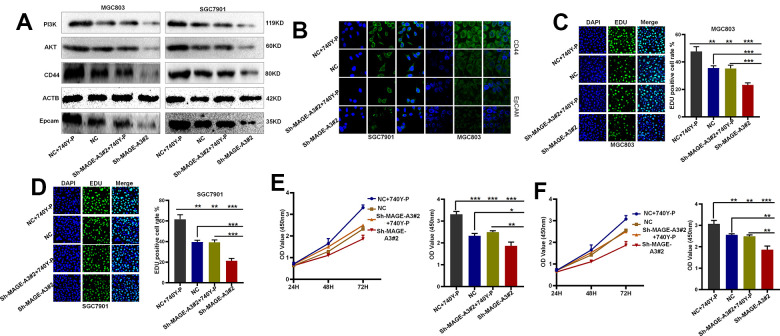
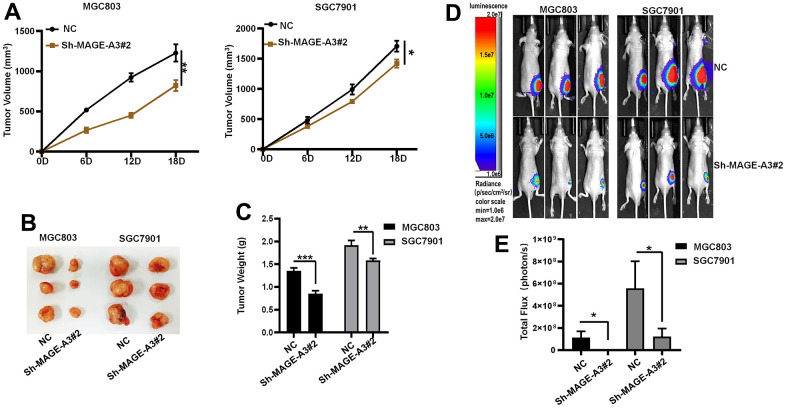
Gastric cancer remains a malignant disease of the digestive tract with high mortality and morbidity worldwide. However, due to its complex pathological mechanisms and lack of effective clinical therapies, the survival rate of patients after receiving treatment is not satisfactory. A increasing number of studies have focused on cancer stem cells and their regulatory properties. In this study, we first constructed a co-expression network based on the WGCNA algorithm to identify modules with different degrees of association with tumor stemness indices. After selecting the most positively correlated modules of the stemness index, we performed a consensus clustering analysis on gastric cancer samples and constructed the co-expression network again. We then selected the modules of interest and applied univariate COX regression analysis to the genes in this module for preliminary screening. The results of the screening were then used in LASSO regression analysis to construct a risk prognostic model and subsequently a sixteen-gene model was obtained. Finally, after verifying the accuracy of the module and screening for risk genes, we identified MAGE-A3 as the final study subject. We then performed in vivo and in vitro experiments to verify its effect on tumor stemness and tumour proliferation. Our data supports that MAGE-A3 is a tumor stemness regulator and a potent prognostic biomarker which can help the prediction and treatment of gastric cancer patients.

Keywords: MAGE-A3; WGCNA; gastric cancer; mRNAsi.


Conflict of interest statement

CONFLICTS OF INTEREST: The authors declare that they have no conflicts of interest.

Figures

Figure 1
Figure 1
Differences in mRNAsi and sample gene expression. (A) Differences in mRNAsi between normal and tumor tissues in gastric cancer. (B) Volcano map of differentially expressed genes. Green dots represent genes that are down-regulated, red dots represent genes that are up-regulated, and black dots represent no significant change. (C) The top 50 differentially expressed genes in GC cancer disease presented as a gene expression heat map. P<0.05. GC: gastric cancer.
Figure 2
Figure 2
Identification of cancer stem cell index-related modules by WGCNA. (A) Samples above the red line were removed because they were considered as the deflection of gene expression. (B) This represents the correlation coefficient R2 and mean connectivity in the scale-free network. (C) Calculate similarity between modules and merge modules with high similarity. (D) Hierarchical clustering of gene modules. (E) Heatmap of the correlationship between gene modules and cancer stemness index. (F) Scatter plot of maximum positive correlation with cancer stem cell index (mRNAsi).
Figure 3
Figure 3
Differential expression analysis of key genes. (A) Box plot of the difference in expression of key genes between tumour and normal tissue. (B) Key genes differential expression heatmap.
Figure 4
Figure 4
Key genes function enrichment analysis. (A, B) GO enrichment analysis of key genes. (C, D) KEGG enrichment analysis of key genes.
Figure 5
Figure 5
The mRNAsi-related key genes could classify GC into two groups by consensus clustering of TCGA dataset. (A) Cumulative distribution function (CDF) for k=2 to k=9. (B) Relative change in area under the CDF curve according to different k values. (C) Consensus clustering matrix of samples from TCGA dataset for k=2. (D) Survival analysis of patients in the C1 group and C2 group in TCGA cohort. (E) Heatmap of two clusters defined by the expression of mRNAsi-related key genes.
Figure 6
Figure 6
WGCNA analysis on the consensus clustering samples. (A) Samples above the red line were removed because they were considered as the deflection of gene expression. (B) This represents the correlation coefficient R2 and mean connectivity in the scale-free network. (C) Calculate similarity between modules and merge modules with high similarity. (D) Hierarchical clustering of gene modules. (E) Heatmap of the correlationship between gene modules and normal or cancer tissue.
Figure 7
Figure 7
Establishment of risk prognostic model. (A) Partial likelihood deviance was plotted versus log (Lambda). The vertical dotted line indicates the lambda value with the minimum error and the largest lambda value. (B) LASSO coefficient profiles of the genes screening by univariate Cox regression analysis. (C, D) The distributions of risk scores and OS status in TCGA. (E, F) The distributions of risk scores and OS status in GEO. (G) The patient samples from TCGA were divided into high and low risk groups based on risk score and the OS of the groups were analyzed using Kaplan-Meier. (H) OS analysis of high and low risk groups from the GEO samples. Red represents the high risk group and blue represents the low risk group. LASSO: least absolute shrinkage and selection operator. OS: overall survival.
Figure 8
Figure 8
Evaluation of risk model. (A) Univariate Cox analysis of risk score and clinical characteristics in TCGA. (B) Univariate Cox analysis in GEO. (C) Multivariate Cox analysis of risk score and clinical characteristics in TCGA. (D) Multivariate Cox analysis in GEO.
Figure 9
Figure 9
Clinical heatmap of risk scores and time-dependent ROC curve analysis. (A) Heatmap of risk scores under different clinical characteristics. (B) Distribution of high and low risk groups under different clinicopathological stages. (C) ROC curve analysis in TCGA. (D) ROC curve analysis in GEO.
Figure 10
Figure 10
Expression and prognostic role of OS positive-related genes. (A) Analysis of expression differences of OS positive-related genes. (B) Kaplan-Meier analysis of OS positive-related genes. OS: overall survival.
Figure 11
Figure 11
Validation of MAGE-A3’s regulation of tumor stemness and proliferative capacity in vitro. (A) Application of QPCR to compare MAGE-A3 and GRB14 mRNA expression in tumour cells and normal epithelial cells. (B) The expression of MAGE-A3 in cancer and adjacent tissues was detected by QPCR. (C) Relationship between the expression of CD44 and EpCAM and the expression of MAGE-A3. (D, E) Validation of protein expression levels of cancer stem cell biomarkers by western blot and immunofluorescence. (F, G) The effect of knocking down MAGE-A3 on cell proliferation ability was examined by CCK-8, EDU. (*P< 0.05; **P< 0.01; ***P< 0.001;****P< 0.0001).
Figure 12
Figure 12
MAGE-A3 regulates tumour stemness and proliferation through the PI3K/AKT pathway. (A, B) Western blot and cellular immunofluorescence techniques were used to detect the expression of PI3K/AKT and tumour stem cell protein biomarkers under different grouping treatments. (C, D) EDU assays were used to detect the proliferation ability of cells under different grouping treatments. (E, F) CCK-8 assays were used to detect the proliferation ability of cells under different grouping treatments.
Figure 13
Figure 13
Verifying the ability of MAGE-A3 to regulate tumors in vivo. (A) Tumor volume growth curves of control group and knockdown group. (B) Xenograft tumors of sacrificed mice at the experimental endpoint. (C) Tumor weights in control and knockdown groups. (D, E) Animal imaging technology to detect differences between control and knockdown groups. (*P< 0.05; **P< 0.01; ***P< 0.001;****P< 0.0001).

Similar articles

Cited by

References

    1. Sung H, Ferlay J, Siegel RL, Laversanne M, Soerjomataram I, Jemal A, Bray F. Global Cancer Statistics 2020: GLOBOCAN Estimates of Incidence and Mortality Worldwide for 36 Cancers in 185 Countries. CA Cancer J Clin. 2021; 71:209–49. 10.3322/caac.21660 - DOI - PubMed
    1. Ferlay J, Colombet M, Soerjomataram I, Mathers C, Parkin DM, Piñeros M, Znaor A, Bray F. Estimating the global cancer incidence and mortality in 2018: GLOBOCAN sources and methods. Int J Cancer. 2019; 144:1941–53. 10.1002/ijc.31937 - DOI - PubMed
    1. Tan Z. Recent Advances in the Surgical Treatment of Advanced Gastric Cancer: A Review. Med Sci Monit. 2019; 25:3537–41. 10.12659/MSM.916475 - DOI - PMC - PubMed
    1. Correa P. Gastric cancer: overview. Gastroenterol Clin North Am. 2013; 42:211–7. 10.1016/j.gtc.2013.01.002 - DOI - PMC - PubMed
    1. Otaegi-Ugartemendia M, Matheu A, Carrasco-Garcia E. Impact of Cancer Stem Cells on Therapy Resistance in Gastric Cancer. Cancers (Basel). 2022; 14:1457. 10.3390/cancers14061457 - DOI - PMC - PubMed

Publication types

MeSH terms

Substances