. 2022 Nov 11;8(45):eabo7956.
doi: 10.1126/sciadv.abo7956. Epub 2022 Nov 11.

AMPK-dependent phosphorylation of MTFR1L regulates mitochondrial morphology

Affiliations

AMPK-dependent phosphorylation of MTFR1L regulates mitochondrial morphology

Lisa Tilokani et al. Sci Adv. .

Abstract

Mitochondria are dynamic organelles that undergo membrane remodeling events in response to metabolic alterations to generate an adequate mitochondrial network. Here, we investigated the function of mitochondrial fission regulator 1-like protein (MTFR1L), an uncharacterized protein that has been identified in phosphoproteomic screens as a potential AMP-activated protein kinase (AMPK) substrate. We showed that MTFR1L is an outer mitochondrial membrane-localized protein modulating mitochondrial morphology. Loss of MTFR1L led to mitochondrial elongation associated with increased mitochondrial fusion events and levels of the mitochondrial fusion protein, optic atrophy 1. Mechanistically, we show that MTFR1L is phosphorylated by AMPK, which thereby controls the function of MTFR1L in regulating mitochondrial morphology both in mammalian cell lines and in murine cortical neurons in vivo. Furthermore, we demonstrate that MTFR1L is required for stress-induced AMPK-dependent mitochondrial fragmentation. Together, these findings identify MTFR1L as a critical mitochondrial protein transducing AMPK-dependent metabolic changes through regulation of mitochondrial dynamics.


Figures

Fig. 1.
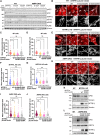
Fig. 1.. MTFR1L is a mitochondrial protein.
(A) Immunoblot analysis of subcellular fractionation showing MTFR1L localization in HeLa cells treated with nontargeted (NT) or MTFR1L siRNA. Total whole-cell (WC) lysates were fractionated into heavy membranes containing crude mitochondria (CM) and cytosolic (Cyt) fractions. Vinculin and VDAC1 were used as cytosolic and mitochondrial markers, respectively. (B) Representative confocal images of MTFR1L localization from U2OS cells silenced with NT or MTFR1L siRNAs. Mitochondria and MTFR1L were labeled using anti-TOM20 and anti-MTFR1L antibodies, respectively. Scale bar, 20 μm. (C) Proteinase K digestion assay on crude mitochondria isolated from HeLa cells. Crude mitochondrial fractions (CMFs) were treated with increasing concentrations of proteinase K and analyzed by immunoblot. Mfn2, AIF, Mic60, and MDH2 were used as OMM, intermembrane space, IMM, and matrix markers, respectively. (D) Sodium carbonate treatment of CMFs isolated from HeLa cells. Whole-cell (WC), crude mitochondria (CM), pellet (P), containing membrane inserted proteins, and supernatant (SN), containing soluble proteins, fractions were analyzed by immunoblot. Vinculin was used as a whole-cell marker, Mic60 and VDAC1 were used as controls for integral membrane proteins, whereas CytC was used as control for soluble proteins. (E) Immunoblot analysis of MTFR1L expression in different wild-type (WT) mouse tissues. Vinculin and GRP75 were used as loading controls. Two different time exposures are represented for MTFR1L, low and high. MTFR1L was detected using the Atlas antibody (HPA027124). See also fig. S1.
Fig. 2.
Fig. 2.. Loss of MTFR1L leads to mitochondrial elongation.
(A) Representative confocal images of mitochondrial morphology from WT and MTFR1L KO U2OS cells. Mitochondria were labeled with an anti-TOM20 antibody. Scale bar, 20 μm. (B) Immunoblot analysis of MTFR1L levels in MTFR1L KO U2OS clones. Vinculin and HSP60 were used as loading controls. (C) Quantification of mitochondrial morphology from (A). (D to F) Mitochondrial morphology was quantified as (D) mitochondrial number, (E) mean mitochondrial area, and (F) number of junctions, per ROI. (G) Live-cell imaging of WT and MTFR1L KO U2OS cells overexpressing the ornithine carbamoyl transferase (OCT)–photoactivable GFP (mt-PAGFP) probe and the mitochondrial marker TOM20-mCherry. Scale bar, 10 μm. (H) Quantification of the OCT-PAGFP probe diffusion from (G), calculated as a ratio between OCT-PAGFP–occupied area on total mitochondria network (TOM20-mCherry) at 0 and 5 min. (I) Representative TEM images from WT and MTFR1L KO U2OS cells. Scale bar, 1 μm. (J) Quantification of TEM images showing the distribution of mitochondrial length from (I). (K) Representative confocal images of mitochondrial morphology of WT and MTFR1L KO U2OS cells transiently overexpressing P2A-mCherry alone or MTFR1L-P2A-mCherry. Mitochondria were labeled with an anti-TOM20 antibody. Scale bar, 20 μm. (L) Quantification of mitochondrial morphology from (K). All values: mean ± SD; at least three independent experiments. See also figs. S2 and S3.
Fig. 3.
Fig. 3.. Mitochondrial elongation induced by MTFR1L loss is due to increased mitochondrial fusion.
(A and B) Immunoblots of proteins related to mitochondrial (A) division and (B) fusion, from WT and MTFR1L KO U2OS cells. Vinculin, β-actin, ATP5a, and GRP75 were used as loading controls. (C) Immunoblots of OPA1 oligomers from WT and MTFR1L KO U2OS cells treated with dimethyl sulfoxide (DMSO) or cross-linker 1,6-bismaleimidohexane (BMH). Tubulin and SDHB were used as loading controls. (D) Immunoblots of OPA1 levels from WT and MTFR1L KO U2OS cells transiently overexpressing empty vector pcDNA 3+ (−) and pcDNA 3-MTFR1L (+). Vinculin and GRP75 were used as loading controls. (E) Quantification of mitochondrial fusion and division events from WT and MTFR1L KO U2OS cells transiently overexpressing the mitochondrial marker GFP-OMP25. Representative quantification of the ratio between fusion and fission events per 625-μm2 ROI over a 5-min period is shown as a scatterplot. (F) Representative confocal images of WT and MTFR1L KO U2OS cells silenced with indicated siRNAs. Mitochondria were labeled using an anti-TOM20 antibody. (G) Quantification of mitochondrial morphology from (F). (H and I) Mitochondrial morphology was quantified as (H) mitochondrial number and (I) mean mitochondrial area, per ROI. (J) Representative confocal images of WT and MTFR1L KO U2OS cells silenced with indicated siRNAs. Mitochondria were labeled using an anti-TOM20 antibody. (K) Quantification of mitochondrial morphology from (J). (L and M) Mitochondrial morphology was quantified as (L) mitochondrial number and (M) mean mitochondrial area, per ROI. All scale bars, 20 μm. All values: mean ± SD; at least three independent experiments. See also figs. S4 to S8.
Fig. 4.
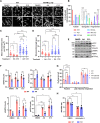
Fig. 4.. AMPK-dependent phosphorylation of MTFR1L controls mitochondrial morphology.
(A) Immunoblot analysis of indicated proteins and of MTFR1L phosphorylation in WT and AMPK-α1−/−-α2−/− DKO U2OS cells, transiently overexpressing FLAG-WT MTFR1LWT, FLAG-MTFR1LS103A, or FLAG-MTFR1LS238A phosphomutants, and treated with DMSO (−) or AMPK activator, A769662 (+), for 1 hour at 200 μM. Specific rabbit anti-MTFR1L phosphospecific antibodies were used to detect the two distinct phosphorylations at Ser103 and Ser238. Anti-FLAG was used to confirm overexpression of the different constructs, and β-actin was used as a loading control. Samples from two different experiments were loaded side by side. (B, E, and H) Representative confocal images of (B) WT, (E) MTFR1L KO, and (H) AMPK-α1α2 DKO U2OS cells stably expressing P2A-mCherry alone (−), MTFR1LWT-P2A-mCherry, double phosphomimetic MTFR1LS103D/S238D-P2A-mCherry, or double phosphomutant MTFR1LS103A/S238A-P2A-mCherry. Mitochondria were labeled with an anti-TOM20 antibody. (C, D, F, G, I, and J) Mitochondrial morphology was quantified as (C, F, and I) mean mitochondrial area and (D, G, and J) mitochondrial length, per ROI from (B), (E), and (H). (K) Immunoblots of OPA1 levels from WT and MTFR1L KO U2OS cells stably expressing P2A-mCherry vector alone (−), MTFR1LWT-P2A-mCherry, or MTFR1LS103A/S238A-P2A-mCherry. Vinculin was used as loading control. (L) Immunoblots of OPA1 levels from WT and AMPK-α1α2 DKO U2OS cells transiently expressing P2A-mCherry vector alone (−), MTFR1LS103D/S238D-P2A-mCherry, or MTFR1LS103A/S238A-P2A-mCherry. GRP75 and TOM20 were used as loading controls. All scale bars, 20 μm. All values: mean ± SD; at least three independent experiments. See also fig. S9.
Fig. 5.
Fig. 5.. MTFR1L is required for AMPK-driven mitochondrial fragmentation.
(A) Representative confocal images of WT and MTFR1L KO U2OS cells treated with DMSO, 10 μM antimycin A (AA), or the allosteric AMPK activator C13 for 1 hour. Mitochondria were labeled with an anti-TOM20 antibody. Scale bar, 20 μm. (B) Quantification of mitochondrial morphology from (A). (C and D) Mitochondrial morphology was quantified as (C) mean mitochondrial area and (D) mitochondrial length, per ROI. (E) Immunoblot analysis of indicated proteins corresponding to (A) showing AMPK activation in WT and MTFR1L KO U2OS cells, treated with DMSO, 10 μM antimycin A (AA), or the allosteric AMPK activator C13 for 1 hour. Vinculin was used as a loading control. (F) Quantification of levels of the indicated proteins from (E). Signal intensities were quantified by densitometry and normalized to loading controls. N = 3 independent experiments. (G) High-resolution respirometry analyses performed in intact WT and MTFR1L KO U2OS cells using Oroboros instrument. ROUTINE: cellular basal oxygen consumption rate (pmol O2/s) per million cells in supplemented medium or lacking glucose (starved for 4 hours). Leak is the nonphosphorylating respiration in the presence of ATP synthase inhibitor oligomycin. ETS: maximal respiration rate in the presence of the uncoupler CCCP. N = 3 independent experiments. (H) Quantification of the ATP/ADP ratio determined by bioluminescence assay from WT and MTFR1L KO U2OS cells treated with DMSO or antimycin A. N = 3 independent experiments. All values: mean ± SD or SEM; at least three independent experiments. See also figs. S10 and S11.
Fig. 6.
Fig. 6.. Knockdown of MTFR1L in mouse cortical PNs leads to elongated mitochondria and increased mitochondrial density in the axon.
(A) Representative confocal images of axons from small hairpin (sh) nontargeted (shNT) or MTFR1L (shMTFR1L) expressing layer 2/3 PNs at 14 days in vitro (DIV). Axonal mitochondrial morphology was visualized by cortical ex utero electroporation of a combination of (i) genetically encoded mitochondrial markers: OMM-targeted mCherry (ActA-mCherry), matrix-targeted mtagBFP2 (mito-mTagBFP2), or matrix-targeted YFP (mito-YFP), (ii) cytoplasmic filler tdTomato or mtagBFP2, and (iii) either control shNT or shMTFR1L. Individual E15.5 brains electroporated were dissociated and cocultured. (B to D) Mitochondrial morphology was quantified from (A) as (B) mean mitochondrial length, (C) cumulative mitochondrial length, and (D) mitochondrial occupancy in the axons measured by the cumulative mitochondrial length in an axonal segment divided by the total segment length. (E) Representative confocal images of shMTFR1L-expressing DIV14 axons electroporated with mito-mTagBFP2 and tdTomato, and overexpressing either WT-MTFR1LWT or double phosphomutant MTFR1LS103D/S238D. (F to H) Mitochondrial morphology was quantified from (E) as (F) mean mitochondrial length, (G) cumulative mitochondrial length, and (H) mitochondrial occupancy in the axons. (I) Representative confocal images of contralateral axonal projections from shNT- or shMTFR1L-treated layer 2/3 PNs at postnatal day 21 (P21). Axonal mitochondrial morphology was visualized by cortical in utero electroporation of mito-YFP and tdTomato together with shNT or mitochondrial matrix (matrix-DsRed) probe and cytoplasmic filler Venus together with shMTFR1L. (J to L) Mitochondrial morphology was quantified from (I) as (J) mean mitochondrial length, (K) cumulative mitochondrial length, and (L) mitochondrial occupancy in the axons. All scale bars, 10 μm. All values: mean ± SD; at least three independent experiments. See also figs. S12 and S13.

References

    1. Tilokani L., Nagashima S., Paupe V., Prudent J., Mitochondrial dynamics: Overview of molecular mechanisms. Essays Biochem. 62, 341–360 (2018). - PMC - PubMed
    1. Wai T., Langer T., Mitochondrial dynamics and metabolic regulation. Trends Endocrinol. Metab. 27, 105–117 (2016). - PubMed
    1. Tabara L. C., Morris J. L., Prudent J., The complex dance of organelles during mitochondrial division. Trends Cell Biol. 31, 241–253 (2021). - PubMed
    1. Kraus F., Roy K., Pucadyil T. J., Ryan M. T., Function and regulation of the divisome for mitochondrial fission. Nature 590, 57–66 (2021). - PubMed
    1. Giacomello M., Pyakurel A., Glytsou C., Scorrano L., The cell biology of mitochondrial membrane dynamics. Nat. Rev. Mol. Cell Biol. 21, 204–224 (2020). - PubMed

Substances