. 2023 Jan 3;11(1):4-12.
doi: 10.1158/2326-6066.CIR-22-0379.

Radiofrequency Ablation Remodels the Tumor Microenvironment and Promotes Neutrophil-Mediated Abscopal Immunomodulation in Pancreatic Cancer

Affiliations

Radiofrequency Ablation Remodels the Tumor Microenvironment and Promotes Neutrophil-Mediated Abscopal Immunomodulation in Pancreatic Cancer

Erika Y Faraoni et al. Cancer Immunol Res. .

Abstract

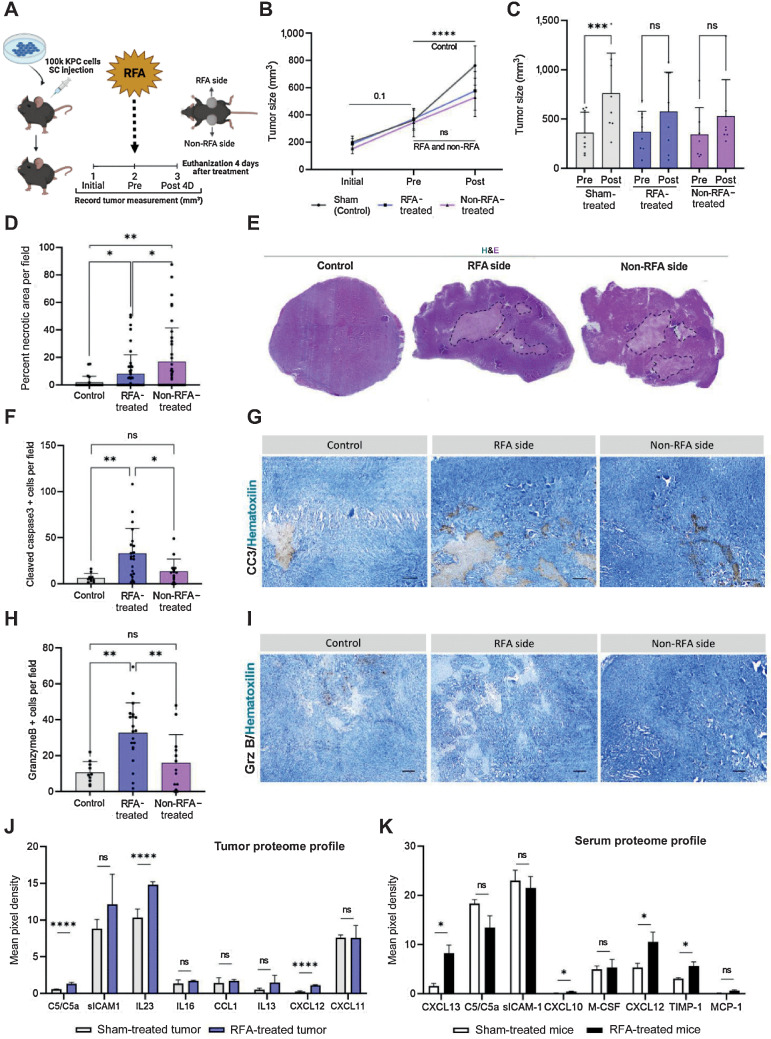
Pancreatic ductal adenocarcinoma (PDAC) presents a 5-year overall survival rate of 11%, despite efforts to improve clinical outcomes in the past two decades. Therapeutic resistance is a hallmark of this disease, due to its dense and suppressive tumor microenvironment (TME). Endoscopic ultrasound-guided radiofrequency ablation (EUS-RFA) is a promising local ablative and potential immunomodulatory therapy for PDAC. In this study, we performed RFA in a preclinical tumor-bearing KrasG12D; Trp53R172H/+; Pdx1:Cre (KPC) syngeneic model, analyzed local and abscopal affects after RFA and compared our findings with resected PDAC specimens. We found that RFA reduced PDAC tumor progression in vivo and promoted strong TME remodeling. In addition, we discovered tumor-infiltrating neutrophils determined abscopal effects. Using imaging mass cytometry, we showed that RFA elevated dendritic cell numbers in RFA-treated tumors and promoted a significant CD4+ and CD8+ T-cell abscopal response. In addition, RFA elevated levels of programmed death-ligand 1 (PD-L1) and checkpoint blockade inhibition targeting PD-L1 sustained tumor growth reduction in the context of RFA. This study indicates RFA treatment, which has been shown to increase tumor antigen shedding, promotes antitumor immunity. This is critical in PDAC where recent clinical immunotherapy trials have not resulted in substantial changes in overall survival.


Figures

Figure 1. RFA reduces PDAC tumor progression in vivo and increases pro-inflammatory mediators. Tumor size was recorded 4 days before (Initial), right before (Pre) and 4 days after (Post) Sham or RFA treatment. Proteome arrays were performed in locally ablated tumors and serum of ablated mice and compared with Sham-treated mice (Control). A, Experimental design of RFA-treated mice. B, Growth curves show Control tumors (n = 8) significantly increased in size 4 days after treatment when compared with RFA-treated (n = 8) and non-RFA–treated (n = 7) tumors. C, At the time of euthanization only Sham-treated tumors (n = 8) had significantly increased in size compared with pretreatment size; no difference in size was observed in RFA-treated (n = 8) and non-RFA–treated (n = 7) tumors pre- and post-RFA. D, ImageJ quantification of necrosis, which was detected by H&E staining. RFA significantly increased necrosis on the RFA- and non-RFA–treated tumors compared with control Sham-treated tumors. E, Representative composite H&E staining of control, RFA, and non-RFA–treated tumors showing necrotic areas inside dashed lines. F, ImageJ quantification showing RFA increased cleaved caspase 3+ cells in the RFA-treated and non-RFA–treated tumors compared with control Sham-treated control tumors, as assessed by IHC. G, Representative IHC staining for cleaved caspase 3 in control, RFA-treated, and non-RFA–treated tumors. H, ImageJ quantification revealed RFA significantly increased the number of granzyme B+ cells in the RFA-treated tumors compared with controls and non-RFA–treated tumors, as assessed by IHC. I, IHC staining for granzyme B in control, RFA-treated, and non-RFA–treated tumors. J, RFA-treated tumors (n = 3) presented increased expression of C5/C5a, IL23, and CXCL12 compared with control (n = 2) tumor content. K, CXCL10, CXCL12, CXCL13, and TIMP-1 were significantly elevated in serum from RFA-treated (n = 4) mice compared with Sham-treated (n = 3) control serum. Time x Treatment comparisons were performed using two-way ANOVA, treatment only comparisons by One-way ANOVA and proteome arrays were analyzed by multiple t tests. Bar plots showing mean with SEM were used to represent data. *, P ≤ 0.05; **, P ≤ 0.01; ***, P ≤ 0.001; ****, P ≤ 0.0001; n.s., not significant. Scale bars are 50 μmol/L.
Figure 1.
RFA reduces PDAC tumor progression in vivo and increases pro-inflammatory mediators. Tumor size was recorded 4 days before (Initial), right before (Pre) and 4 days after (Post) sham or RFA treatment. Proteome arrays were performed in locally ablated tumors and serum of ablated mice and compared with Sham-treated mice (Control). A, Experimental design of RFA-treated mice. B, Growth curves show control tumors (n = 8) significantly increased in size 4 days after treatment when compared with RFA-treated (n = 8) and non-RFA–treated (n = 7) tumors. C, At the time of euthanization only sham-treated tumors (n = 8) had significantly increased in size compared with pretreatment size; no difference in size was observed in RFA-treated (n = 8) and non-RFA–treated (n = 7) tumors pre- and post-RFA. D, ImageJ quantification of necrosis, which was detected by H&E staining. RFA significantly increased necrosis on the RFA- and non-RFA–treated tumors compared with control Sham-treated tumors. E, Representative composite H&E staining of control, RFA, and non-RFA–treated tumors showing necrotic areas inside dashed lines. F, ImageJ quantification showing RFA increased cleaved caspase 3+ cells in the RFA-treated and non-RFA–treated tumors compared with control sham-treated control tumors, as assessed by IHC. G, Representative IHC staining for cleaved caspase 3 in control, RFA-treated, and non-RFA–treated tumors. H, ImageJ quantification revealed RFA significantly increased the number of granzyme B+ cells in the RFA-treated tumors compared with controls and non-RFA–treated tumors, as assessed by IHC. I, IHC staining for granzyme B in control, RFA-treated, and non-RFA–treated tumors. J, RFA-treated tumors (n = 3) presented increased expression of C5/C5a, IL23, and CXCL12 compared with control (n = 2) tumor content. K, CXCL10, CXCL12, CXCL13, and TIMP-1 were significantly elevated in serum from RFA-treated (n = 4) mice compared with sham-treated (n = 3) control serum. Time x Treatment comparisons were performed using two-way ANOVA, treatment only comparisons by one-way ANOVA and proteome arrays were analyzed by multiple t tests. Bar plots showing mean with SEM were used to represent data. *, P ≤ 0.05; **, P ≤ 0.01; ***, P ≤ 0.001; ****, P ≤ 0.0001; n.s., not significant. Scale bars are 50 μm.
Figure 2. RFA increases neutrophil infiltration and induces systemic TME remodeling. A, Neutrophil abundance in tumors 4 days after Sham or RFA treatment was quantified by IHC staining for NIMPR14 as number of neutrophils per field using ImageJ software. RFA and non-RFA–treated tumors presented an increased neutrophil IHC staining (B) compared with control tumors. C, MPO IHC staining was used to quantify antitumor neutrophil abundance in tumors 4 days after Sham or RFA treatment. MPO was significantly abundant only in non-RFA–treated tumors as shown in areas with high density of neutrophils (D, black arrows) indicating a prominent antitumor neutrophil response post-RFA. E and F, αSMA IHC staining was increased in non-RFA–treated tumors compared with both Sham- and RFA-treated tumors. G and H, Collagen deposition was increased in RFA-treated and non-RFA–treated tumors compared with controls. I and J, CD31+ cells were increased after RFA ablation in both RFA and non-RFA–treated tumors compared with control tumors. Data was analyzed by One-way ANOVA. Bar plot graphs show mean with SEM. *, P ≤ 0.05; **, P ≤ 0.01; ***, P ≤ 0.001; ****, P ≤ 0.0001; n.s., not significant. Scale bars are 50 μmol/L.
Figure 2.
RFA increases neutrophil infiltration and induces systemic TME remodeling. A, Neutrophil abundance in tumors 4 days after sham or RFA treatment was quantified by IHC staining for NIMPR14 as number of neutrophils per field using ImageJ software. RFA and non-RFA–treated tumors presented an increased neutrophil IHC staining (B) compared with control tumors. C, MPO IHC staining was used to quantify antitumor neutrophil abundance in tumors 4 days after sham or RFA treatment. MPO was significantly abundant only in non-RFA–treated tumors as shown in areas with high density of neutrophils (D, black arrows) indicating a prominent antitumor neutrophil response post-RFA. E and F, αSMA IHC staining was increased in non-RFA–treated tumors compared with both sham- and RFA-treated tumors. G and H, Collagen deposition was increased in RFA-treated and non-RFA–treated tumors compared with controls. I and J, CD31+ cells were increased after RFA ablation in both RFA and non-RFA–treated tumors compared with control tumors. Data was analyzed by one-way ANOVA. Bar plot graphs show mean with SEM. *, P ≤ 0.05; **, P ≤ 0.01; ***, P ≤ 0.001; ****, P ≤ 0.0001; n.s., not significant. Scale bars are 50 μm.
Figure 3. Neutrophils are critical for the antitumor response on the abscopal tumor. A and B, IMC analysis of tumors 4 days after Sham or RFA treatment revealed Ly6G+CD11b+CD44+ neutrophils are enriched in non-RFA–treated tumors. C, Neighborhood analysis identified immune cells and markers with strong neutrophil co-localization. D, Cluster and Cell Phenotype information of Neighborhood analysis of IMC data. E, Experimental design for ND in vivo followed by RFA. F, RFA locally ablated tumors treated with IgG2a isotype control (VEH, n = 6) or anti-Ly6G (ND, n = 8) did not show differences in tumor size right before (Pre) and 4 days after (Post) RFA ablation. In non-RFA–treated tumors, anti-Ly6G (ND, n = 8) treatment revealed an increase in tumor size post-RFA treatment when compared with IgG2a isotype control (VEH, n = 6) treated tumors. G, ND (anti-Ly6G–treated group) did not alter αSMA staining, detected by IHC, in RFA-treated tumors when compared with RFA-treated tumors with IgG2a (VEH); on the contrary, ND revealed non-RFA–treated tumors presented a significant increase in αSMA compared with control non-neutrophil depleted (VEH) group. H, ND did not alter CD31 staining, detected by IHC, in any of the groups. I, Neutrophil-depleted RFA-treated tumors presented a significant reduction in CXCL13 content compared with both VEH + RFA and non-RFA–vtreated tumors when assayed using a cytokine array. No differences were found in non-RFA–treated tumors between treatments. J, ND presented a trend in reducing systemic CXCL13 levels in RFA-treated mice. Tumor volume was analyzed by paired Student t test. Tumor chemokine levels were studied by two-way ANOVA. IHC and serum protein expression levels were analyzed by unpaired Student t test. Bar plots indicate mean with SEM. *, P ≤ 0.05; **, P ≤ 0.01; ****, P ≤ 0.0001; n.s., not significant.
Figure 3.
Neutrophils are critical for the antitumor response on the abscopal tumor. A and B, IMC analysis of tumors 4 days after Sham or RFA treatment revealed Ly6G+CD11b+CD44+ neutrophils are enriched in non-RFA–treated tumors. C, Neighborhood analysis identified immune cells and markers with strong neutrophil co-localization. D, Cluster and cell phenotype information of neighborhood analysis of IMC data. E, Experimental design for ND in vivo followed by RFA. F, RFA locally ablated tumors treated with IgG2a isotype control (VEH, n = 6) or anti-Ly6G (ND, n = 8) did not show differences in tumor size right before (Pre) and 4 days after (Post) RFA ablation. In non-RFA–treated tumors, anti-Ly6G (ND, n = 8) treatment revealed an increase in tumor size post RFA treatment when compared with IgG2a isotype control (VEH, n = 6) treated tumors. G, ND (anti-Ly6G–treated group) did not alter αSMA staining, detected by IHC, in RFA-treated tumors when compared with RFA-treated tumors with IgG2a (VEH); on the contrary, ND revealed non-RFA–treated tumors presented a significant increase in αSMA compared with control non-neutrophil depleted (VEH) group. H, ND did not alter CD31 staining, detected by IHC, in any of the groups. I, Neutrophil-depleted RFA-treated tumors presented a significant reduction in CXCL13 content compared with both VEH + RFA and non-RFA–vtreated tumors when assayed using a cytokine array. No differences were found in non-RFA–treated tumors between treatments. J, ND presented a trend in reducing systemic CXCL13 levels in RFA-treated mice. Tumor volume was analyzed by paired Student t test. Tumor chemokine levels were studied by two-way ANOVA. IHC and serum protein expression levels were analyzed by unpaired Student t test. Bar plots indicate mean with SEM. *, P ≤ 0.05; **, P ≤ 0.01; ****, P ≤ 0.0001; n.s., not significant.
Figure 4. In vivo ICB therapy targeting RFA-induced PD-L1 in combination with RFA sustains tumor progression inhibition. A, Sham-treated tumors (n = 5) continued to grow throughout the study. RFA treatment (n = 6) inhibited tumor growth progression 4 days after treatment (Post 4D); however, 7 days after RFA (Post 7D), the growth restraining capacity was not as prominent. B, TSNE plots for IMC analysis of Sham, RFA or non-RFA–treated tumors at Post 4D. C, Cluster and cell phenotype information of TNE plots and Neighborhood analysis of IMC data. D, Cluster cell density of IMC data showed dendritic cells (Cluster 3; CD11b+CD11c+) were significantly elevated in RFA-treated tumors compared with Sham and non-RFA–treated tumors. MDSCs (Cluster 2; CD11b+Ly6C+) were significantly decreased in both RFA and non-RFA tumors compared with Sham. CD4+ and CD8α+ T cells were both significantly increased in non-RFA tumors compared with RFA (Cluster 10; CD4+) or RFA and Sham (Cluster 13; CD8α+). E, IMC analysis revealed RFA-treated tumors significantly increased cluster cell density levels of PD-L1 compared with Sham tumors (Cluster 16). F, Neighborhood analysis determined PD-L1 spatially localized closely with PanCK+ and PanCK+αSMA+ cells (Clusters 22 and 23) in RFA and non-RFA tumors. G, Experimental design of in vivo RFA + anti–PD-L1 ICB combination therapy. H, In vivo RFA + anti–PD-L1 combination therapy (n = 6) restrained tumor growth on both the RFA and non-RFA tumors 7 days after RFA (Post 7D) and continued to restrain the growth tumors compared with mice treated with an isotype control antibody (n = 7) up to 10 days (Post 10D) after RFA. Data was analyzed by Two-way ANOVA and represented by bar plots with mean and SEM. *, P ≤ 0.05; **, P ≤ 0.01; ***, P ≤ 0.001; ****, P ≤ 0.0001; n.s., not significant.
Figure 4.
In vivo ICB therapy targeting RFA-induced PD-L1 in combination with RFA sustains tumor progression inhibition. A, Sham-treated tumors (n = 5) continued to grow throughout the study. RFA treatment (n = 6) inhibited tumor growth progression 4 days after treatment (Post 4D); however, 7 days after RFA (Post 7D), the growth restraining capacity was not as prominent. B, TSNE plots for IMC analysis of sham, RFA or non-RFA–treated tumors at Post 4D. C, Cluster and cell phenotype information of TNE plots and neighborhood analysis of IMC data. D, Cluster cell density of IMC data showed dendritic cells (Cluster 3; CD11b+CD11c+) were significantly elevated in RFA-treated tumors compared with Sham and non-RFA–treated tumors. MDSCs (Cluster 2; CD11b+Ly6C+) were significantly decreased in both RFA and non-RFA tumors compared with Sham. CD4+ and CD8α+ T cells were both significantly increased in non-RFA tumors compared with RFA (Cluster 10; CD4+) or RFA and sham (Cluster 13; CD8α+). E, IMC analysis revealed RFA-treated tumors significantly increased cluster cell density levels of PD-L1 compared with sham tumors (Cluster 16). F, Neighborhood analysis determined PD-L1 spatially localized closely with PanCK+ and PanCK+αSMA+ cells (Clusters 22 and 23) in RFA and non-RFA tumors. G, Experimental design of in vivo RFA + anti–PD-L1 ICB combination therapy. H,In vivo RFA + anti–PD-L1 combination therapy (n = 6) restrained tumor growth on both the RFA and non-RFA tumors 7 days after RFA (Post 7D) and continued to restrain the growth tumors compared with mice treated with an isotype control antibody (n = 7) up to 10 days (Post 10D) after RFA. Data was analyzed by two-way ANOVA and represented by bar plots with mean and SEM. *, P ≤ 0.05; **, P ≤ 0.01; ***, P ≤ 0.001; ****, P ≤ 0.0001; n.s., not significant.

References

    1. Rahib L, Smith BD, Aizenberg R, Rosenzweig AB, Fleshman JM, Matrisian LM. Projecting cancer incidence and deaths to 2030: the unexpected burden of thyroid, liver, and pancreas cancers in the United States. Cancer Res 2014;74:2913–21. - PubMed
    1. Hosein AN, Brekken RA, Maitra A. Pancreatic cancer stroma: an update on therapeutic targeting strategies. Nat Rev Gastroenterol Hepatol 2020;17:487–505. - PMC - PubMed
    1. Navaneethan U, Thosani N, Goodman A, Manfredi M, Pannala R, Parsi MA, et al. . Radiofrequency ablation devices. VideoGIE 2017;2:252–9. - PMC - PubMed
    1. Yousaf MN, Ehsan H, Muneeb A, Wahab A, Sana MK, Neupane K, et al. . Role of radiofrequency ablation in the management of unresectable pancreatic cancer. Front Med (Lausanne) 2020;7:624997. - PMC - PubMed
    1. Fei Q, Pan Y, Lin W, Zhou Y, Yu X, Hou Z, et al. . High-dimensional single-cell analysis delineates radiofrequency ablation induced immune microenvironmental remodeling in pancreatic cancer. Cell Death Dis 2020;11:589. - PMC - PubMed

Publication types

LinkOut - more resources