Characterizing nuclear morphology and expression of eNOS in vascular endothelial cells subjected to a continuous range of wall shear stress magnitudes and directionality
- PMID: 36368188
- PMCID: PMC10371053
- DOI: 10.1016/j.jmbbm.2022.105545
Characterizing nuclear morphology and expression of eNOS in vascular endothelial cells subjected to a continuous range of wall shear stress magnitudes and directionality
Abstract
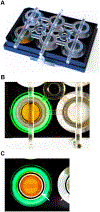
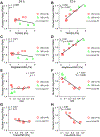
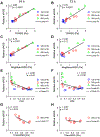
Complex patterns of hemodynamic wall shear stress occur in regions of arterial branching and curvature. Areas within these regions can be highly susceptible to atherosclerosis. Although many studies have characterized the response of vascular endothelial cells to shear stress in a categorical manner, our study herein addresses the need of characterizing endothelial behaviors over a continuous range of shear stress conditions that reflect the extensive variations seen in the vasculature. We evaluated the response of human umbilical vein endothelial cell monolayers to orbital flow at 120, 250, and 350 revolutions per minute (RPM) for 24 and 72 h. The orbital shaker model uniquely provides a continuous range of shear stress conditions from low and multidirectional at the center of each well of a culture plate to high and unidirectional at the periphery. We found distinct patterns of endothelial nuclear area, nuclear major and minor diameters, nuclear aspect ratio, and expression of endothelial nitric oxide synthase over this range of shear conditions and relationships were fit with linear and, where appropriate, power functions. Nuclear area was particularly sensitive with increases in the low and multidirectional WSS region that incrementally decreased as WSS became higher in magnitude and more unidirectional over the radius of the cell layers. The patterns of all endothelial behaviors exhibited high correlations (positive and negative) with metrics of shear stress magnitude and directionality that have been shown to strongly associate with atherosclerosis. Our findings demonstrate the exquisite sensitivity of these endothelial behaviors to incremental changes in shear stress magnitude and directionality, and provide critical quantitation of these relationships for predicting the susceptibility of an arterial segment to diseases such as atherosclerosis, particularly within complex flow environments in the vasculature such as around bifurcations.
Keywords: Endothelial nitric oxide synthase; Endothelium; Hemodynamics; Kruppel-like factor 2; Mechanical dose response; Mechanobiology; Nuclear area; Nuclear aspect ratio.
Copyright © 2022 Elsevier Ltd. All rights reserved.
Conflict of interest statement
Declaration of competing interest The authors declare that they have no known competing financial interests or personal relationships that could have appeared to influence the work reported in this paper.
Figures


Similar articles
-
Computational modeling of shear forces and experimental validation of endothelial cell responses in an orbital well shaker system.Comput Methods Biomech Biomed Engin. 2016;19(6):581-90. doi: 10.1080/10255842.2015.1051973. Epub 2015 Jun 22. Comput Methods Biomech Biomed Engin. 2016. PMID: 26096592
-
The response of human aortic endothelial cells in a stenotic hemodynamic environment: effect of duration, magnitude, and spatial gradients in wall shear stress.J Biomech Eng. 2010 Jul;132(7):071015. doi: 10.1115/1.4001217. J Biomech Eng. 2010. PMID: 20590293
-
Shear stress magnitude and directionality modulate growth factor gene expression in preconditioned vascular endothelial cells.J Vasc Surg. 2003 Jan;37(1):182-90. doi: 10.1067/mva.2003.66. J Vasc Surg. 2003. PMID: 12514598
-
The atherosusceptible endothelium: endothelial phenotypes in complex haemodynamic shear stress regions in vivo.Cardiovasc Res. 2013 Jul 15;99(2):315-27. doi: 10.1093/cvr/cvt101. Epub 2013 Apr 25. Cardiovasc Res. 2013. PMID: 23619421 Free PMC article. Review.
-
Molecular mechanisms responsible for the atheroprotective effects of laminar shear stress.Antioxid Redox Signal. 2009 Jul;11(7):1669-82. doi: 10.1089/ars.2009.2487. Antioxid Redox Signal. 2009. PMID: 19309258 Free PMC article. Review.
Cited by
-
Modular cone-and-plate device for mechanofluidic assays in Transwell inserts.Front Bioeng Biotechnol. 2025 Jan 27;13:1494553. doi: 10.3389/fbioe.2025.1494553. eCollection 2025. Front Bioeng Biotechnol. 2025. PMID: 39931136 Free PMC article.
-
Facilitating Nitrite-Derived S-Nitrosothiol Formation in the Upper Gastrointestinal Tract in the Therapy of Cardiovascular Diseases.Antioxidants (Basel). 2024 Jun 4;13(6):691. doi: 10.3390/antiox13060691. Antioxidants (Basel). 2024. PMID: 38929130 Free PMC article. Review.
-
Ultrasound Induces Similar Temporal Endothelial Expression Patterns of eNOS and KLF2 as Normal Flow.Ultrasound Med Biol. 2024 Dec;50(12):1893-1902. doi: 10.1016/j.ultrasmedbio.2024.08.017. Epub 2024 Sep 20. Ultrasound Med Biol. 2024. PMID: 39306482
-
Capturing physiological hemodynamic flow and mechanosensitive cell signaling in vessel-on-a-chip platforms.Front Physiol. 2024 Jul 29;15:1425618. doi: 10.3389/fphys.2024.1425618. eCollection 2024. Front Physiol. 2024. PMID: 39135710 Free PMC article. Review.
References
-
- Chatzizisis YS, Baker AB, Sukhova GK, Koskinas KC, Papafaklis MI, Beigel R, Jonas M, Coskun AU, Stone BV, Maynard C, Shi GP, Libby P, Feldman CL, Edelman ER, Stone PH, 2011. Augmented expression and activity of extracellular matrix-degrading enzymes in regions of low endothelial shear stress colocalize with coronary atheromata with thin fibrous caps in pigs. Circulation 123, 621–630. 10.1161/CIRCULATIONAHA.110.970038 - DOI - PMC - PubMed
Publication types
MeSH terms
Substances
Grants and funding
LinkOut - more resources
Full Text Sources
Medical
Research Materials

