. 2023 Feb;64(2):59-68.
doi: 10.1111/jsap.13568. Epub 2022 Nov 11.

Effect of an intervention of exercise on sleep and seizure frequency in idiopathic epileptic dogs

Affiliations

Effect of an intervention of exercise on sleep and seizure frequency in idiopathic epileptic dogs

K Grady et al. J Small Anim Pract. 2023 Feb.

Abstract

Objective: The goal of this study was to compare sleep and seizure frequency between epileptic dogs prescribed a 20% activity increase and epileptic dogs not prescribed an activity increase.

Methods: Sixty-nine dogs receiving anti-epileptic drug therapy were enrolled in a 6-month prospective, randomised, placebo-controlled clinical trial with an intention-to-treat analysis. A canine activity monitoring device was used to measure activity levels and sleep scores.

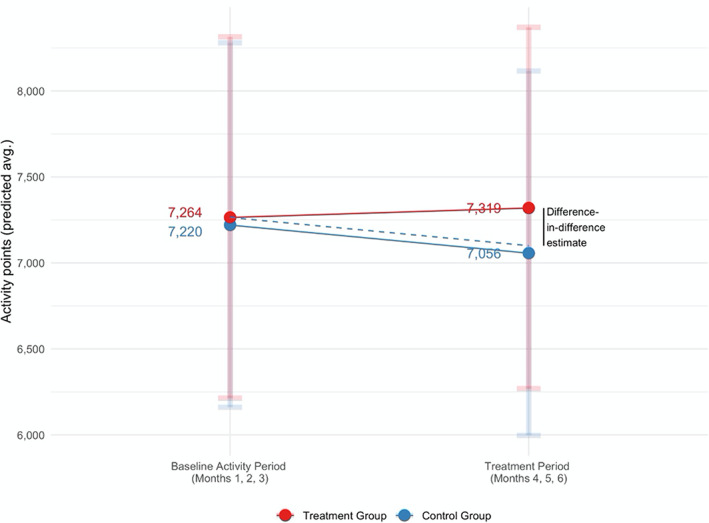
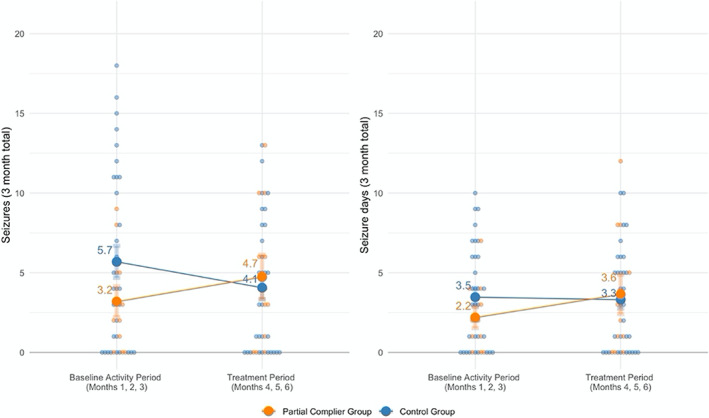
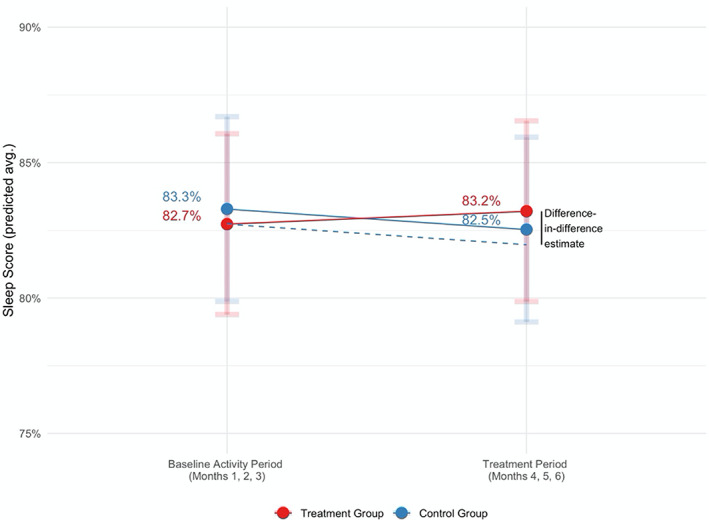
Results: Using an intention-to-treat analysis, the treatment group had an average of 0.381 more seizures per month (95% CI: 0.09 to 0.68) compared with the control group, although the difference in seizure days per month was not statistically significant. In a subgroup analysis of dogs whose activity increased by at least 10%, partial compliers had 0.719 more seizures per month (95% CI: 0.22 to 1.22) and 0.581 seizure days per month (95% CI: 0.001 to 1.16) compared with the control group. Sleep scores increased by 1.2% in the treatment compared with the control group (95% CI: 0.2 to 2.3%).

Conclusions: Seizure frequency and sleep score increased slightly, but significantly, in dogs with idiopathic epilepsy prescribed an increase in activity, compared with a control group.


Conflict of interest statement

None of the authors of this article has a financial or personal relationship with other people or organisations that could inappropriately influence or bias the content of the paper.

Figures

FIG 1
FIG 1
Difference‐in‐difference plot displaying predicted average activity points during the baseline activity period (months 1 to 3) and during the treatment period (months 4 to 6, dotted line) for the treatment (red) versus control (blue) groups. This plot is controlling for age, sex and neuter/spay status. Compared with control dogs, dogs in the treatment group, on average, had an estimated increase in activity of 219 activity points between the baseline activity period and the prescribed increase in activity period, although this was not statistically significant (SE, 164; CI=−103 to 541; P=0.18)
FIG 2
FIG 2
Average number of seizures over 3‐month period (left) and average number of seizure days per month (right) for the treatment versus control group. Compared with the control group, the treatment group's number of seizures increased significantly by 0.34 seizures per month (P=0.012). There was no significant difference in the change in the seizure day incidence between the treatment and control groups (P=0.48). The red line corresponds to the treatment group; the blue line corresponds to the control group
FIG 3
FIG 3
Average number of seizures per month (left) and seizure days per month incidence (right) for the partial compliers, defined as dogs in the treatment group who had their activity increased by at least 10%, versus the control group. The partial compliers' number of seizures increased by 0.51 seizures per month, whereas the control group's number of seizures decreased by 0.54 seizures per month. A similar trend was seen in seizure days, where partial compliers increased by 0.49 per month and the control group decreased by 0.05 per month. The orange line corresponds to the partial compliers of the treatment group; the blue line corresponds to the control group
FIG 4
FIG 4
Difference‐in‐difference plot displaying predicted average sleep score during the baseline activity period (months 1 to 3) and during the treatment period (months 4 to 6) for the treatment (red) versus control (blue) group. This plot controls for age, sex, neuter/spay status and seizure medication doses. Sleep scores improved by 1.2% on average (i.e. better sleep quality) for dogs in the treatment group versus the control group when age, sex, spay/neuter status and seizure medication dosages were controlled for (CI=0.2 to 2.3%, SE, 0.5%, P=0.0198)

References

    1. Abadie, A. (2005) Semiparametric difference‐in‐differences estimators. Review of Economic Studies 72, 1‐19
    1. Ablah, E. , Haug, A. , Konda, K. , et al. (2009) Exercise and epilepsy: a survey of Midwest epilepsy patients. Epilepsy and Behavior 14, 162‐166 - PubMed
    1. Arida, R. M. , Cavalheiro, E. A. , Da Silva, A. C. , et al. (2008) Physical activity and epilepsy: proven and predicted benefits. Sports Medicine 38, 607‐615 - PubMed
    1. Arida, R. M. , Scorza, F. A. , Gomes da Silva, S. , et al. (2010) The potential role of physical exercise in the treatment of epilepsy. Epilepsy and Behavior 17, 432‐435 - PubMed
    1. Barry, M. , Cameron, S. , Kent, B. , et al. (2021) Daytime and noctural activity in treated dogs with idiopathic epilepsy compared to matched unaffected controls. Journal of Veterinary Internal Medicine 35, 1826‐1833 - PMC - PubMed

Publication types

Substances