

Cortical myelin profile variations in healthy aging brain: A T1w/T2w ratio study
- PMID: 36368498
- PMCID: PMC9904172
- DOI: 10.1016/j.neuroimage.2022.119743
Cortical myelin profile variations in healthy aging brain: A T1w/T2w ratio study
Abstract
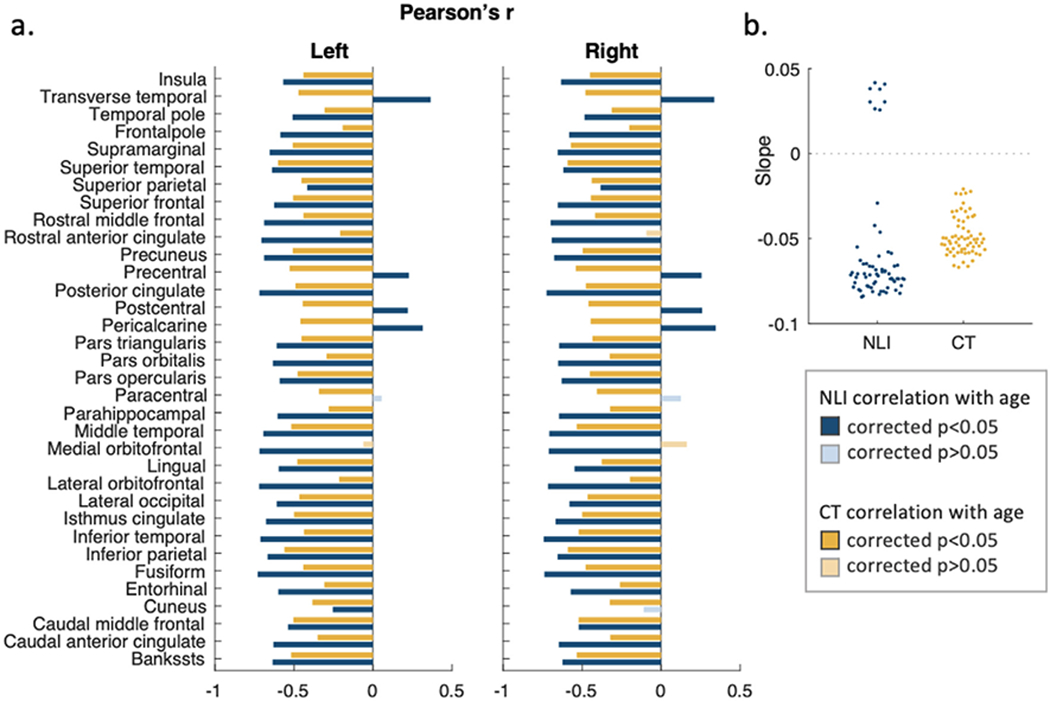
Demyelination is observed in both healthy aging and age-related neurodegenerative disorders. While the significance of myelin within the cortex is well acknowledged, studies focused on intracortical demyelination and depth-specific structural alterations in normal aging are lacking. Using the recently available Human Connectome Project Aging dataset, we investigated intracortical myelin in a normal aging population using the T1w/T2w ratio. To capture the fine changes across cortical depths, we employed a surface-based approach by constructing cortical profiles traveling perpendicularly through the cortical ribbon and sampling T1w/T2w values. The curvatures of T1w/T2w cortical profiles may be influenced by differences in local myeloarchitecture and other tissue properties, which are known to vary across cortical regions. To quantify the shape of these profiles, we parametrized the level of curvature using a nonlinearity index (NLI) that measures the deviation of the profile from a straight line. We showed that NLI exhibited a steep decline in aging that was independent of local cortical thinning. Further examination of the profiles revealed that lower T1w/T2w near the gray-white matter boundary and superficial cortical depths were major contributors to the apparent NLI variations with age. These findings suggest that demyelination and changes in other T1w/T2w related tissue properties in normal aging may be depth-specific and highlight the potential of NLI as a unique marker of microstructural alterations within the cerebral cortex.
Keywords: Aging; Cerebral cortex; Magnetic resonance imaging; Myelin sheath.
Copyright © 2022. Published by Elsevier Inc.
Figures


Similar articles
-
Graded Variation in T1w/T2w Ratio during Adolescence: Measurement, Caveats, and Implications for Development of Cortical Myelin.J Neurosci. 2022 Jul 20;42(29):5681-5694. doi: 10.1523/JNEUROSCI.2380-21.2022. Epub 2022 Jun 15. J Neurosci. 2022. PMID: 35705486 Free PMC article.
-
Gray matter myelination of 1555 human brains using partial volume corrected MRI images.Neuroimage. 2015 Jan 15;105:473-85. doi: 10.1016/j.neuroimage.2014.10.054. Epub 2014 Nov 1. Neuroimage. 2015. PMID: 25449739 Free PMC article.
-
Intracortical myelin links with performance variability across the human lifespan: results from T1- and T2-weighted MRI myelin mapping and diffusion tensor imaging.J Neurosci. 2013 Nov 20;33(47):18618-30. doi: 10.1523/JNEUROSCI.2811-13.2013. J Neurosci. 2013. PMID: 24259583 Free PMC article.
-
Accelerated longitudinal gray/white matter contrast decline in aging in lightly myelinated cortical regions.Hum Brain Mapp. 2016 Oct;37(10):3669-84. doi: 10.1002/hbm.23267. Epub 2016 May 26. Hum Brain Mapp. 2016. PMID: 27228371 Free PMC article.
-
New insights into the dynamic development of the cerebral cortex in childhood and adolescence: Integrating macro- and microstructural MRI findings.Prog Neurobiol. 2021 Sep;204:102109. doi: 10.1016/j.pneurobio.2021.102109. Epub 2021 Jun 18. Prog Neurobiol. 2021. PMID: 34147583 Review.
Cited by
-
7T MP2RAGE for cortical myelin segmentation: Impact of aging.PLoS One. 2024 Apr 16;19(4):e0299670. doi: 10.1371/journal.pone.0299670. eCollection 2024. PLoS One. 2024. PMID: 38626149 Free PMC article.
-
Myelination across cortical hierarchies and depths in humans and macaques.bioRxiv [Preprint]. 2025 Feb 6:2025.02.06.636851. doi: 10.1101/2025.02.06.636851. bioRxiv. 2025. PMID: 39975294 Free PMC article. Preprint.
-
Complementary MR measures of white matter and their relation to cardiovascular health and cognition.Sci Rep. 2025 Aug 7;15(1):28890. doi: 10.1038/s41598-025-13610-2. Sci Rep. 2025. PMID: 40775500 Free PMC article.
-
Association between cardiorespiratory fitness and total brain myelin volume among older adults.Eur Rev Aging Phys Act. 2025 Apr 8;22(1):5. doi: 10.1186/s11556-025-00371-0. Eur Rev Aging Phys Act. 2025. PMID: 40200178 Free PMC article.
-
Physical activity and the brain myelin content in humans.Front Cell Neurosci. 2023 Jun 5;17:1198657. doi: 10.3389/fncel.2023.1198657. eCollection 2023. Front Cell Neurosci. 2023. PMID: 37342769 Free PMC article. Review.
References
-
- Bartzokis G, 2005. Brain myelination in prevalent neuropsychiatric developmental disorders: primary and comorbid addiction. Adolesc. Psychiatry 29, 55–96. Retrieved from https://www.ncbi.nlm.nih.gov/pubmed/18668184 . - PMC - PubMed
Publication types
MeSH terms
Grants and funding
LinkOut - more resources
Full Text Sources
Medical
