Subtyping preserved ratio impaired spirometry (PRISm) by using quantitative HRCT imaging characteristics
- PMID: 36369019
- PMCID: PMC9652811
- DOI: 10.1186/s12931-022-02113-7
Subtyping preserved ratio impaired spirometry (PRISm) by using quantitative HRCT imaging characteristics
Erratum in
-
Correction: Subtyping preserved ratio impaired spirometry (PRISm) by using quantitative HRCT imaging characteristics.Respir Res. 2023 Jan 25;24(1):31. doi: 10.1186/s12931-023-02325-5. Respir Res. 2023. PMID: 36698145 Free PMC article. No abstract available.
Abstract
Background: Preserved Ratio Impaired Spirometry (PRISm) is defined as FEV1/FVC ≥ 70% and FEV1 < 80%pred by pulmonary function test (PFT). It has highly prevalence and is associated with increased respiratory symptoms, systemic inflammation, and mortality. However, there are few radiological studies related to PRISm. The purpose of this study was to investigate the quantitative high-resolution computed tomography (HRCT) characteristics of PRISm and to evaluate the correlation between quantitative HRCT parameters and pulmonary function parameters, with the goal of establishing a nomogram model for predicting PRISm based on quantitative HRCT.
Methods: A prospective and continuous study was performed in 488 respiratory outpatients from February 2020 to February 2021. All patients underwent both deep inspiratory and expiratory CT examinations, and received pulmonary function test (PFT) within 1 month. According to the exclusion criteria and Global Initiative for Chronic Obstructive Lung Disease (GOLD) classification standard, 94 cases of normal pulmonary function, 51 cases of PRISm and 48 cases of mild to moderate chronic obstructive lung disease (COPD) were included in the study. The lung parenchyma, parametric response mapping (PRM), airway and vessel parameters were measured by automatic segmentation software (Aview). One-way analysis of variance (ANOVA) was used to compare the differences in clinical features, pulmonary function parameters and quantitative CT parameters. Spearman rank correlation analysis was used to evaluate the correlation between CT quantitative index and pulmonary function parameters. The predictors were obtained by binary logistics regression analysis respectively in normal and PRISm as well as PRISm and mild to moderate COPD, and the nomogram model was established.
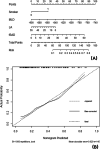
Results: There were significant differences in pulmonary function parameters among the three groups (P < 0.001). The differences in pulmonary parenchyma parameters such as emphysema index (EI), pixel indices-1 (PI-1) and PI-15 were mainly between mild to moderate COPD and the other two groups. The differences of airway parameters and pulmonary vascular parameters were mainly between normal and the other two groups, but were not found between PRISm and mild to moderate COPD. Especially there were significant differences in mean lung density (MLD) and the percent of normal in PRM (PRMNormal) among the three groups. Most of the pulmonary quantitative CT parameters had mild to moderate correlation with pulmonary function parameters. The predictors of the nomogram model using binary logistics regression analysis to distinguish normal from PRISm were smoking, MLD, the percent of functional small airways disease (fSAD) in PRM (PRMfSAD) and Lumen area. It had a good goodness of fit (χ2 = 0.31, P < 0.001) with the area under curve (AUC) value of 0.786. The predictor of distinguishing PRISm from mild to moderate COPD were PRMEmph (P < 0.001, AUC = 0.852).
Conclusions: PRISm was significantly different from subjects with normal pulmonary function in small airway and vessel lesions, which was more inclined to mild to moderate COPD, but there was no increase in pulmonary parenchymal attenuation. The nomogram based on quantitative HRCT parameters has good predictive value and provide more objective evidence for the early screening of PRISm.
Keywords: Chronic obstructive pulmonary disease; Computed tomography; Preserved ratio impaired spirometry; Pulmonary function test; Quantitative.
© 2022. The Author(s).
Conflict of interest statement
The authors declare that they have no competing interests.
Figures


References
-
- Halpin DMG, Criner GJ, Papi A, et al. Global Initiative for the diagnosis, management, and prevention of chronic obstructive lung disease. The 2020 GOLD science committee report on COVID-19 and chronic obstructive pulmonary disease. Am J Respir Crit Care Med. 2021;203(1):24–36. doi: 10.1164/rccm.202009-3533SO. - DOI - PMC - PubMed
MeSH terms
LinkOut - more resources
Full Text Sources
Medical
Research Materials
Miscellaneous

