. 2022 Nov 11;13(1):6859.
doi: 10.1038/s41467-022-34456-6.

Genetic regulation of serum IgA levels and susceptibility to common immune, infectious, kidney, and cardio-metabolic traits

Affiliations

Genetic regulation of serum IgA levels and susceptibility to common immune, infectious, kidney, and cardio-metabolic traits

Lili Liu et al. Nat Commun. .

Erratum in

  • Author Correction: Genetic regulation of serum IgA levels and susceptibility to common immune, infectious, kidney, and cardio-metabolic traits.
    Liu L, Khan A, Sanchez-Rodriguez E, Zanoni F, Li Y, Steers N, Balderes O, Zhang J, Krithivasan P, LeDesma RA, Fischman C, Hebbring SJ, Harley JB, Moncrieffe H, Kottyan LC, Namjou-Khales B, Walunas TL, Knevel R, Raychaudhuri S, Karlson EW, Denny JC, Stanaway IB, Crosslin D, Rauen T, Floege J, Eitner F, Moldoveanu Z, Reily C, Knoppova B, Hall S, Sheff JT, Julian BA, Wyatt RJ, Suzuki H, Xie J, Chen N, Zhou X, Zhang H, Hammarström L, Viktorin A, Magnusson PKE, Shang N, Hripcsak G, Weng C, Rundek T, Elkind MSV, Oelsner EC, Barr RG, Ionita-Laza I, Novak J, Gharavi AG, Kiryluk K. Liu L, et al. Nat Commun. 2023 Feb 6;14(1):655. doi: 10.1038/s41467-023-36340-3. Nat Commun. 2023. PMID: 36746961 Free PMC article. No abstract available.

Abstract

Immunoglobulin A (IgA) mediates mucosal responses to food antigens and the intestinal microbiome and is involved in susceptibility to mucosal pathogens, celiac disease, inflammatory bowel disease, and IgA nephropathy. We performed a genome-wide association study of serum IgA levels in 41,263 individuals of diverse ancestries and identified 20 genome-wide significant loci, including 9 known and 11 novel loci. Co-localization analyses with expression QTLs prioritized candidate genes for 14 of 20 significant loci. Most loci encoded genes that produced immune defects and IgA abnormalities when genetically manipulated in mice. We also observed positive genetic correlations of serum IgA levels with IgA nephropathy, type 2 diabetes, and body mass index, and negative correlations with celiac disease, inflammatory bowel disease, and several infections. Mendelian randomization supported elevated serum IgA as a causal factor in IgA nephropathy. African ancestry was consistently associated with higher serum IgA levels and greater frequency of IgA-increasing alleles compared to other ancestries. Our findings provide novel insights into the genetic regulation of IgA levels and its potential role in human disease.


Conflict of interest statement

Dr. Kiryluk has served on an advisory board for Goldfinch Bio and Gilead Sciences. Dr. Gharavi has served 1006 on an advisory board for Novartis, Travere and Natera and receives research grant funding from the Renal 1007 Research Institute and Natera. Dr. Moncrieffe is presently employed by Janssen Pharmaceutical Companies 37 1008 of Johnson & Johnson. Dr. Eitner is currently employed by Bayer AG. Drs. Julian and Novak are co-founders, 1009 co-owners of, and consultants for Reliant Glycosciences, LLC and are co-inventors on US patent application 1010 14/318,082 (assigned to UAB Research Foundation). The other authors declare no competing interests.

Figures

Fig. 1
Fig. 1. Ancestral differences in serum IgA levels.
a discovery analysis across the four major ancestral groups in MESA demonstrates that African ancestry is associated with higher adjusted IgA levels, b replication analysis in all non-MESA study participants confirms higher mean IgA levels in individuals of African ancestry, c mean adjusted IgA levels (±95% confidence intervals) as a function of African ancestry fraction, demonstrating that individuals in the upper quartile (>75%) of African ancestry have the highest serum IgA levels (N = 5420 MESA participants); standardized residuals generated by regression of log-transformed serum IgA levels against age and sex were significantly correlated with the African ancestry fraction (P = 4.6 × 10⁻³³), and this relationship remained highly significant after additional adjustment for BMI and diabetes (P = 3.7 × 10⁻²³), The boxplots in (a, b, and d) depict the median (horizontal line), upper/lower quartiles (boxes), and range (whiskers); the red diamond point denotes the mean value per ancestry group; two-sided unadjusted t test: *P < 0.05; **P < 0.01; ***P < 0.001. d distributions of the GPS for IgA levels in the 1000 Genomes (Phase 3) populations demonstrating higher GPS in African (AFR) compared to European (EUR), Admixed American (AMR), and East Asian (EAS) populations, e mean AFR-EUR difference in IgA-increasing allele frequency for each quartile of GPS weights (LD-score-adjusted effect sizes under the assumption of 0.01 fraction of casual variants, N = 67267 variants included); error bars correspond to 95% confidence intervals around the mean.
Fig. 2
Fig. 2. Trans-ethnic meta-analyses across all cohorts identified 20 genome-wide significant loci.
a Manhattan plot depicting a total of 11 novel loci (red) as well as 9 known loci (purple) identified in the meta-analysis; the dotted horizontal line indicates a genome-wide significance threshold (P = 5 × 10⁻⁸); the y-axis depicts -log10(P-value) for the fixed effects meta-analysis (two-sided, unadjusted), and is truncated to accommodate large peak at RUNX3 locus. b Correlation between average frequency of the independently significant alleles associated with higher IgA levels (x-axis) and their age and sex adjusted effect size (y-axis, standardized betas). c Pleiotropic effects of the IgA GWAS loci; GWAS loci for IgA levels are in green; other traits are in purple; arrows represent allelic associations that are identical to or in tight LD (r2 > 0.5) with the IgA effect alleles; concordant effects indicated in red; opposed effects in blue.
Fig. 3
Fig. 3. Pathway and gene set enrichment analyses.
a Pathway enrichment analysis for genes at the significant GWAS loci (two-sided enrichment test P-values). b Gene-set enrichment for genes that cause abnormal IgA level. c abnormal immune tolerance; and (d) abnormal response to infection when genetically manipulated in mice. The y-axis shows the fixed effects meta-analysis –log10 (P-value) for the variant with the lowest two-sided unadjusted P-value in each candidate gene. The dashed line corresponds to genome-wide significance (P = 5 × 10⁻⁸). Enrichment P-value corresponds to the two-sided Fisher exact test comparing the observed number of genes with association signals below the genome-wide threshold against the number expected under binomial distribution.
Fig. 4
Fig. 4. Colocalization and enrichment analyses across different tissue/cell types.
a Colocalization analysis with gene expression QTLs (eQTLs) in whole blood and primary immune cells; each row indicates one gene and each column denotes one tissue/cell type; the color from red to white shows the probability of sharing the same causal variant between GWAS loci and eQTLs (PP4). b Tissue/cell type enrichment in DEPICT; the y-axis represents the −log10 of the two-sided adjusted p-value for the enrichment test and x-axis shows the first level MeSH tissue and cell type annotations. c Integrative analysis of eQTL and hQTL for LITAF locus. The upper and lower panels show the regional plots of the LITAF locus for IgA GWAS and eQTLs in monocyte, respectively. The y-axis represents the −log10 of the unadjusted two-sided p-value for the fixed effects GWAS meta-analysis (top) and the Wald test from linear regression of genotype on gene expression level (bottom); x-axis shows the chromosome positions. The lowest panel denotes the positions of LITAF gene and a hQTL peak (H3K27ac) in monocytes.
Fig. 5
Fig. 5. Colocalization and Mendelian randomization analyses based on GWAS for serum IgA levels, IgA nephropathy and tonsillectomy.
a Regional plot of the HORMAD2/LIF locus for IgA levels (without the deCODE-Lund cohort, top panel), IgA nephropathy (middle panel), and tonsillectomy (lower panel). The two-sided unadjusted P-value corresponds to the fixed effects GWAS meta-analysis. b Co-localization analysis of HORMAD2/LIF locus across the three traits; PP4 is the posterior probability of co-localization. c Mendelian randomization analysis using IgA level (GWAS N = 41,263) as an exposure, IgA nephropathy (GWAS N = 38,897) as an outcome, and co-localizing loci as instruments. The error bars correspond to 95% confidence intervals for the effect size. The x and y axis represent effect sizes of the genetic variants associated with the exposure and outcome, respectively. P-value corresponds to the two-sided inverse variance weighted (IVW) Mendelian Randomization test.
Fig. 6
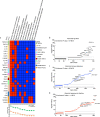
Fig. 6. Genetic relationships between IgA levels and human disease traits.
a genome-wide genetic correlation analyses between IgA levels and autoimmune, infectious, and cardio-metabolic traits after exclusion of the HLA region (*P < 0.05; two-sided unadjusted P-values for genetic correlation by LD score regression). Supplementary Table 12 provides genetic correlations with and without HLA with P-values for each trait, and references to the original GWAS studies; the error bars correspond to 95% confidence intervals for genetic correlation coefficients. b Meta-PheWAS of genome-wide polygenic score (GPS) for IgA levels across eMERGE-III and UKBB biobanks (total N = 556,656). c Meta-PheWAS of GPS for IgA levels without the HLA region (UKBB and eMERGE-III, total N = 556,656). In (b) and (c), the y-axis shows –log10 (P-value); each triangle represents an individual phenotype (phecode) tested as an outcome against the GPS for IgA levels as a predictor; an upward triangle indicates a positive (risk) association, while a downward triangle indicates a negative (protective) association; two-sided unadjusted P-value corresponds to the fixed effects meta-analysis across the two biobanks based on logistic regression adjusted for age, sex, site, genotyping batch, and principal components of ancestry; the red line corresponds to the Bonferroni-corrected significance threshold for 1523 phecodes tested (alpha = 0.05/1523 = 3.28 × 10⁻⁵); the phenotypes are grouped by organ system (or relevant disease category) and sorted based on their statistical significance within each group. Supplementary Table 13 provides a comparison of significant PheWAS associations with and without the HLA region.

Similar articles

  • GWAS for serum galactose-deficient IgA1 implicates critical genes of the O-glycosylation pathway.
    Kiryluk K, Li Y, Moldoveanu Z, Suzuki H, Reily C, Hou P, Xie J, Mladkova N, Prakash S, Fischman C, Shapiro S, LeDesma RA, Bradbury D, Ionita-Laza I, Eitner F, Rauen T, Maillard N, Berthoux F, Floege J, Chen N, Zhang H, Scolari F, Wyatt RJ, Julian BA, Gharavi AG, Novak J. Kiryluk K, et al. PLoS Genet. 2017 Feb 10;13(2):e1006609. doi: 10.1371/journal.pgen.1006609. eCollection 2017 Feb. PLoS Genet. 2017. PMID: 28187132 Free PMC article.
  • Genome-wide association analyses define pathogenic signaling pathways and prioritize drug targets for IgA nephropathy.
    Kiryluk K, Sanchez-Rodriguez E, Zhou XJ, Zanoni F, Liu L, Mladkova N, Khan A, Marasa M, Zhang JY, Balderes O, Sanna-Cherchi S, Bomback AS, Canetta PA, Appel GB, Radhakrishnan J, Trimarchi H, Sprangers B, Cattran DC, Reich H, Pei Y, Ravani P, Galesic K, Maixnerova D, Tesar V, Stengel B, Metzger M, Canaud G, Maillard N, Berthoux F, Berthelot L, Pillebout E, Monteiro R, Nelson R, Wyatt RJ, Smoyer W, Mahan J, Samhar AA, Hidalgo G, Quiroga A, Weng P, Sreedharan R, Selewski D, Davis K, Kallash M, Vasylyeva TL, Rheault M, Chishti A, Ranch D, Wenderfer SE, Samsonov D, Claes DJ, Akchurin O, Goumenos D, Stangou M, Nagy J, Kovacs T, Fiaccadori E, Amoroso A, Barlassina C, Cusi D, Del Vecchio L, Battaglia GG, Bodria M, Boer E, Bono L, Boscutti G, Caridi G, Lugani F, Ghiggeri G, Coppo R, Peruzzi L, Esposito V, Esposito C, Feriozzi S, Polci R, Frasca G, Galliani M, Garozzo M, Mitrotti A, Gesualdo L, Granata S, Zaza G, Londrino F, Magistroni R, Pisani I, Magnano A, Marcantoni C, Messa P, Mignani R, Pani A, Ponticelli C, Roccatello D, Salvadori M, Salvi E, Santoro D, Gembillo G, Savoldi S, Spotti D, Zamboli P, Izzi C, Alberici F, Delbarba E, Florczak M, Krata N, Mucha K, Pączek L, Niemczyk S, Mosz… See abstract for full author list ➔ Kiryluk K, et al. Nat Genet. 2023 Jul;55(7):1091-1105. doi: 10.1038/s41588-023-01422-x. Epub 2023 Jun 19. Nat Genet. 2023. PMID: 37337107 Free PMC article.
  • The genetics of low and high birthweight and their relationship with cardiometabolic disease.
    Moen GH, Hwang LD, Brito Nunes C, Warrington NM, Evans DM. Moen GH, et al. Diabetologia. 2025 Jul;68(7):1452-1462. doi: 10.1007/s00125-025-06420-8. Epub 2025 Apr 10. Diabetologia. 2025. PMID: 40210729 Free PMC article.
  • The Relationship Between CSF1R Signaling, Monocyte-Macrophage Differentiation, and Susceptibility to Inflammatory Bowel Disease.
    Hume DA, Summers KM, O'Brien C, Pavli P. Hume DA, et al. Cell Mol Gastroenterol Hepatol. 2025;19(8):101510. doi: 10.1016/j.jcmgh.2025.101510. Epub 2025 Mar 26. Cell Mol Gastroenterol Hepatol. 2025. PMID: 40154882 Free PMC article. Review.
  • The complex genetic architecture of Alzheimer's disease: novel insights and future directions.
    Andrews SJ, Renton AE, Fulton-Howard B, Podlesny-Drabiniok A, Marcora E, Goate AM. Andrews SJ, et al. EBioMedicine. 2023 Apr;90:104511. doi: 10.1016/j.ebiom.2023.104511. Epub 2023 Mar 10. EBioMedicine. 2023. PMID: 36907103 Free PMC article. Review.

Cited by

References

    1. Woof JM, Kerr MA. The function of immunoglobulin A in immunity. J. Pathol. 2006;208:270–282. - PubMed
    1. Fasching CE, et al. Impact of the molecular form of immunoglobulin A on functional activity in defense against Streptococcus pneumoniae. Infect. Immun. 2007;75:1801–1810. - PMC - PubMed
    1. Woof JM, Russell MW. Structure and function relationships in IgA. Mucosal Immunol. 2011;4:590–597. - PubMed
    1. Corthesy B. Role of secretory IgA in infection and maintenance of homeostasis. Autoimmun. Rev. 2013;12:661–665. - PubMed
    1. Yu, H. Q. et al. Distinct features of SARS-CoV-2-specific IgA response in COVID-19 patients. Eur. Respir. J.56, 2001526 (2020). - PMC - PubMed

Publication types

Substances

Grants and funding