. 2022 Nov 11;13(1):6828.
doi: 10.1038/s41467-022-34665-z.

Stromal FOXF2 suppresses prostate cancer progression and metastasis by enhancing antitumor immunity

Affiliations

Stromal FOXF2 suppresses prostate cancer progression and metastasis by enhancing antitumor immunity

Deyong Jia et al. Nat Commun. .

Abstract

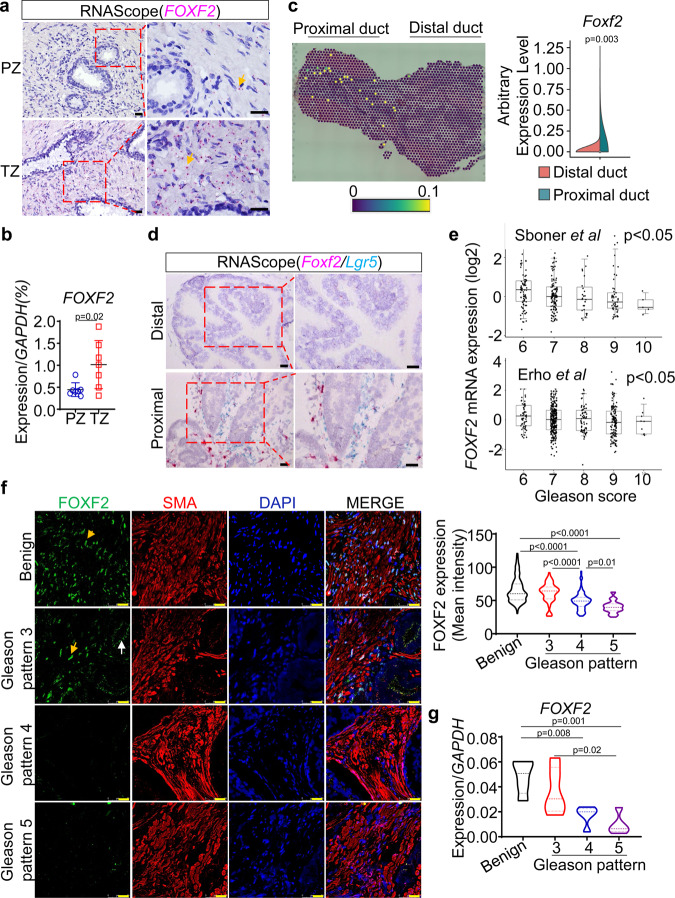
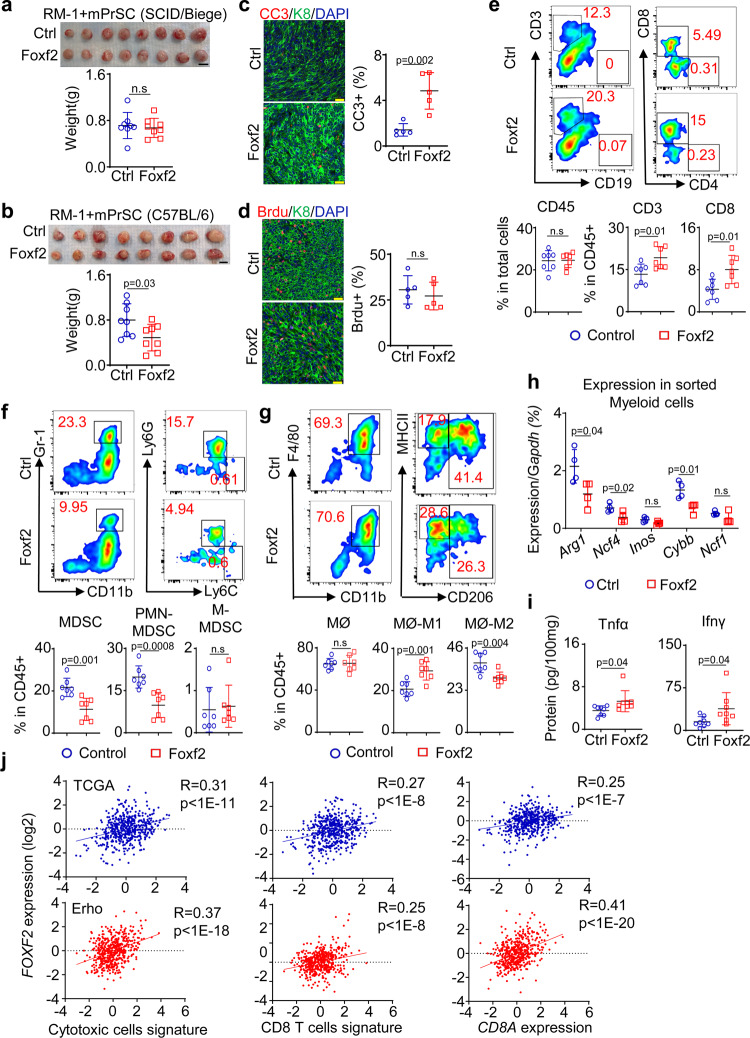
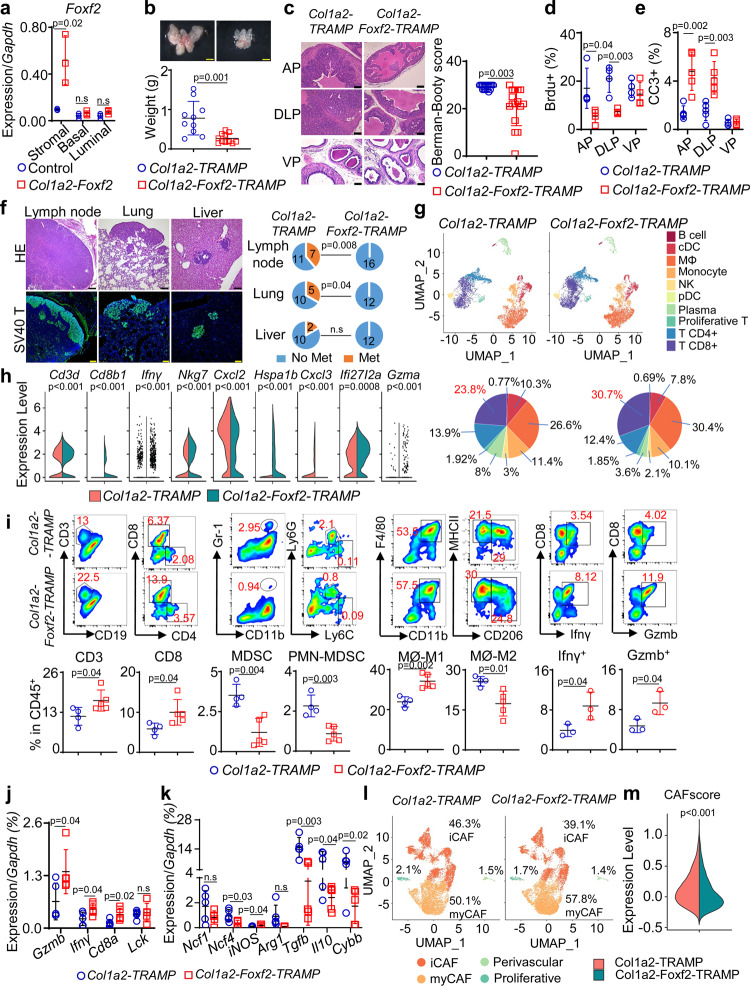
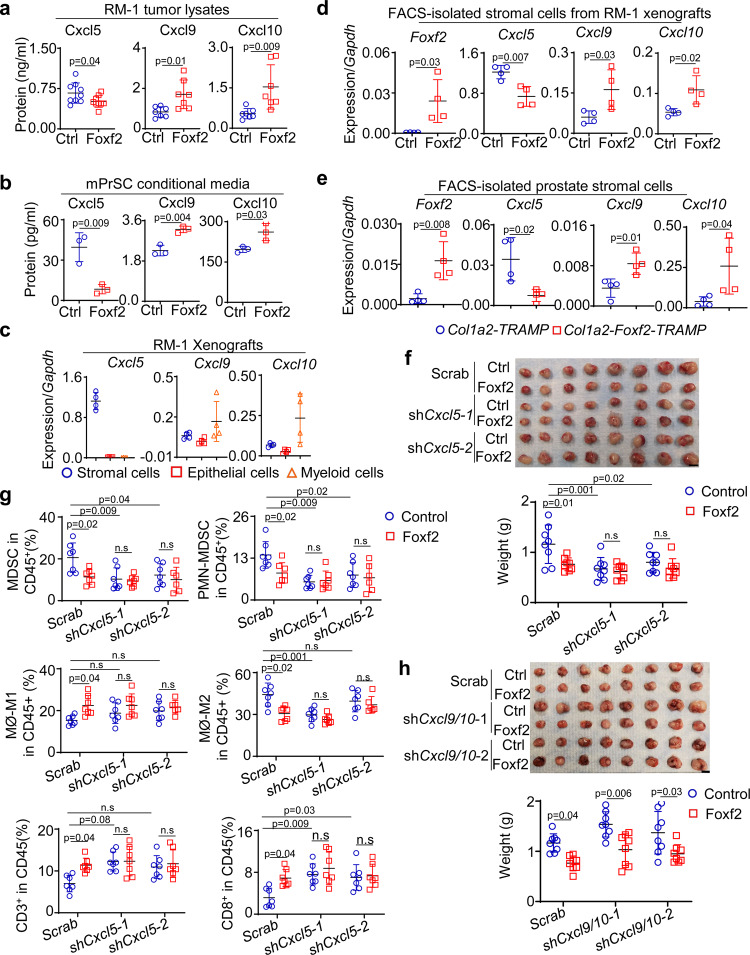
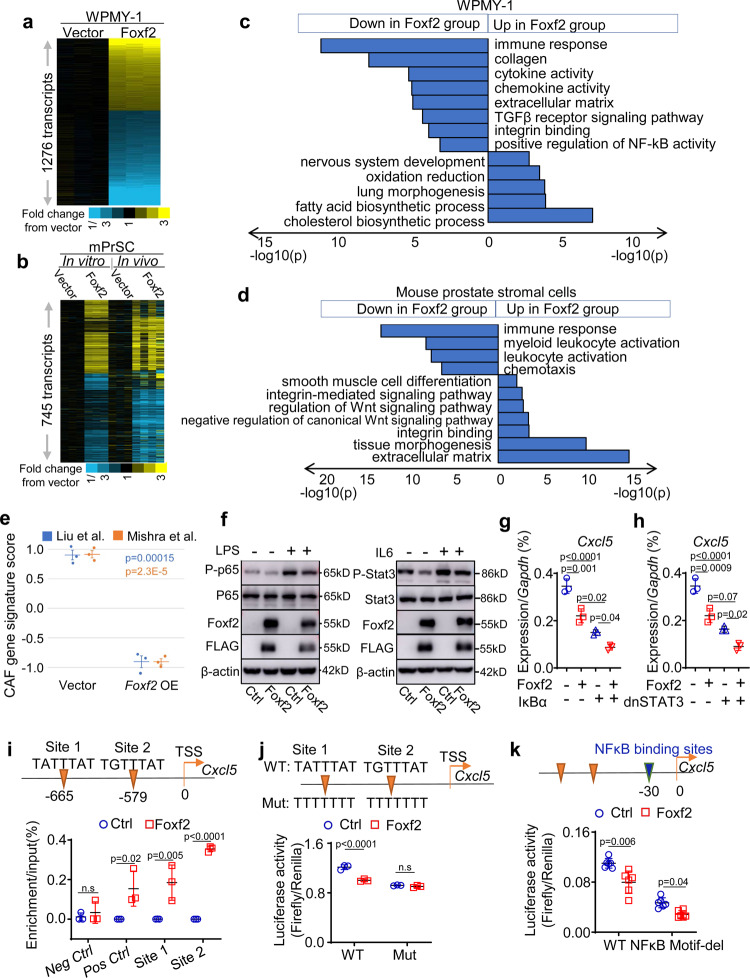
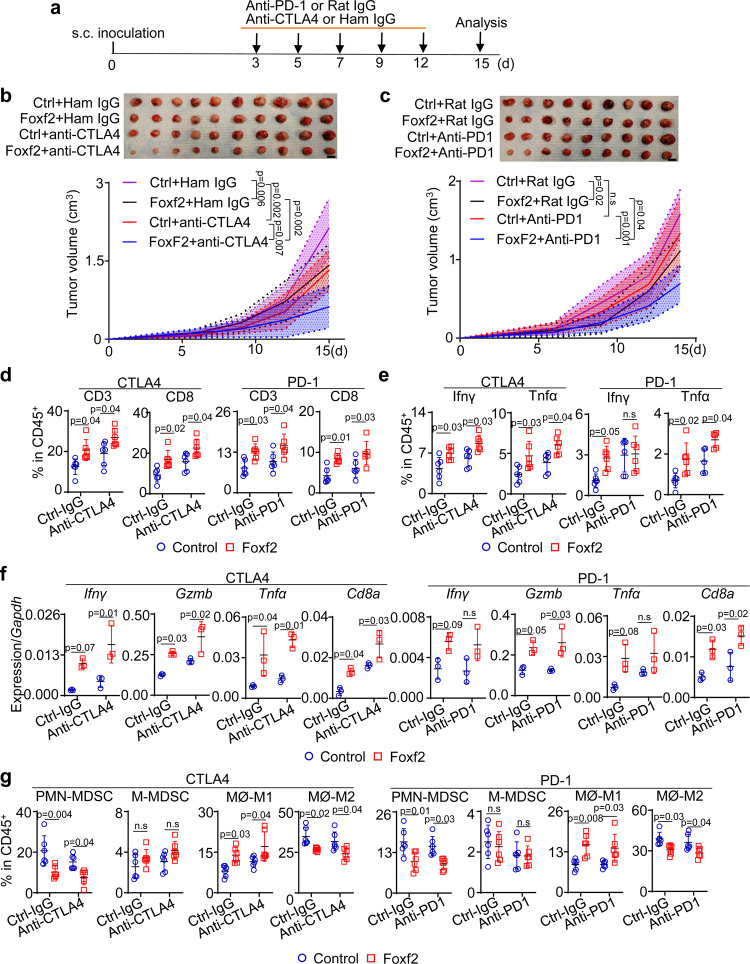
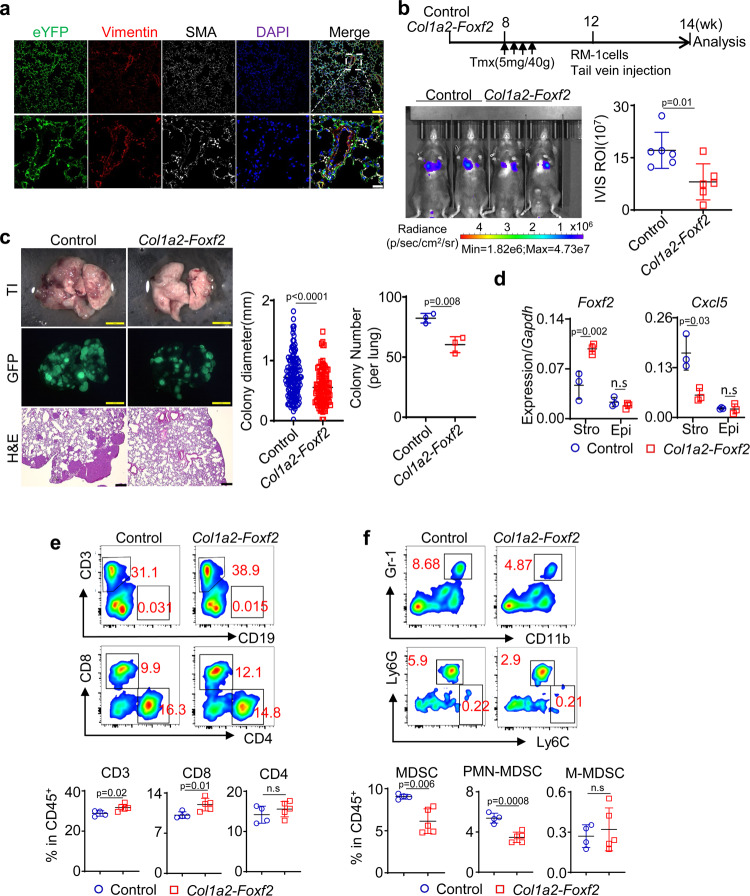
Cancer-associated fibroblasts (CAFs) mediate an immunosuppressive effect, but the underlying mechanism remains incompletely defined. Here we show that increasing prostatic stromal Foxf2 suppresses the growth and progression of both syngeneic and autochthonous mouse prostate cancer models in an immunocompetent context. Mechanistically, Foxf2 moderately attenuates the CAF phenotype and transcriptionally downregulates Cxcl5, which diminish the immunosuppressive myeloid cells and enhance T cell cytotoxicity. Increasing prostatic stromal Foxf2 sensitizes prostate cancer to the immune checkpoint blockade therapies. Augmenting lung stromal Foxf2 also mediates an immunosuppressive milieu and inhibits lung colonization of prostate cancer. FOXF2 is expressed higher in the stroma of human transition zone (TZ) than peripheral zone (PZ) prostate. The stromal FOXF2 expression level in primary prostate cancers inversely correlates with the Gleason grade. Our study establishes Foxf2 as a stromal transcription factor modulating the tumor immune microenvironment and potentially explains why cancers are relatively rare and indolent in the TZ prostate.


Conflict of interest statement

The authors declare no competing interests.

Figures

Fig. 1
Fig. 1. Stromal FOXF2 expression inversely correlates with Gleason grade.
a Representative image of 3 independent RNA-in-situ analysis of FOXF2 in human transition (TZ) and peripheral zone (PZ) prostates. Arrows point to pink staining of FOXF2. Bars = 20 μm. b qRT-PCR of FOXF2 in FACS-isolated Lin(CD45CD31CD235a)-Trop2- human PZ and TZ prostate stromal cells. Data represent means ± s.d. from 7 specimens by two-sided unpaired t-test. c Image of Visium spatial gene expression analysis for Foxf2 in prostate and urethra of 10-wk-old C57BL/6 mouse. Violin graph shows average arbitrary expression level of Foxf2 in distal and proximal prostatic ducts. N = 4 mice. Two-sided unpaired t-test. d Representative image of 3 independent RNA-in-situ analysis of Foxf2 and Lgr5 in proximal and distal anterior prostate ducts of 10-wk-old C57BL/6 mouse. Bars = 25 μm. Three experiments were repeated independently with similar results. e FOXF2 expression inversely correlates with Gleason scores in two human prostate cancer datasets: Erho et al. (N = 545) and Sboner et al. (N = 281). Box plots represent 5% (lower whisker), 25% (lower box), 50% (median), 75% (upper box), and 95% (upper whisker). f Co-immunostaining of FOXF2 (AF6988, R&D) and α-smooth muscle actin (SMA) in primary human prostate cancer specimens. Yellow and white arrows point to nuclear staining of stromal FOXf2 and nonspecific apical staining in tumor cells, respectively. Dot plot shows relative fluorescence intensity of FOXF2 in benign prostate tissues and prostate cancers of different Gleason patterns, analyzed by one-way ANOVA with Turkey’s multiple comparison test. Each dot represents value calculated from one field. Data show values collected from 343 fields from 20 prostate cancer specimens. Bars = 25 μm. g Expression of FOXF2 in laser-captured stromal cells from prostate cancer of different Gleason patterns and adjacent benign tissues by qRT-PCR. Each dot in plot represents value calculated from one laser captured specimen. Data show values collected from 20 laser-captured samples from 13 prostate cancer specimens, analyzed by one-way ANOVA with Turkey’s multiple comparison test. Source data are provided as a Source Data file.
Fig. 2
Fig. 2. Increasing stromal Foxf2 suppresses RM-1 growth in immunocompetent hosts.
a Representative image of RM-1 tumors grown subcutaneously with control (Ctrl) and Foxf2-expressing mouse prostate stromal cells in male SCID/Biege hosts. Dot plot shows means ± s.d. of tumor weight. Bar = 1 cm. N = 8 tumors per group. Two-sided unpaired t-test. b Representative image of RM-1 tumors grown subcutaneously with control and Foxf2-expressing mouse prostate stromal cells in male C57BL/6 hosts. Dot plot shows means ± s.d. of tumor weight. Bar = 1 cm. N = 8 tumors per group. Two-sided unpaired t-test. Co-immunostaining of Keratin 8 (K8) and cleaved caspase 3 (CC3) (c) and K8 and BrdU (d). Dot plots show means ± s.d. of CC3+ (c) and BrdU+ (d) cells from 5 tumors per group. Each dot represents average value from 20 fields per tumor. Bars = 25 μm. (e-g) FACS plots of T cells (e), myeloid derived suppressor cells (MDSC) (f), and macrophages (MØ) (g) in RM-1 tumors grown with control and Foxf2-expressing mouse prostate stromal cells. Dot plots show means ± s.d. of percentages of CD45+, CD3+ and CD8+ cells (e), monocytic (M-) and polymorphonuclear (PMN-) MDSC cells (f) and MHCII+CD206- M1 and CD206+ M2 cells (g). N = 7 tumors per group. two-sided unpaired t-test. h qRT-PCR of gene expression in CD45+CD11b+Gr-1+ myeloid cells FACS-sorted from RM-1 tumors grown with control and Foxf2-expressing stromal cells. Data represent means ± s.d. from 4 tumors per group. Two-sided unpaired t-test. i ELISA of Tnfα and Infγ in lysates of RM-1 tumors grown with control and Foxf2-expressing stromal cells. Data represent means ± s.d. from 8 tumors per group. Two-sided unpaired t-test. j Scatter plots show correlation between expression level of FOXF2 and that of CD8A (left panels), CD8 T-cell signature (middle panels), and cytotoxic T-cell signature (right panels) in prostate cancer datasets by TCGA (upper panels, N = 498) and Erho et al. (lower panels, N = 546) by Pearson correlation analysis. Source data are provided as a Source Data file.
Fig. 3
Fig. 3. Increasing stromal Foxf2 expression suppresses tumor progression and metastasis in TRAMP mice.
a qRT-PCR of Foxf2 using cells from tamoxifen-treated 10-wk-old mice (N = 3). Dot plot shows means ± s.d. Two-sided unpaired t-test. b Images of prostates from 9-mth-old Col1a2-TRAMP (N = 10) and Col1a2-Foxf2-TRAMP (N = 11) mice. Dot plot shows means ± s.d. Two-sided unpaired t-test. Bars = 2 mm. c H&E staining of anterior (AP), dorsolateral (DLP), and ventral (VP) prostates of 9-mth-old mice. Bars = 75 μm. Dot plot shows Berman-Booty scores of histology. Dots represent scores calculated from 16 tissue slides per group from 7 Col1a2-TRAMP and 6 Col1a2-Foxf2-TRAMP mice. Unpaired t-test. Dot plots show means ± s.d. of BrdU+ (d) and CC3+ (cleaved caspase 3) (e) cells in AP, DLP, and VP of 9-mth-old mice. N = 4 for Col1a2-TRAMP; N = 5 for Col1a2-Foxf2-TRAMP. Dots represent mean values from 20 representative fields of individual mice. f H&E and immunostaining of SV40. Pie charts show percentage of mice with metastasis from a total of 12–18 mice. Bars = 100μm. g UMAP plot of 13,948 FACS-isolated CD45+ cells in prostates of three 9-mth-old mice identifies 10 subpopulations annotated manually based on expression of genes shown in Supplementary Fig. 7a. Pie charts show percentages of individual subpopulations. h Violin plots show differences of gene expressions with a Wilcoxon Rank Sum test used within Seurat’s “FindAllMarkers” function. i FACS plots of immune cell lineages in anterior prostate cancer tissues of 9-mth-old mice. Dot plots show means ± s.d. of percentages of individual cell lineages. For analyses of T, MDSC and Macrophages, N = 4 mice for Col1a2-TRAMP; N = 5 mice for Col1a2-Foxf2-TRAMP. For analyses of Infγ and Gzmb, N = 3 mice for both groups. Two-sided unpaired t-test. MDSC: myeloid derived suppressor cells. (j, k) qRT-PCR using FACS-isolated CD45+CD3+ T and CD45+CD11b+ myeloid cells from prostates of 9-mth-old mice. Dot plots show means ± s.d. of gene expression. N = 5 mice per group. Two-sided unpaired t-test. l UMAP plot of 18,000 FACS-isolated Lin-CD49f-CD24- prostate stromal cells from 9-mth-old mice identifies 4 cancer-associated fibroblast (CAF) subpopulations annotated manually based on expression of genes presented in Supplementary Fig. 7e. m Violin plot shows mean CAF score calculated using 30 CAF-associated genes in Seurat’s AddModuleScore function in 9-mth-old mice. Two-sided Wilcoxon Rank Sum test was used to identify differential gene expression. Source data are provided as a Source Data file.
Fig. 4
Fig. 4. Cxcl5 plays a crucial role in stromal Foxf2-mediated tumor suppression.
ELISA of Cxcl5, Cxcl9 and Cxcl10 in lysates of RM-1 tumors grown with control (Ctrl) and Foxf2-expressing mouse stromal cells (a) and supernatant of in vitro cultured control and Foxf2-expressing mouse prostate stromal cells (mPrSC) (b). Data represent means ± s.d. of protein expression. In Fig. 4, N = 9 per group for Cxcl5, N = 7 per group for Cxcl9 and Cxcl10. In Fig. 4b, N = 3 per group. Two-sided unpaired t-test. c qRT-PCR of Cxcl5/9/10 in FACS-isolated stromal, RM-1, and myeloid cells from RM-1 tumors grown with mouse prostate stromal cells. Data represent means ± s.d. of gene expression from 4 tumors per group. d, e qRT-PCR of Foxf2 and Cxcl5/9/10 in FACS-isolated stromal cells from RM-1 tumors grown with control and Foxf2-expressing stromal cells and from prostates of 9-mth-old control (Col1a2-TRAMP) and Col1a2-Foxf2-TRAMP mice. Dot plots show means ± s.d. of gene expression from 4 mice per group. f Image of RM-1 tumors grown with control and Foxf2-expressing stromal cells with scrambled shRNA or shRNAs against Cxcl5. Dot plot shows means ± s.d. of tumor weight. N = 8 per group. Two-way ANOVA with Tukey’s multiple comparison test. Bar = 1 cm. g Dot plots show means ± s.d. of percentages of immune cell lineages determined by flow cytometry. N = 7 per group except that N = 6 for analysis of macrophages in shCxcl5-2 group. Two-way ANOVA with Tukey’s multiple comparison test. h Image of RM-1 tumors grown with control and Foxf2-expressing stromal cells with scrambled shRNA or shRNAs against Cxcl9 and Cxcl10. Dot plot shows means ± s.d. of tumor weight. N = 8 per group. Two-way ANOVA with Tukey’s multiple comparison test. Bar = 1 cm. Source data are provided as a Source Data file.
Fig. 5
Fig. 5. Foxf2 suppresses Cxcl5 directly and indirectly.
Heatmap of RNA-Seq analysis of control and Foxf2-expressing WPMY-1 (N = 3 each) (a), in vitro cultured control and Foxf2-expressing mouse prostate stromal cells (N = 3 each) (b), and FACS-isolated control (N = 3) and Foxf2-expressing (N = 4) mouse prostate stromal cells from in vivo RM-1 tumors (b). Heatmaps depict fold changes in experiment versus control. Each gene is centered on average of control. c, d Gene ontology analyses of RNA-Seq analyses. e CAF gene signature scoring comparing Foxf2 overexpression (OE) with control WPMY-1 cells. Bars represent standard error. P-values by two-sided t-test. f Western blot analysis using control and Foxf2-expressing mouse prostate stromal cells. LPS: lipopolysaccharide. Experiments were repeated for three times with similar observation. qRT-PCR of Cxcl5 in control and Foxf2-expressing mouse prostate stromal cells transduced with and without super IκBα (g) or dominant negative STAT3 (dnSTAT3) (h). Dot plots show means ± s.d. of Cxcl5 expression from 3 independent experiments. Two-way ANOVA with Tukey’s multiple comparison test (i) ChIP analysis of Foxf2 binding at promoter of Cxcl5 in mouse prostate stromal cells. TSS: transcription start site. Loci at Ch.15 and Pdgfrα serve as negative and positive binding controls, respectively. Dot plot shows means ± s.d. of relative enrichment from 3 independent experiments. Two-sided unpaired t-test. Luciferase reporter assays determine activity of Cxcl5 reporter with and without mutations in putative Foxf2 (j) or NF-κB (k) binding sites in control and Foxf2-expressing mouse prostate stromal cells. Data represent means ± s.d. from 3 (j)−6(k) experiments. Two-sided unpaired t-test. Source data are provided as a Source Data file.
Fig. 6
Fig. 6. Increasing Foxf2 sensitizes RM-1 to immune checkpoint inhibitors.
a Schematic illustration of experimental design. Images of RM-1 tumors grown subcutaneously with control and Foxf2-expressing mouse prostate stromal cells with and without treatment of anti-CTLA4 (b) (N = 10) or anti-PD1 (c) (N = 9), Bar = 1 cm. Line charts show means ± s.d. of tumor volumes. Two-way ANOVA with Tukey’s multiple comparison test. FACS analysis of T cells (d) and T cells expressing Ifnγ or Gzmb (e) in RM-1 tumors grown with control and Foxf2-expressing stromal cells with and without treatment by anti-CTLA4 or anti-PD1. Data represent means ± s.d. from 6 independent tumors, except that N = 5 for analysis of Tnfα in anti-PD1 group in Fig. 6e. Two-way ANOVA with Tukey’s multiple comparison test. f qRT-PCR of gene expression in FACS-isolated CD3+ T cells from RM-1 tumors in b and c. Data represent means ± s.d. from 3 specimens. Two-way ANOVA with Tukey’s multiple comparison test. g FACS analysis of monocytic (M-) and polymorphonuclear (PMN-) myeloid derived suppressor cells (MDSC) and MHCII+CD206- M1 and CD206+ M2 macrophage in RM-1 tumors grown with control and Foxf2-expressing stromal cells with and without treatment by anti-CTLA4 or anti-PD1. Data represent means ± s.d. from 6 independent tumors. Two-way ANOVA with Tukey’s multiple comparison test. Source data are provided as a Source Data file.
Fig. 7
Fig. 7. Increasing lung stromal Foxf2 suppresses prostate cancer metastasis.
a Representative image of 3 independent Co-immunostaining of eYFP, Vimentin, and smooth muscle actin (SMA) in lungs of 10-wk-old Col1a2-Foxf2 mice at low (upper panels) and high (lower panels) magnification. Yellow bar = 100 μm; white bar = 25 μm. b Schematic illustration of experimental procedure. Image shows bioluminescence imaging of experimental mice. Dot plot shows means ± s.d. of bioluminescent signaling from 6 mice per group. Two-sided unpaired t-test. c Transilluminating (upper panels) and fluorescent (middle panels) images, and H&E staining (bottom panels) of lungs from control and Col1a2-Foxf2 mice received RM-1 cells via tail vein. Dot plots show means ± s.d. of diameter of lung metastases and colony number per lung. In colony diameter plot, each dot represent value of one metastatic focus. Result is from a total of 247 lung metastatic foci in 6 mice. In colony number plot, each dot represent value from one experimental mouse. Yellow bar = 2 mm; black bar = 250 μm. N = 3 per group. Two-sided unpaired t-test. d qRT-PCR of Foxf2 and Cxcl5 in FACS-isolated lung stromal cells and epithelial cells from lung tissues of tamoxifen-treated Col1a2-Foxf2 mice. Data represent means ± s.d. of expression from 3 specimens. Two-sided unpaired t-test. e. f FACS plots of T cells (e) and monocytic (M-) and polymorphonuclear (PMN-) myeloid derived suppressor cells (MDSC) in lung metastases. Data represent means ± s.d. of cell percentage from independent tumors from control (N = 5) and Col1a2-Foxf2 mice (N = 6) group. Two-sided unpaired t-test. Source data are provided as a Source Data file.

Similar articles

Cited by

References

    1. Binnewies M, et al. Understanding the tumor immune microenvironment (TIME) for effective therapy. Nat. Med. 2018;24:541–550. - PMC - PubMed
    1. Wellenstein MD, de Visser KE. CanceR-cell-intrinsic mechanisms shaping the tumor immune landscape. Immunity. 2018;48:399–416. - PubMed
    1. LeBleu, V. S. & Kalluri, R. A peek into cancer-associated fibroblasts: origins, functions and translational impact. Dis. Models Mech.11, dmm029447 (2018). - PMC - PubMed
    1. Sahai E, et al. A framework for advancing our understanding of cancer-associated fibroblasts. Nat. Rev. Cancer. 2020;20:174–186. - PMC - PubMed
    1. Mhaidly R, Mechta-Grigoriou F. Fibroblast heterogeneity in tumor micro-environment: Role in immunosuppression and new therapies. Semin. Immunol. 2020;48:101417. - PubMed

Publication types

Substances