. 2022 Nov 11;13(1):6838.
doi: 10.1038/s41467-022-34640-8.

Protein control of photochemistry and transient intermediates in phytochromes

Affiliations

Protein control of photochemistry and transient intermediates in phytochromes

Giacomo Salvadori et al. Nat Commun. .

Abstract

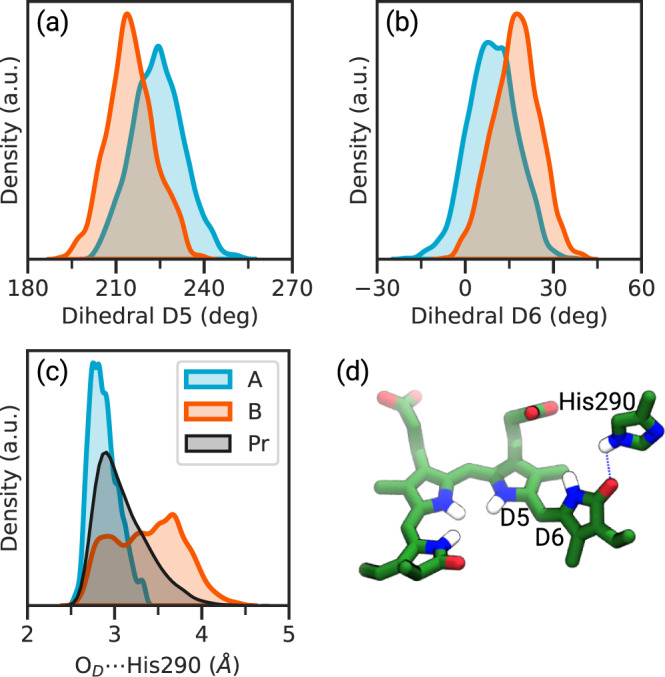
Phytochromes are ubiquitous photoreceptors responsible for sensing light in plants, fungi and bacteria. Their photoactivation is initiated by the photoisomerization of the embedded chromophore, triggering large conformational changes in the protein. Despite numerous experimental and computational studies, the role of chromophore-protein interactions in controlling the mechanism and timescale of the process remains elusive. Here, we combine nonadiabatic surface hopping trajectories and adiabatic molecular dynamics simulations to reveal the molecular details of such control for the Deinococcus radiodurans bacteriophytochrome. Our simulations reveal that chromophore photoisomerization proceeds through a hula-twist mechanism whose kinetics is mainly determined by the hydrogen bond of the chromophore with a close-by histidine. The resulting photoproduct relaxes to an early intermediate stabilized by a tyrosine, and finally evolves into a late intermediate, featuring a more disordered binding pocket and a weakening of the aspartate-to-arginine salt-bridge interaction, whose cleavage is essential to interconvert the phytochrome to the active state.


Conflict of interest statement

The authors declare no competing interests.

Figures

Fig. 1
Fig. 1. The photocycle in Deinococcus radiodurans bacteriophytochrome.
Representation of the PSM of the two photoproducts: Pr (PDB ID:4Q0J https://www.rcsb.org/structure/4Q0J) and Pfr (PDB ID:5C5K https://www.rcsb.org/structure/5C5K), with a zoom on the bilin chromophore (green), highlighting the PAS (blue), GAF (orange) and PHY (red) domains. The D-ring counterclockwise rotation (ccw) of the chromophore is represented by the red arrow in the left inset. Structures of the chromophore and the nearby residues obtained in this work for the early and late Lumi-R intermediates are reported in the two upper corners. The timescales for the different steps are the ones reported in the literature.
Fig. 2
Fig. 2. Comparison of ground-state QM/MM trajectories of the Pr state.
a, b Distribution of the dihedrals D5 (a) and D6 (b) in the two sets of QM/MM-MD trajectories. c Distribution of the distance between D-ring carbonyl and His290 residue in the two sets of QM/MM-MD trajectories and in the resting Pr state. The Pr distribution has been generated from a 4 μs-long MM-MD simulation previously performed in our group. d Representative structure of the BV in the Pr state with the His290 residue. Source data are available in the Zenodo repository.
Fig. 3
Fig. 3. The photochemical process.
a Sketch of the S1 and S0 PES along the reaction coordinate(s) with the quantum yield due to Set A. We represented the structures of the chromophore at the beginning of the simulation, at the time of the S1 → S0 transition, and at the end of the simulation. The main hydrogen bonds involving the D-ring are highlighted. b Correlation between the dihedral angles D5 and D6. All reactive trajectories from Set A are shown using blue lines for trajectories running on S1, and red lines for those on S0. The density distribution is shown at the starting conditions, at the S1 → S0 hop, and at the end of the simulation. c Time evolution of the electronic state populations evaluated as the fraction of trajectories running on the given state at the given time for both Set A and Set B, which are the mean values, with their 95% confidence intervals. Black line: fit of the S1 population according to an exponential function (Supplementary Methods 3). d Representative reactive and non-reactive SH trajectories from Set A and Set B. Green stars represent the S1-to-S0 transition. Source data are available in the Zenodo repository.
Fig. 4
Fig. 4. Early Lumi-R intermediate.
a, b Distribution for the dihedrals D5 and D6, respectively; c, d Distribution for the Tyr263 ⋯  Asp207 and ND ⋯  Tyr263 distances, respectively. The distributions were made on the QM/MM (orange) and Pr (black) MDs. A representative structure of the early intermediate can be found in Fig. 1. Source data are available in the Zenodo repository.
Fig. 5
Fig. 5. IR spectroscopy characterization.
a, b, c Representative structures of cluster 0, 1, and 2, respectively. d IR spectra of the different clusters of Lumi-R and the Pr state. We have used 18, 26, and 13 configurations belonging to clusters 0, 1, and 2, respectively. The sticks represent the carbonyl COD stretch. All spectra are normalized to the highest peak of Cl2. e In the upper panel, the averaged spectrum of the Lumi-R was represented together with that of the Pr state. In the lower panel, the theoretical (calc.) and experimental (exp.) early Lumi-R − Pr difference spectra were represented (a shift of 8 cm−1 has been applied to the calculated spectrum to properly compare with the experimental one measured in D2O. Source data are available in the Zenodo repository.
Fig. 6
Fig. 6. Late Lumi-R intermediate.
ad Distance distributions computed for the OD ⋯ Arg466, Tyr263 ⋯ Asp207, ND ⋯ Tyr263, and OB ⋯  Ser257 interactions, respectively. e Probabilities for the main hydrogen-bonding interactions around the D-ring f Probabilities of having 0, 1, or 2 contacts between Asp207 and Arg466. We define a contact if the Asp207 oxygens, and Arg466 nitrogens are less than 3 Å apart. We compared the Early Lumi-R (in blue) against the Late Lumi-R (in orange). The Early Lumi-R analysis was performed on 20,000 frames, while the Late Lumi-R analysis was performed on 10,000 frames. For the Early Lumi-R, the error is less than 2 ⋅ 10−4, while for Late Lumi-R it is less than 4 ⋅ 10−3. A representative structure of the late intermediate can be found in Fig 1. Source data are available in the Zenodo repository.

References

    1. Butler WL, Norris KH, Siegelman HW, Hendricks SB. Detection, assay, and preliminary purification of the pigment controlling photoresponsive development of plants. Proc. Natl Acad. Sci. USA. 1959;45:1703–1708. - PMC - PubMed
    1. Davis SJ, Vener AV, Vierstra RD. Bacteriophytochromes: phytochrome-like photoreceptors from nonphotosynthetic eubacteria. Science. 1999;286:2517–2520. - PubMed
    1. Jiang Z, et al. Bacterial photoreceptor with similarity to photoactive yellow protein and plant phytochromes. Science. 1999;285:406–409. - PubMed
    1. Hughes J, et al. A prokaryotic phytochrome. Nature. 1997;386:663–663. - PubMed
    1. Yeh K-C, Wu S-H, Murphy JT, Lagarias JC. A cyanobacterial phytochrome two-component light sensory system. Science. 1997;277:1505–1508. - PubMed

Publication types