. 2022 Nov;29(11):1136-1144.
doi: 10.1038/s41594-022-00855-y. Epub 2022 Nov 11.

CTCF blocks antisense transcription initiation at divergent promoters

Affiliations

CTCF blocks antisense transcription initiation at divergent promoters

Jing Luan et al. Nat Struct Mol Biol. 2022 Nov.

Abstract

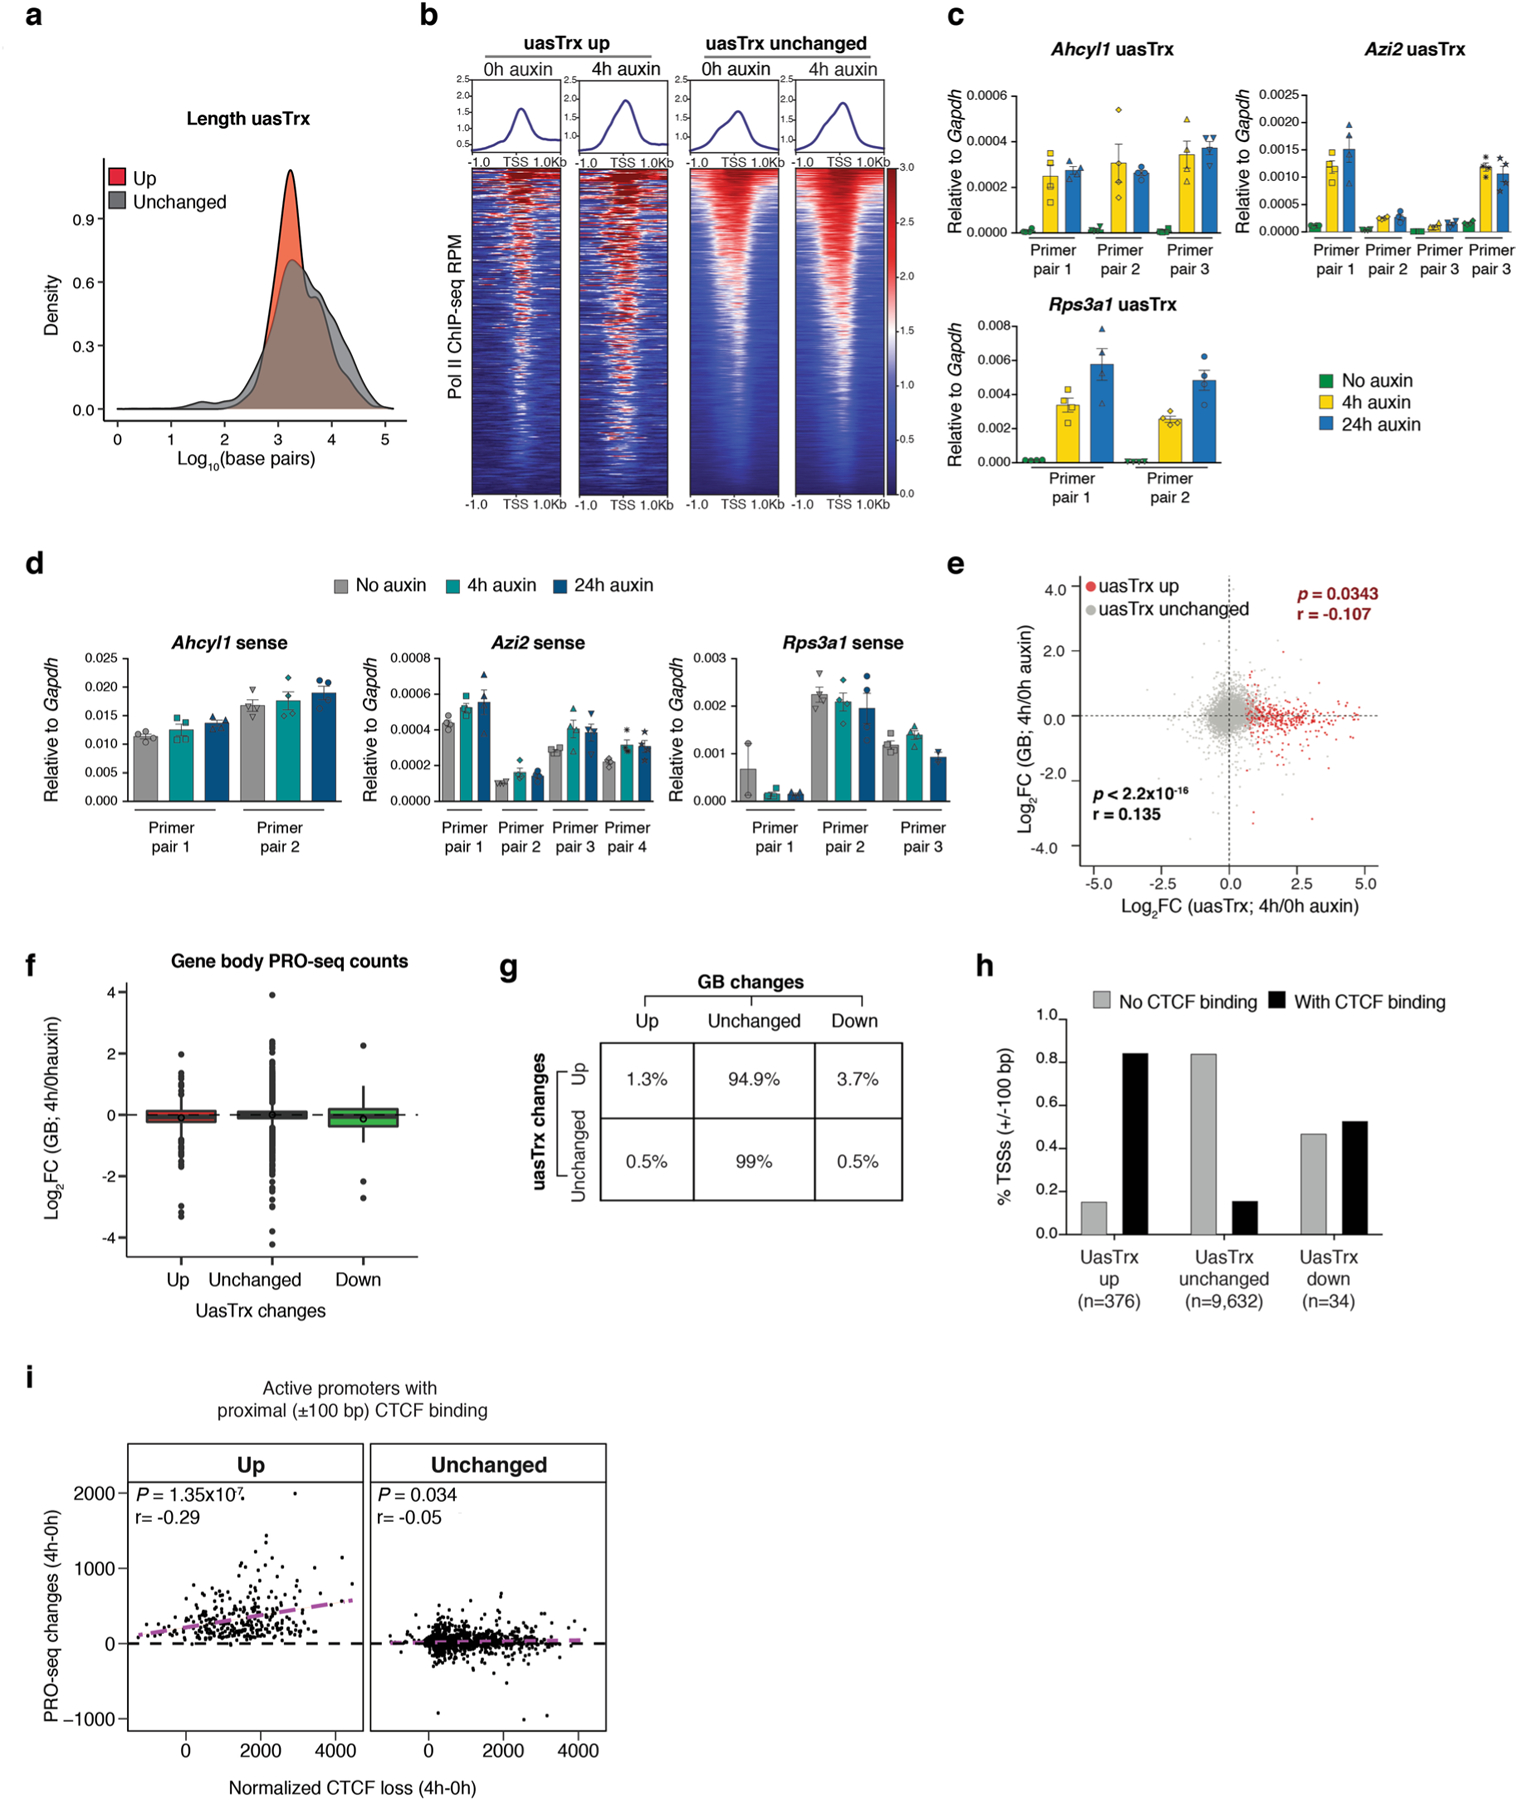
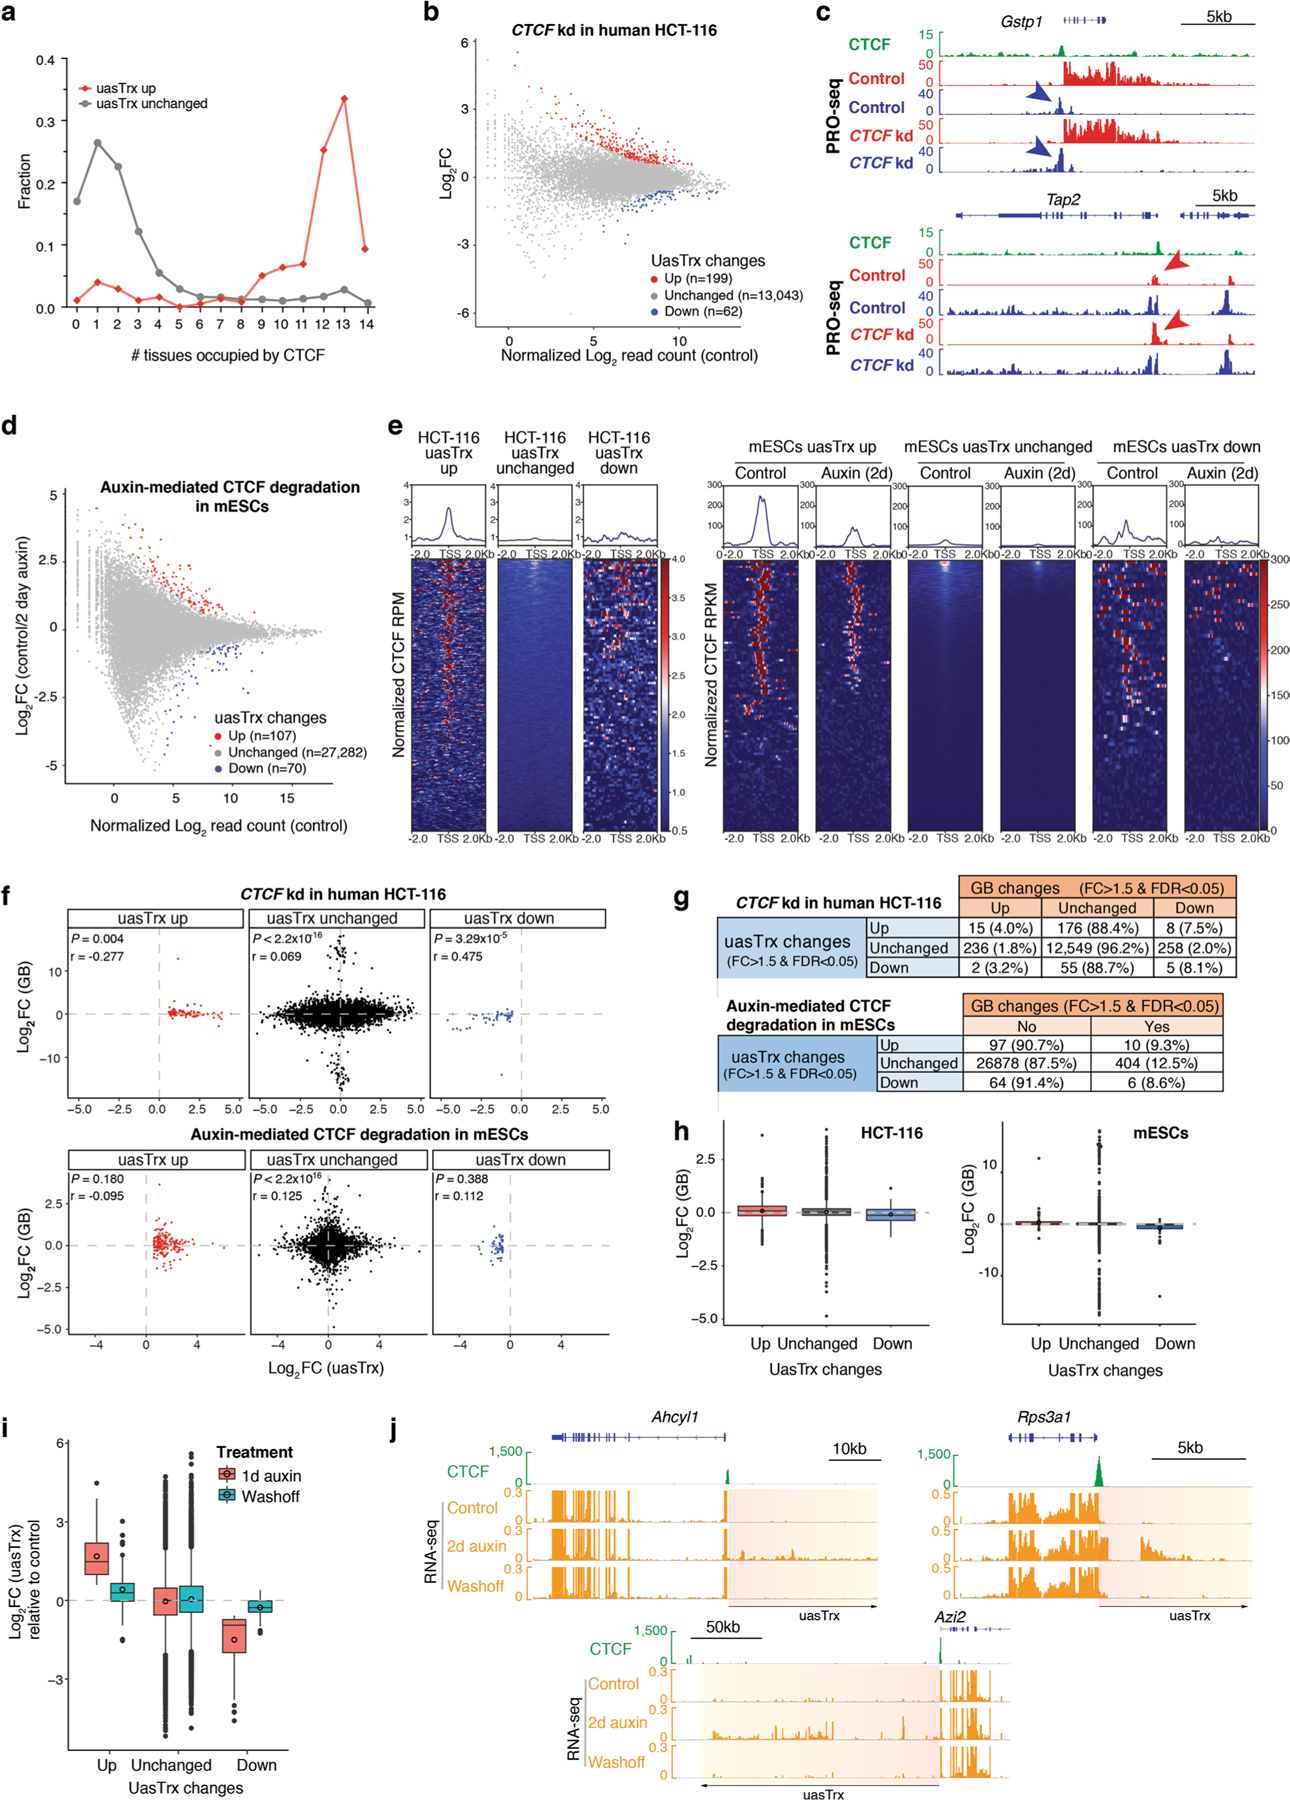
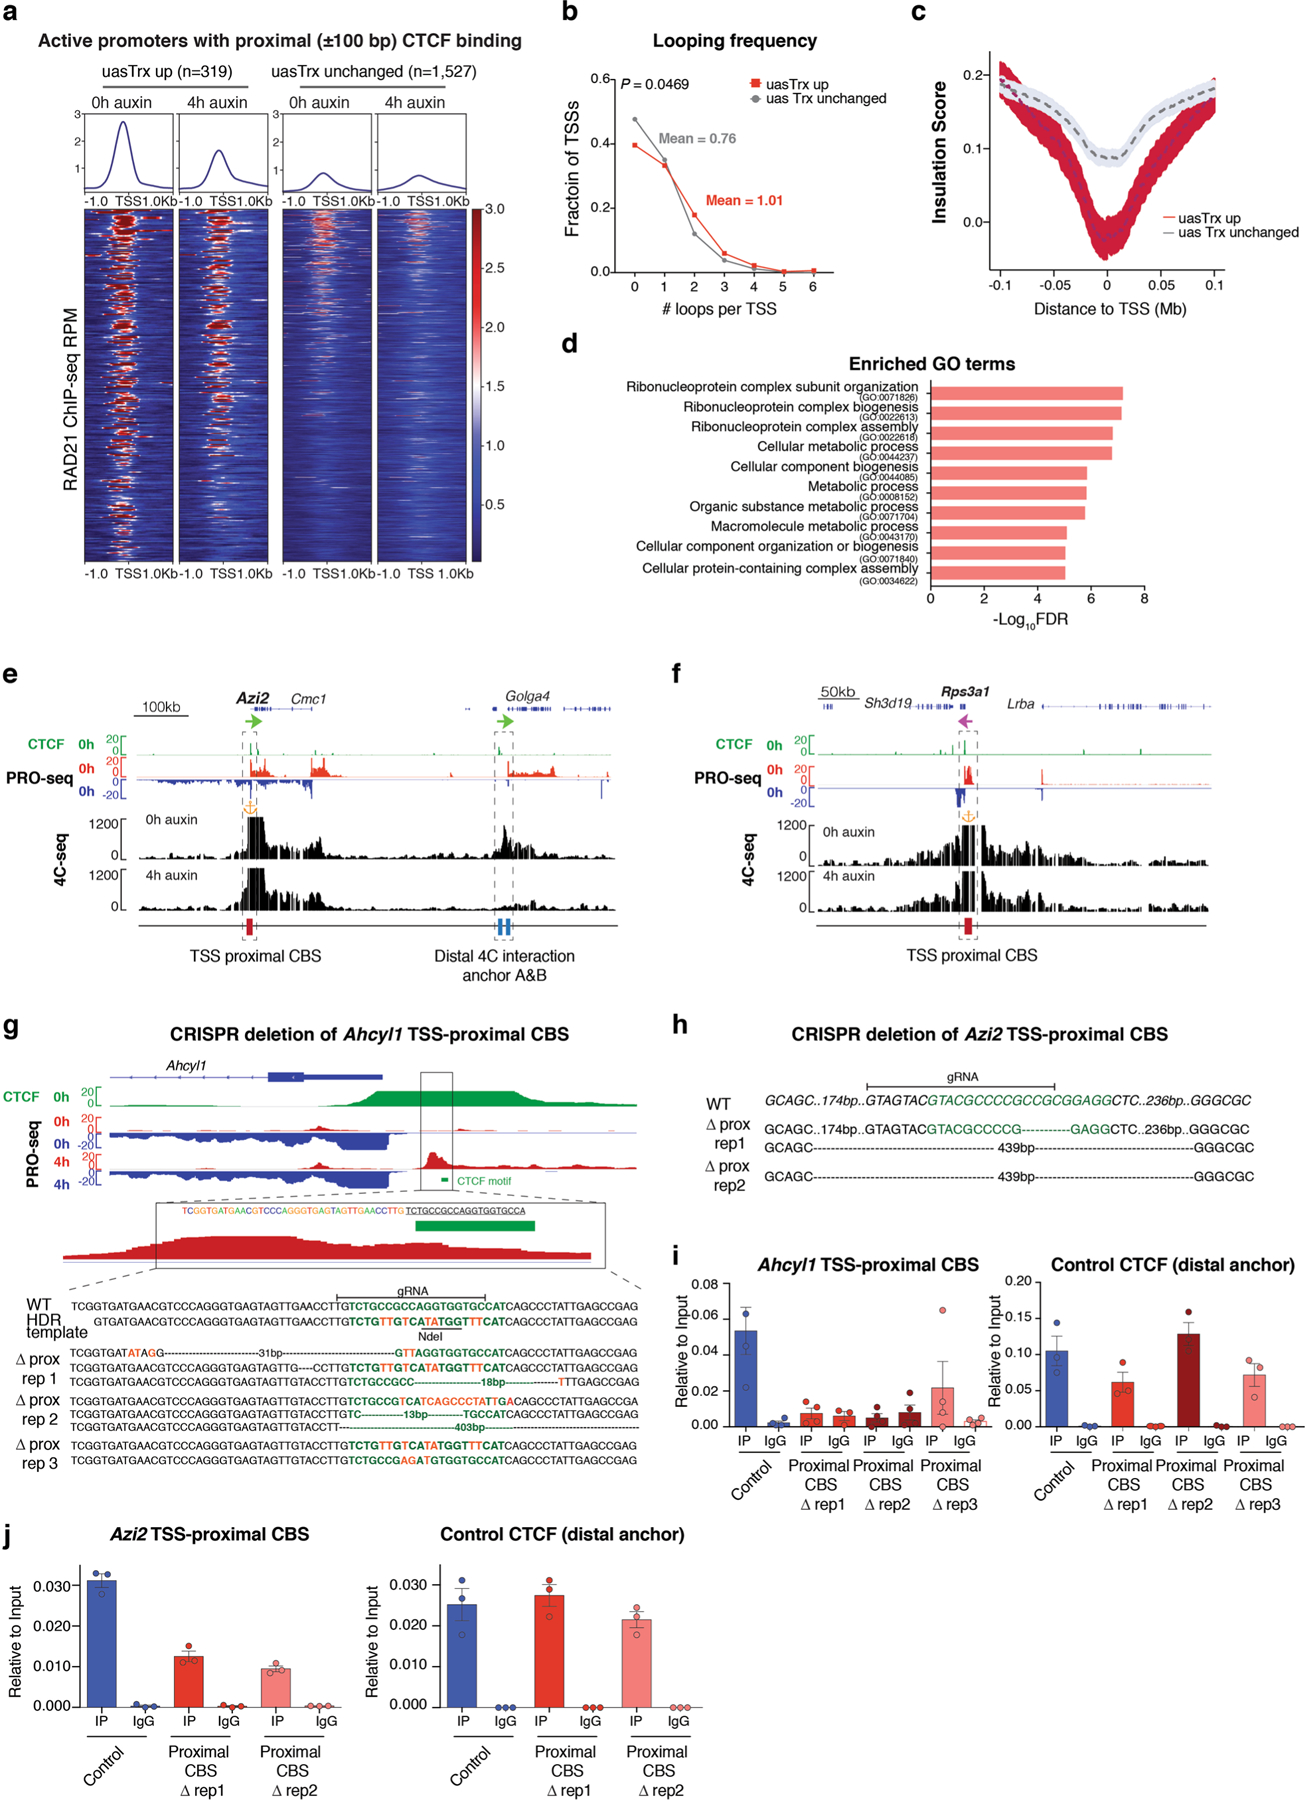
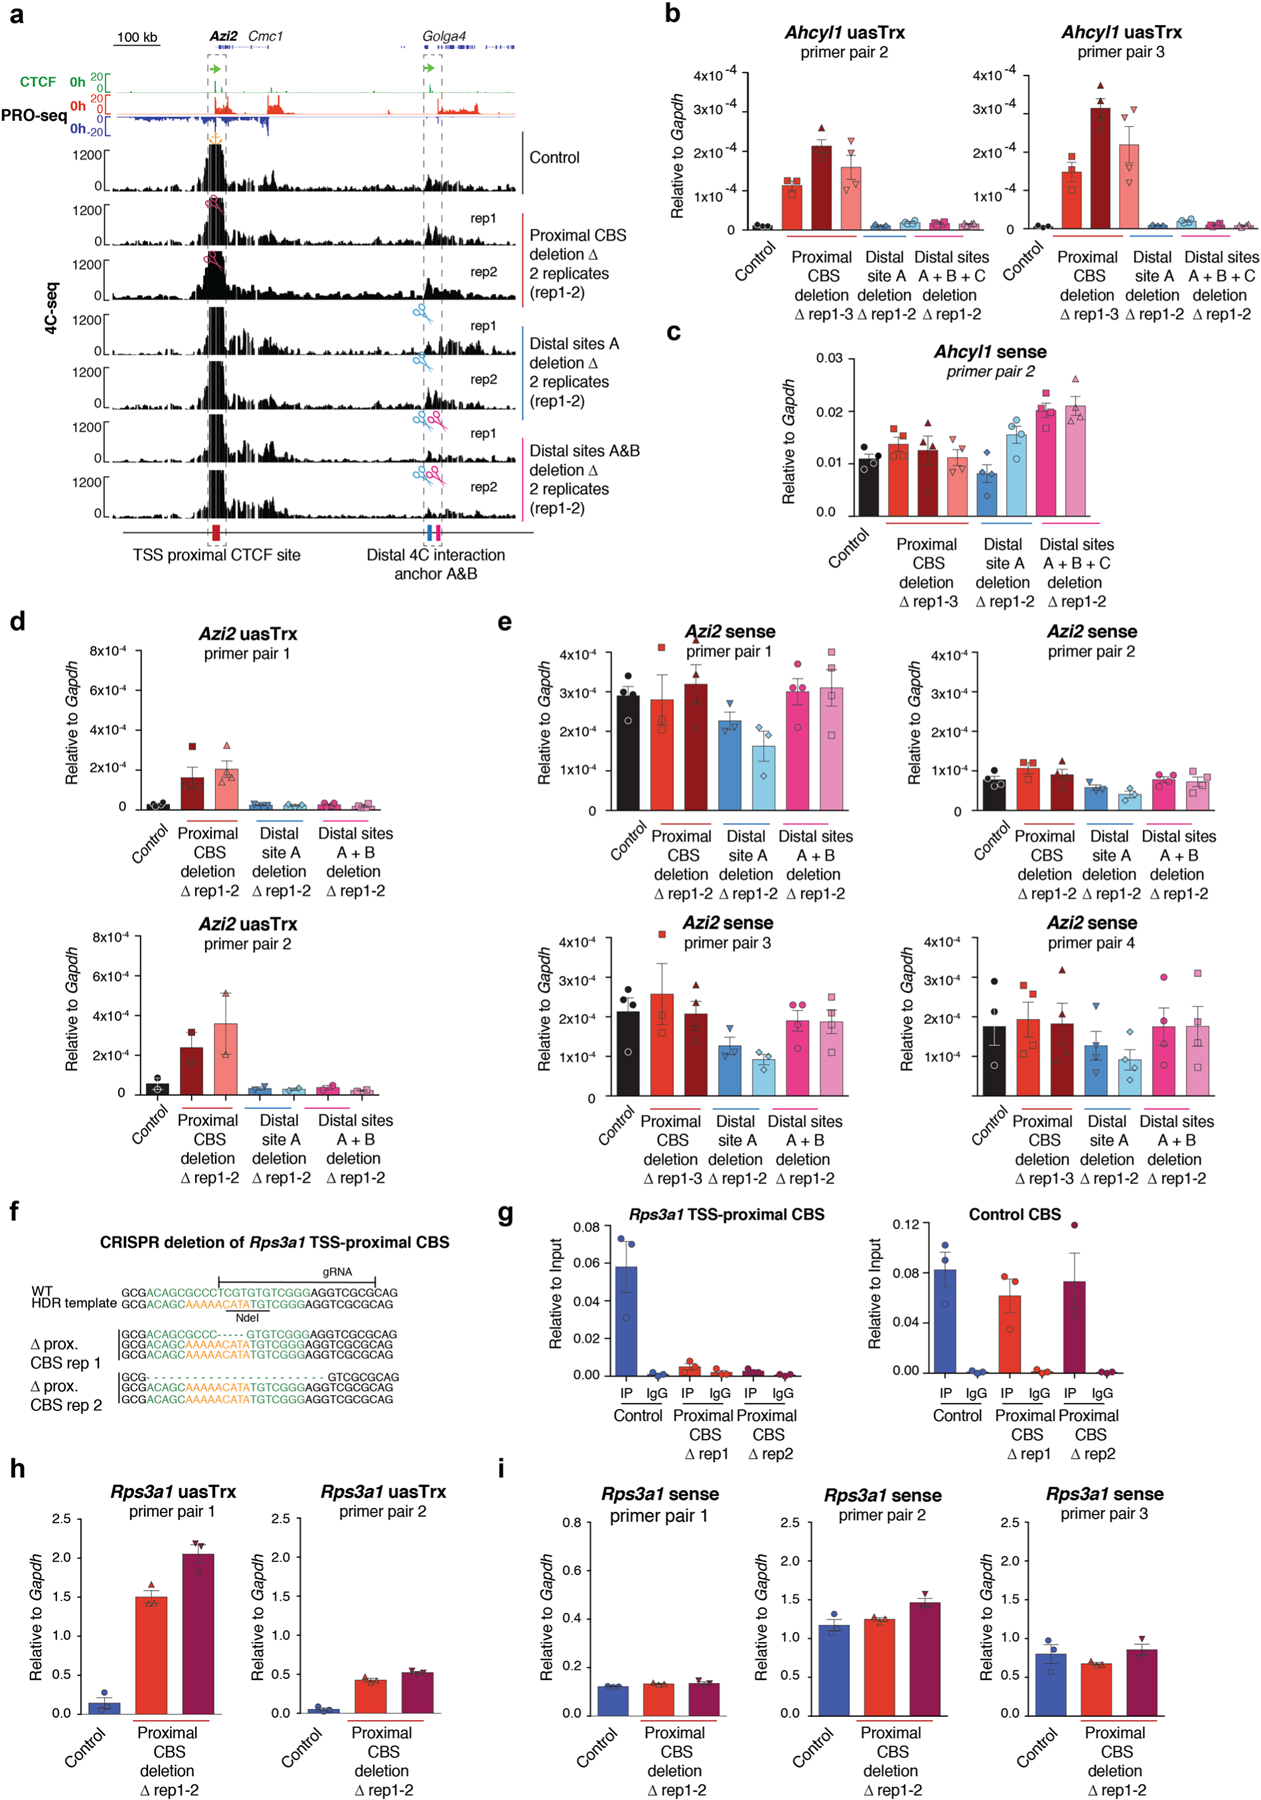
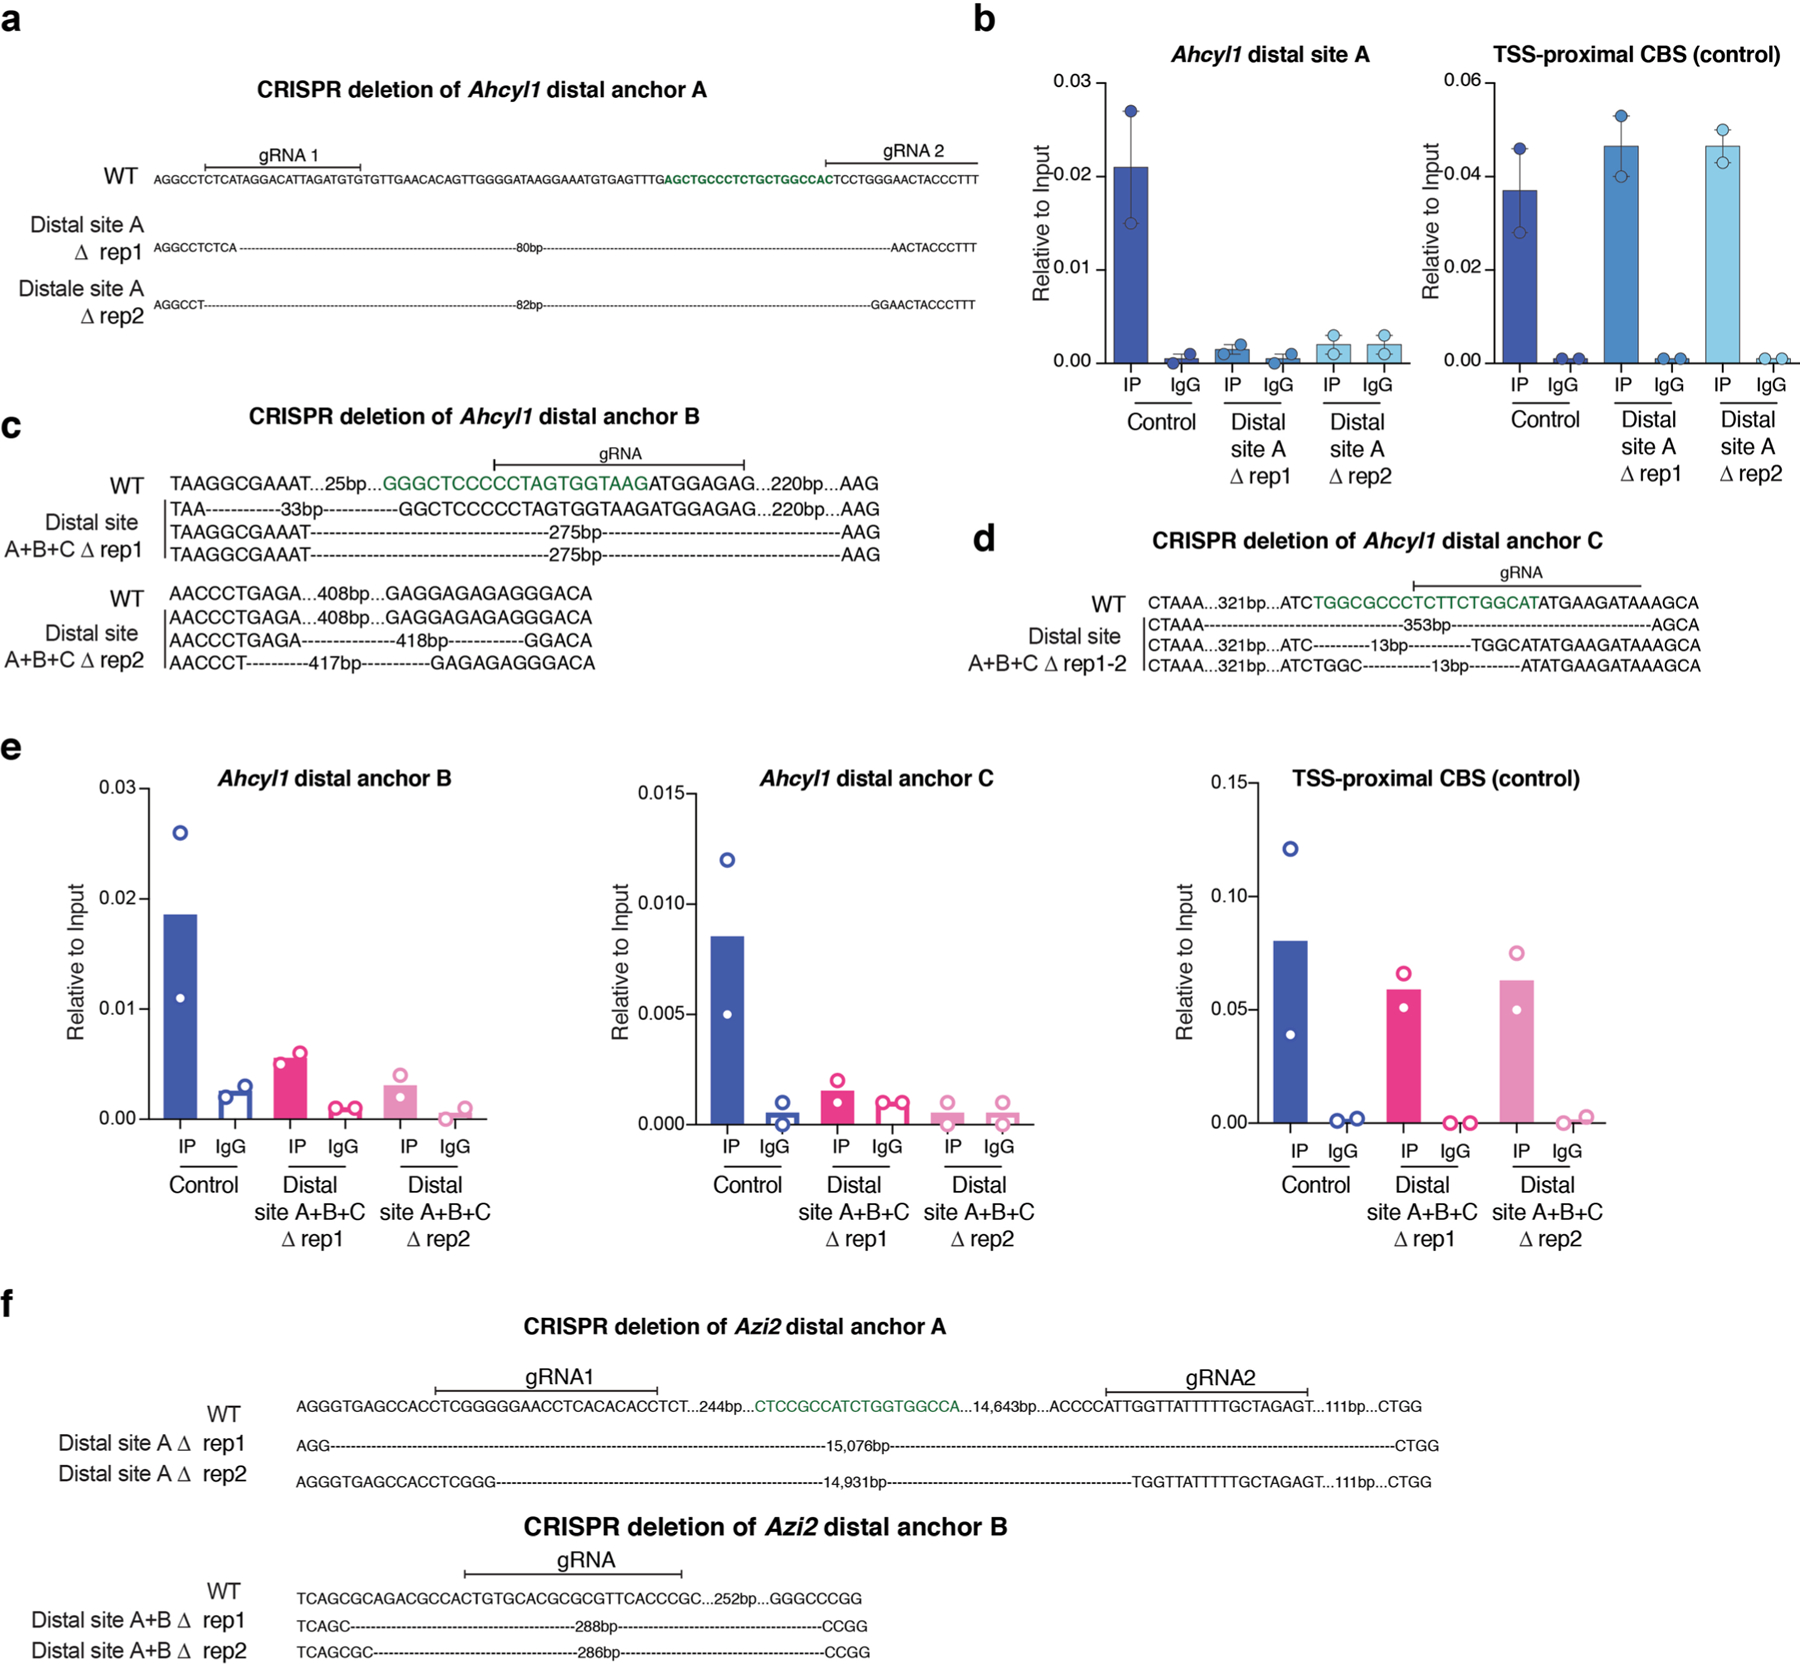
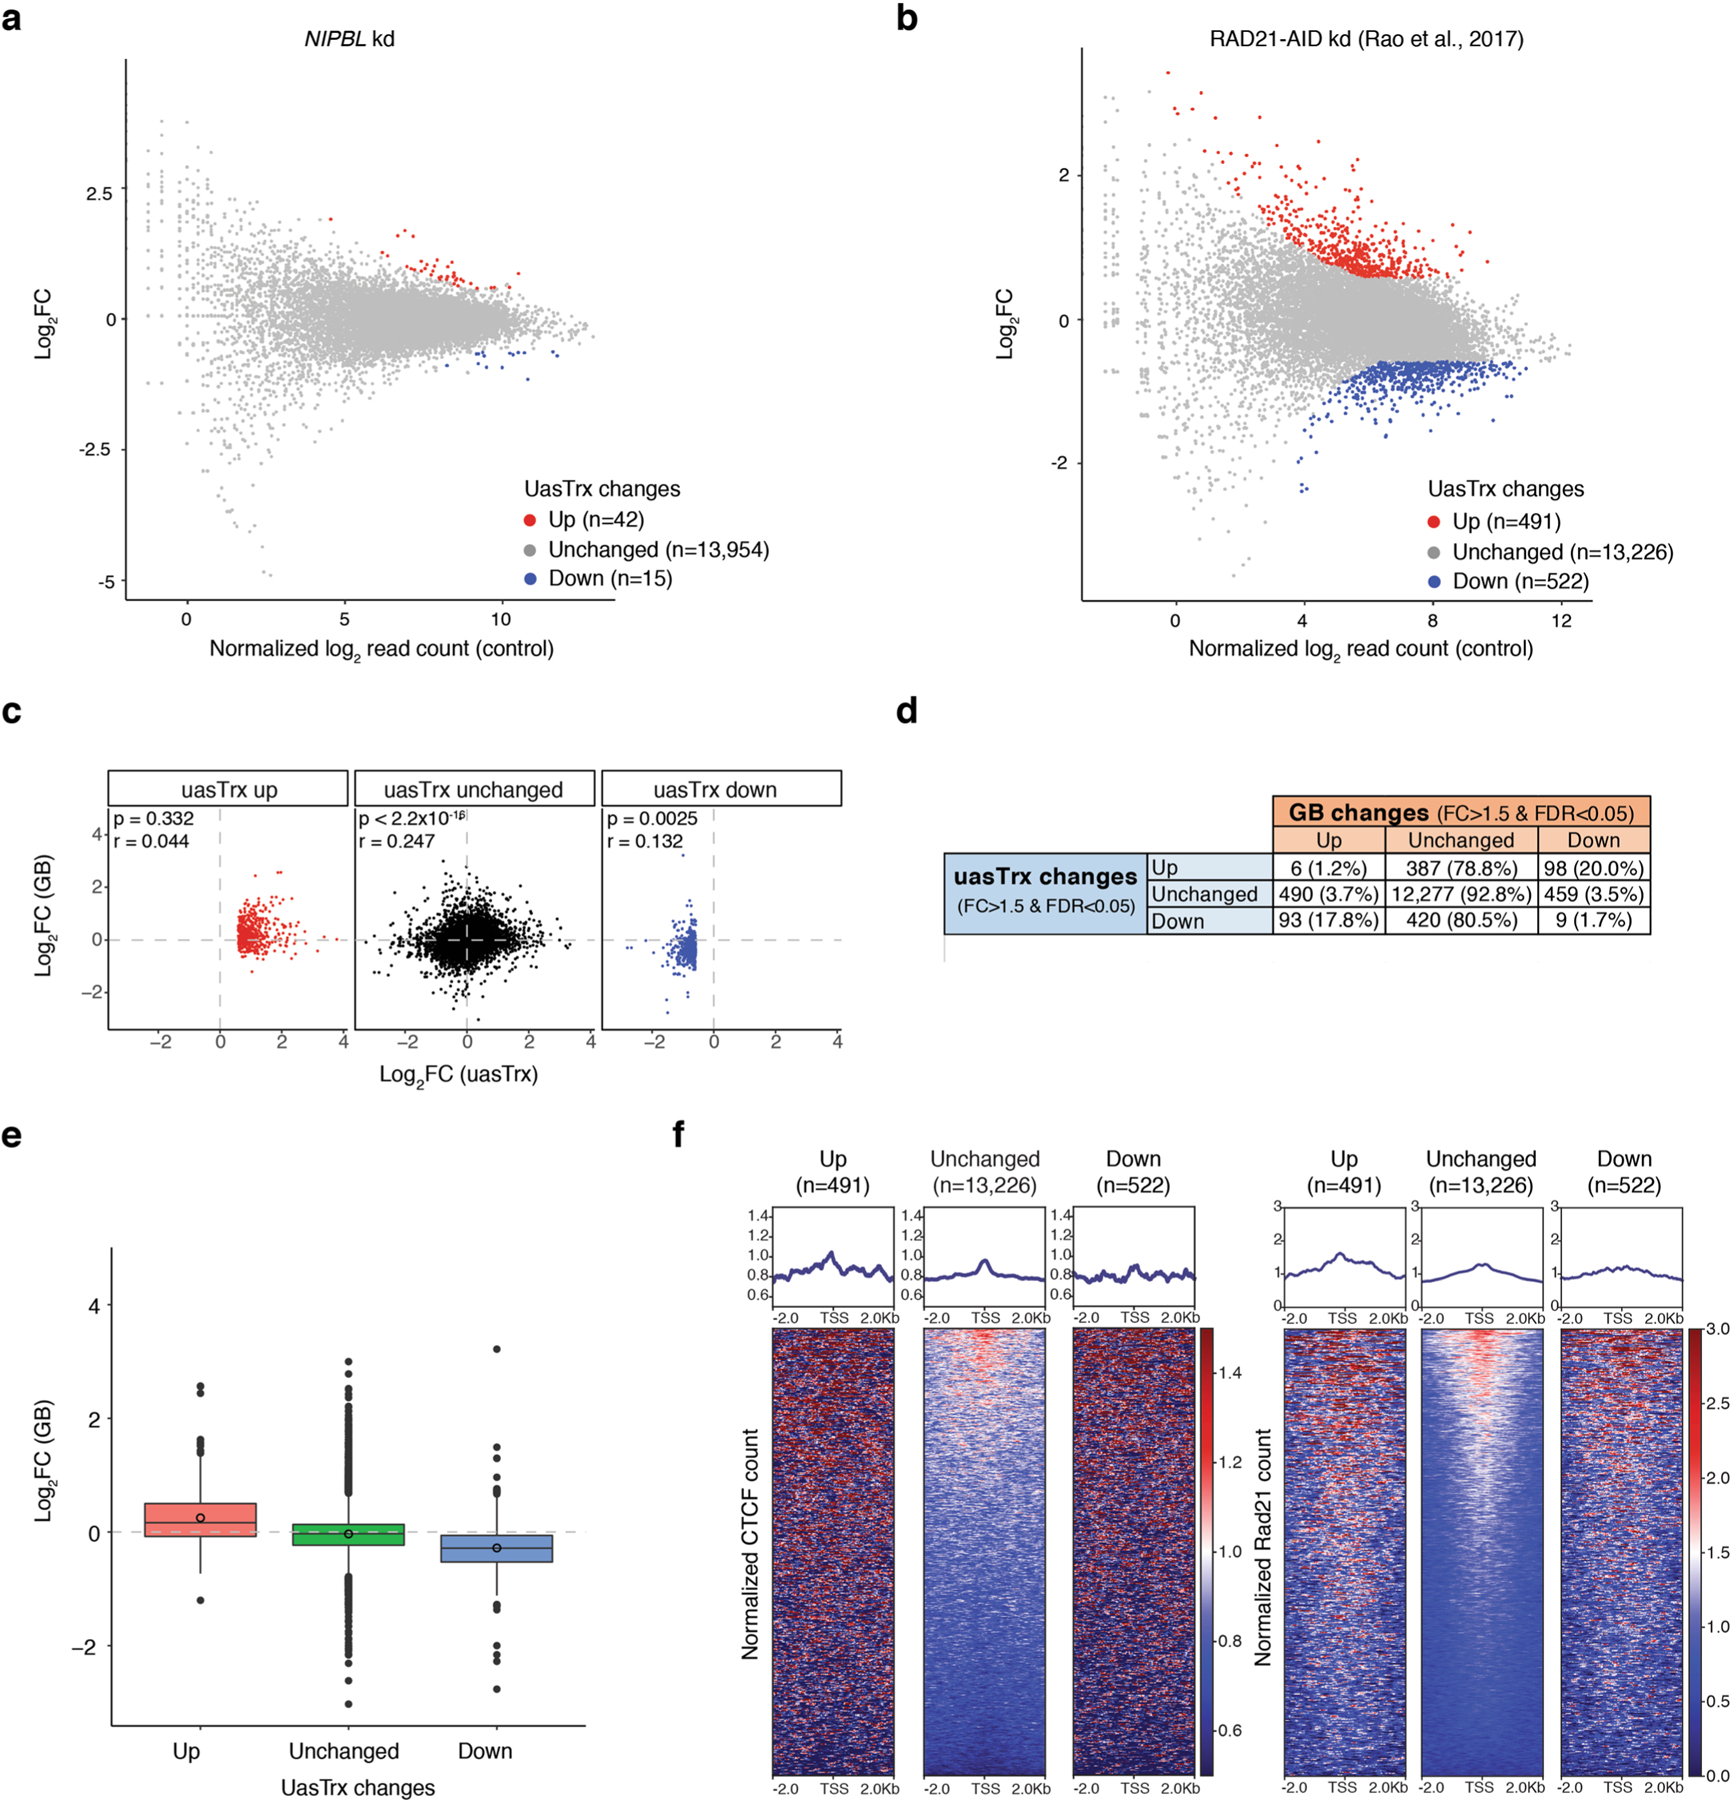
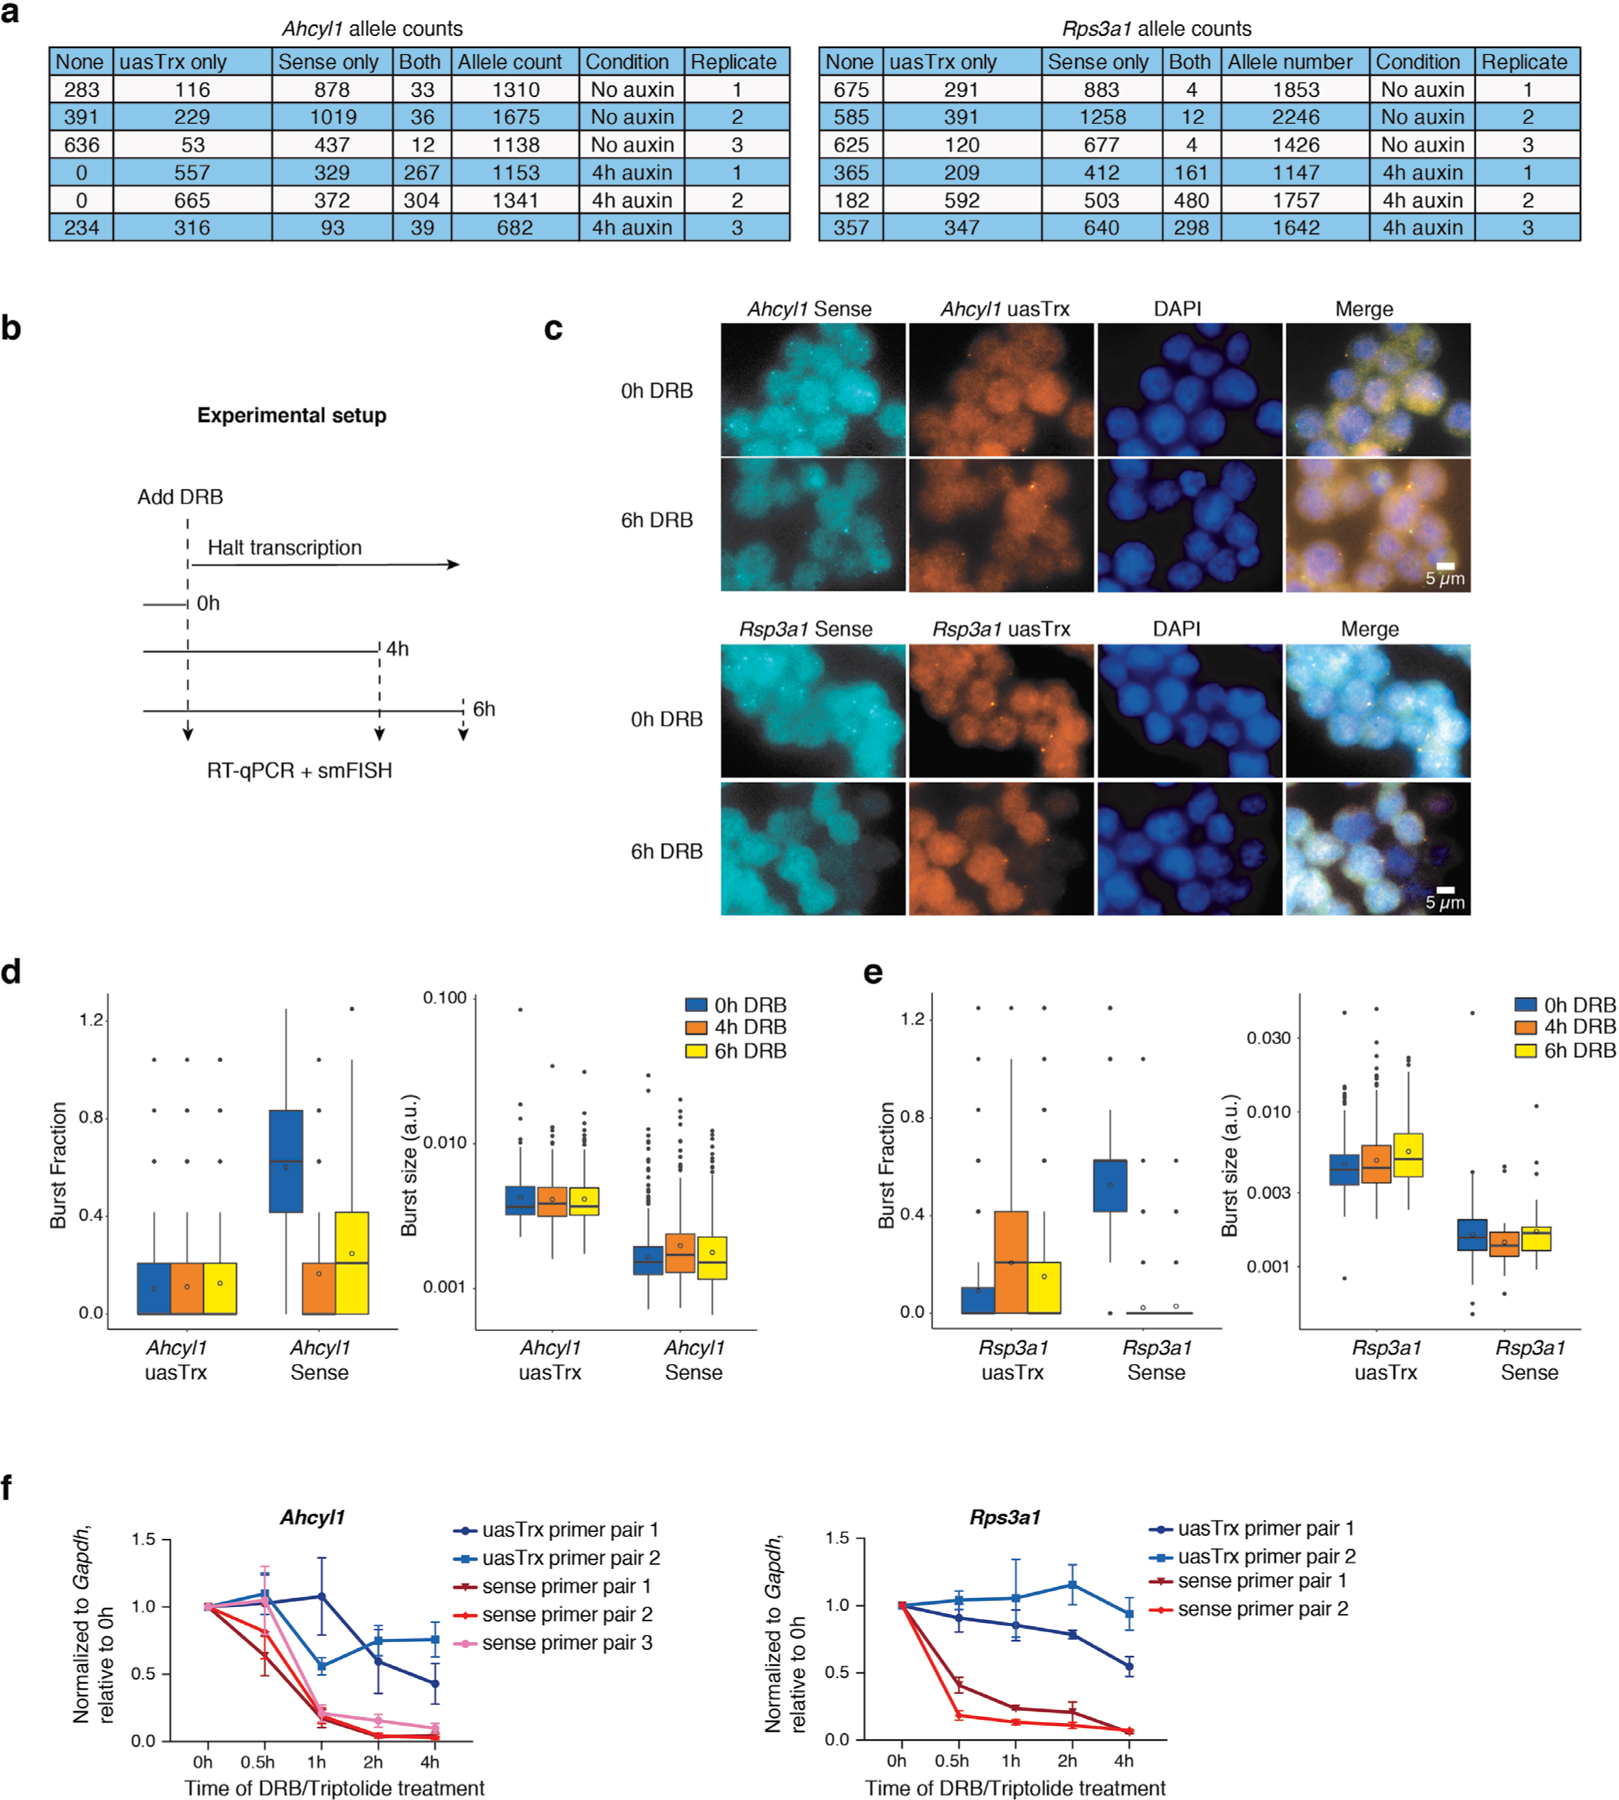
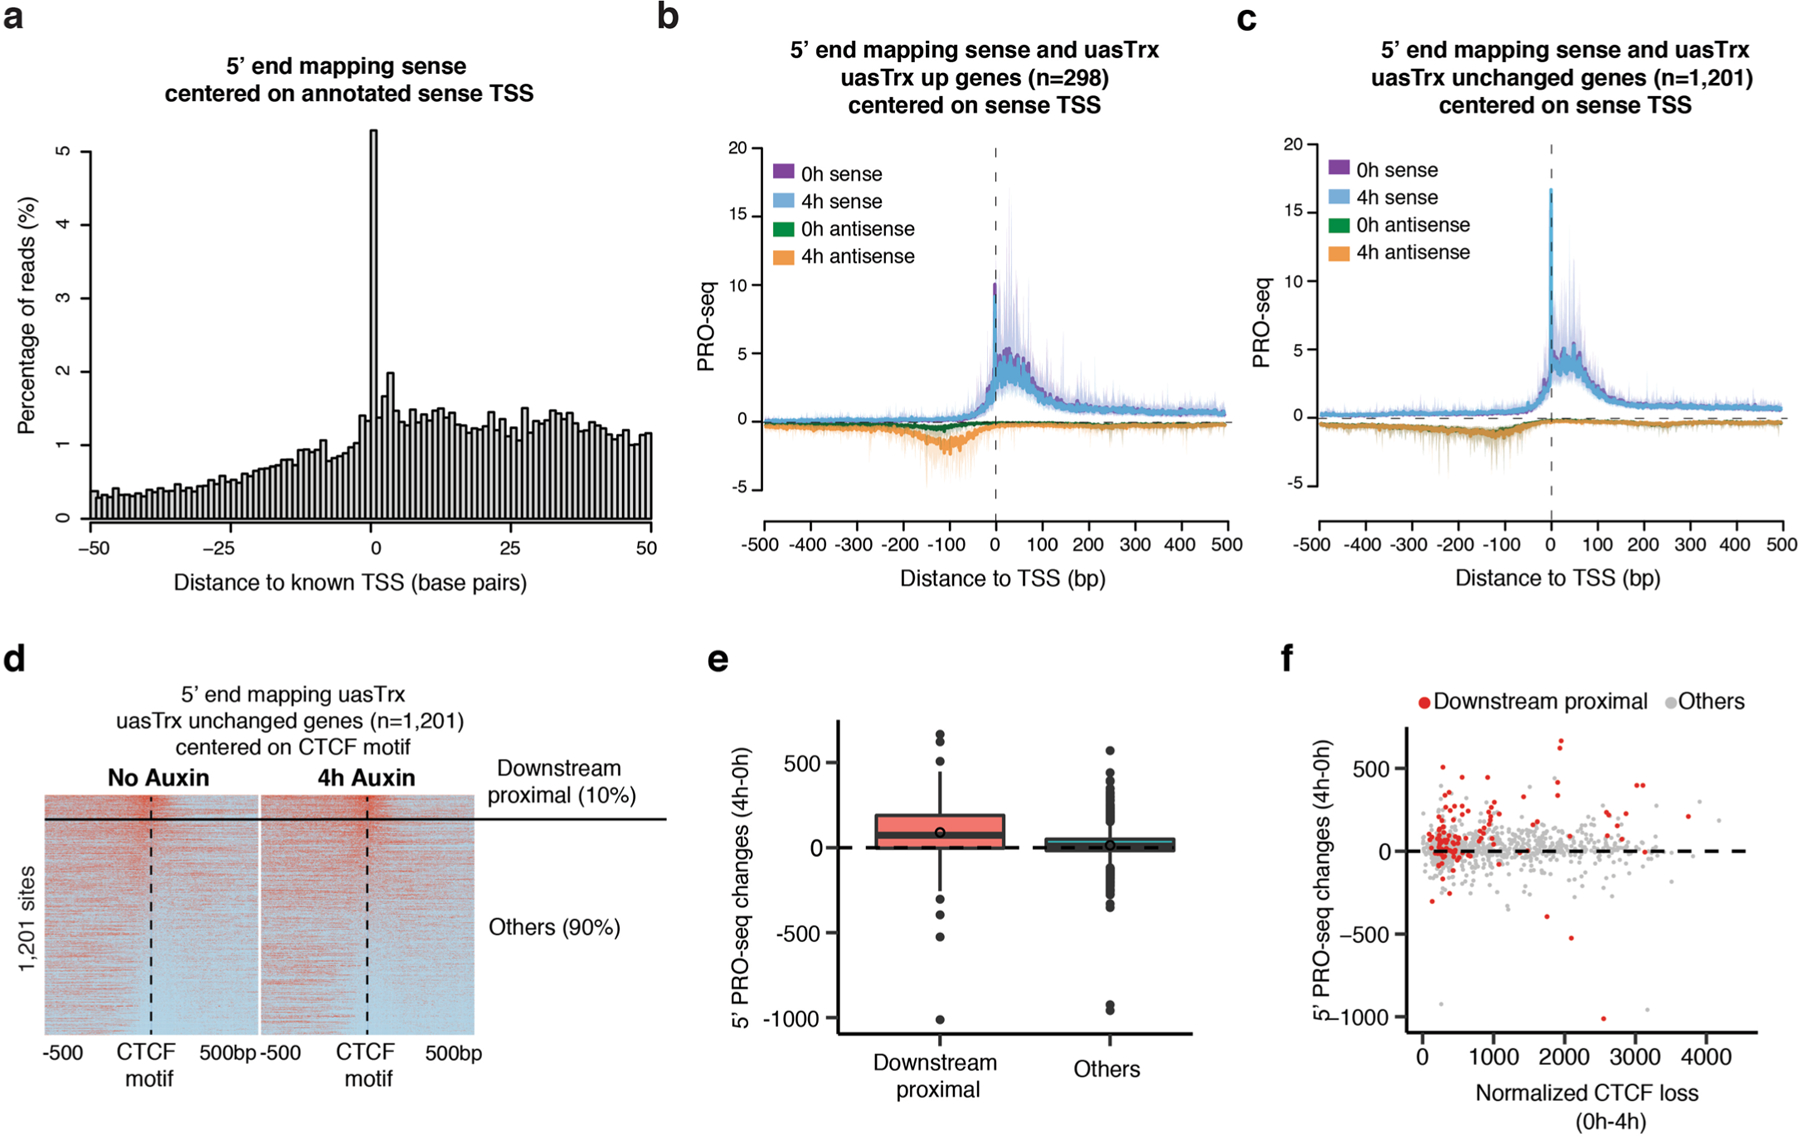
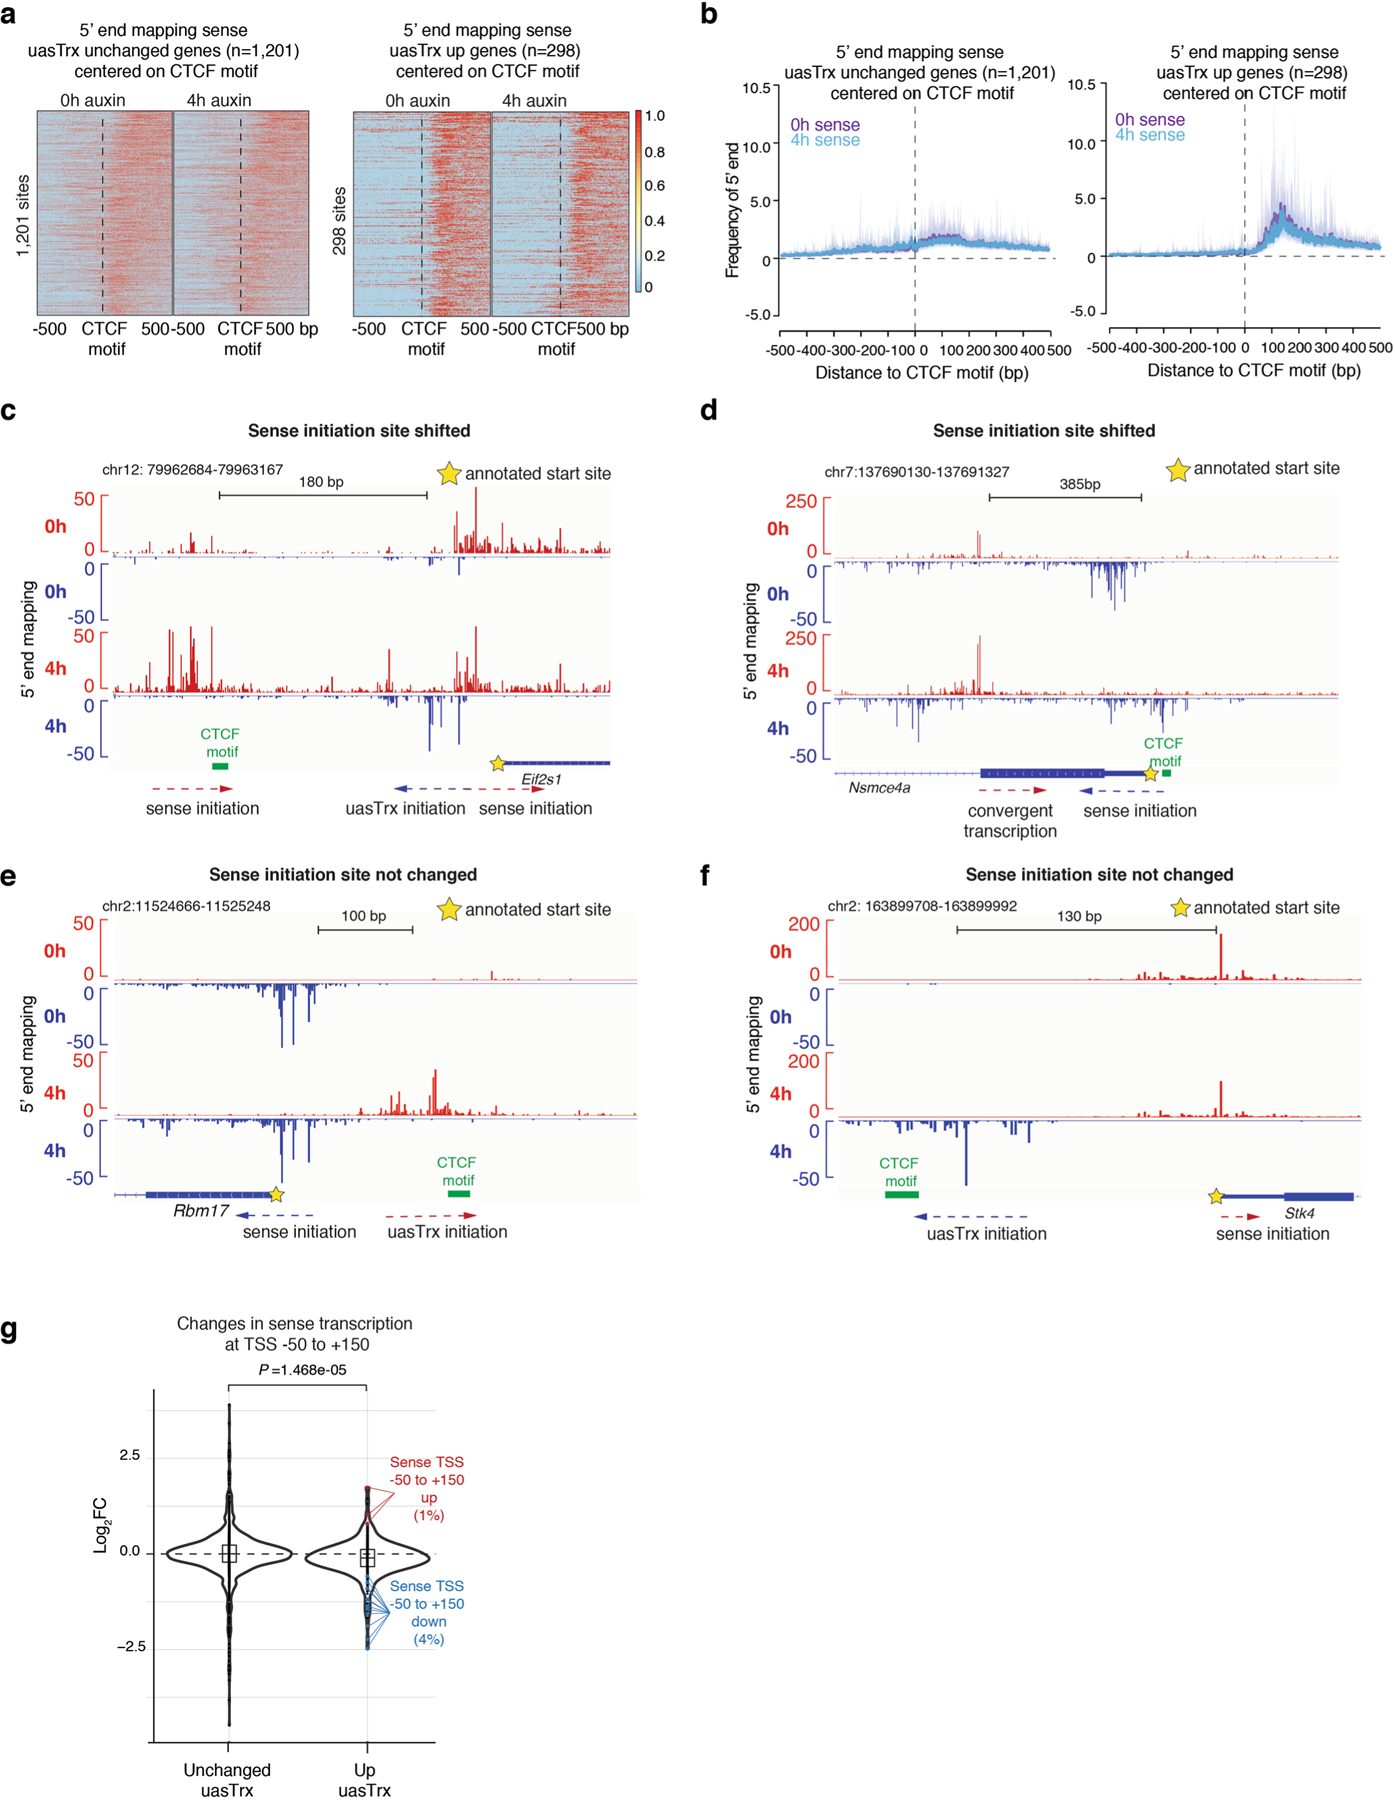
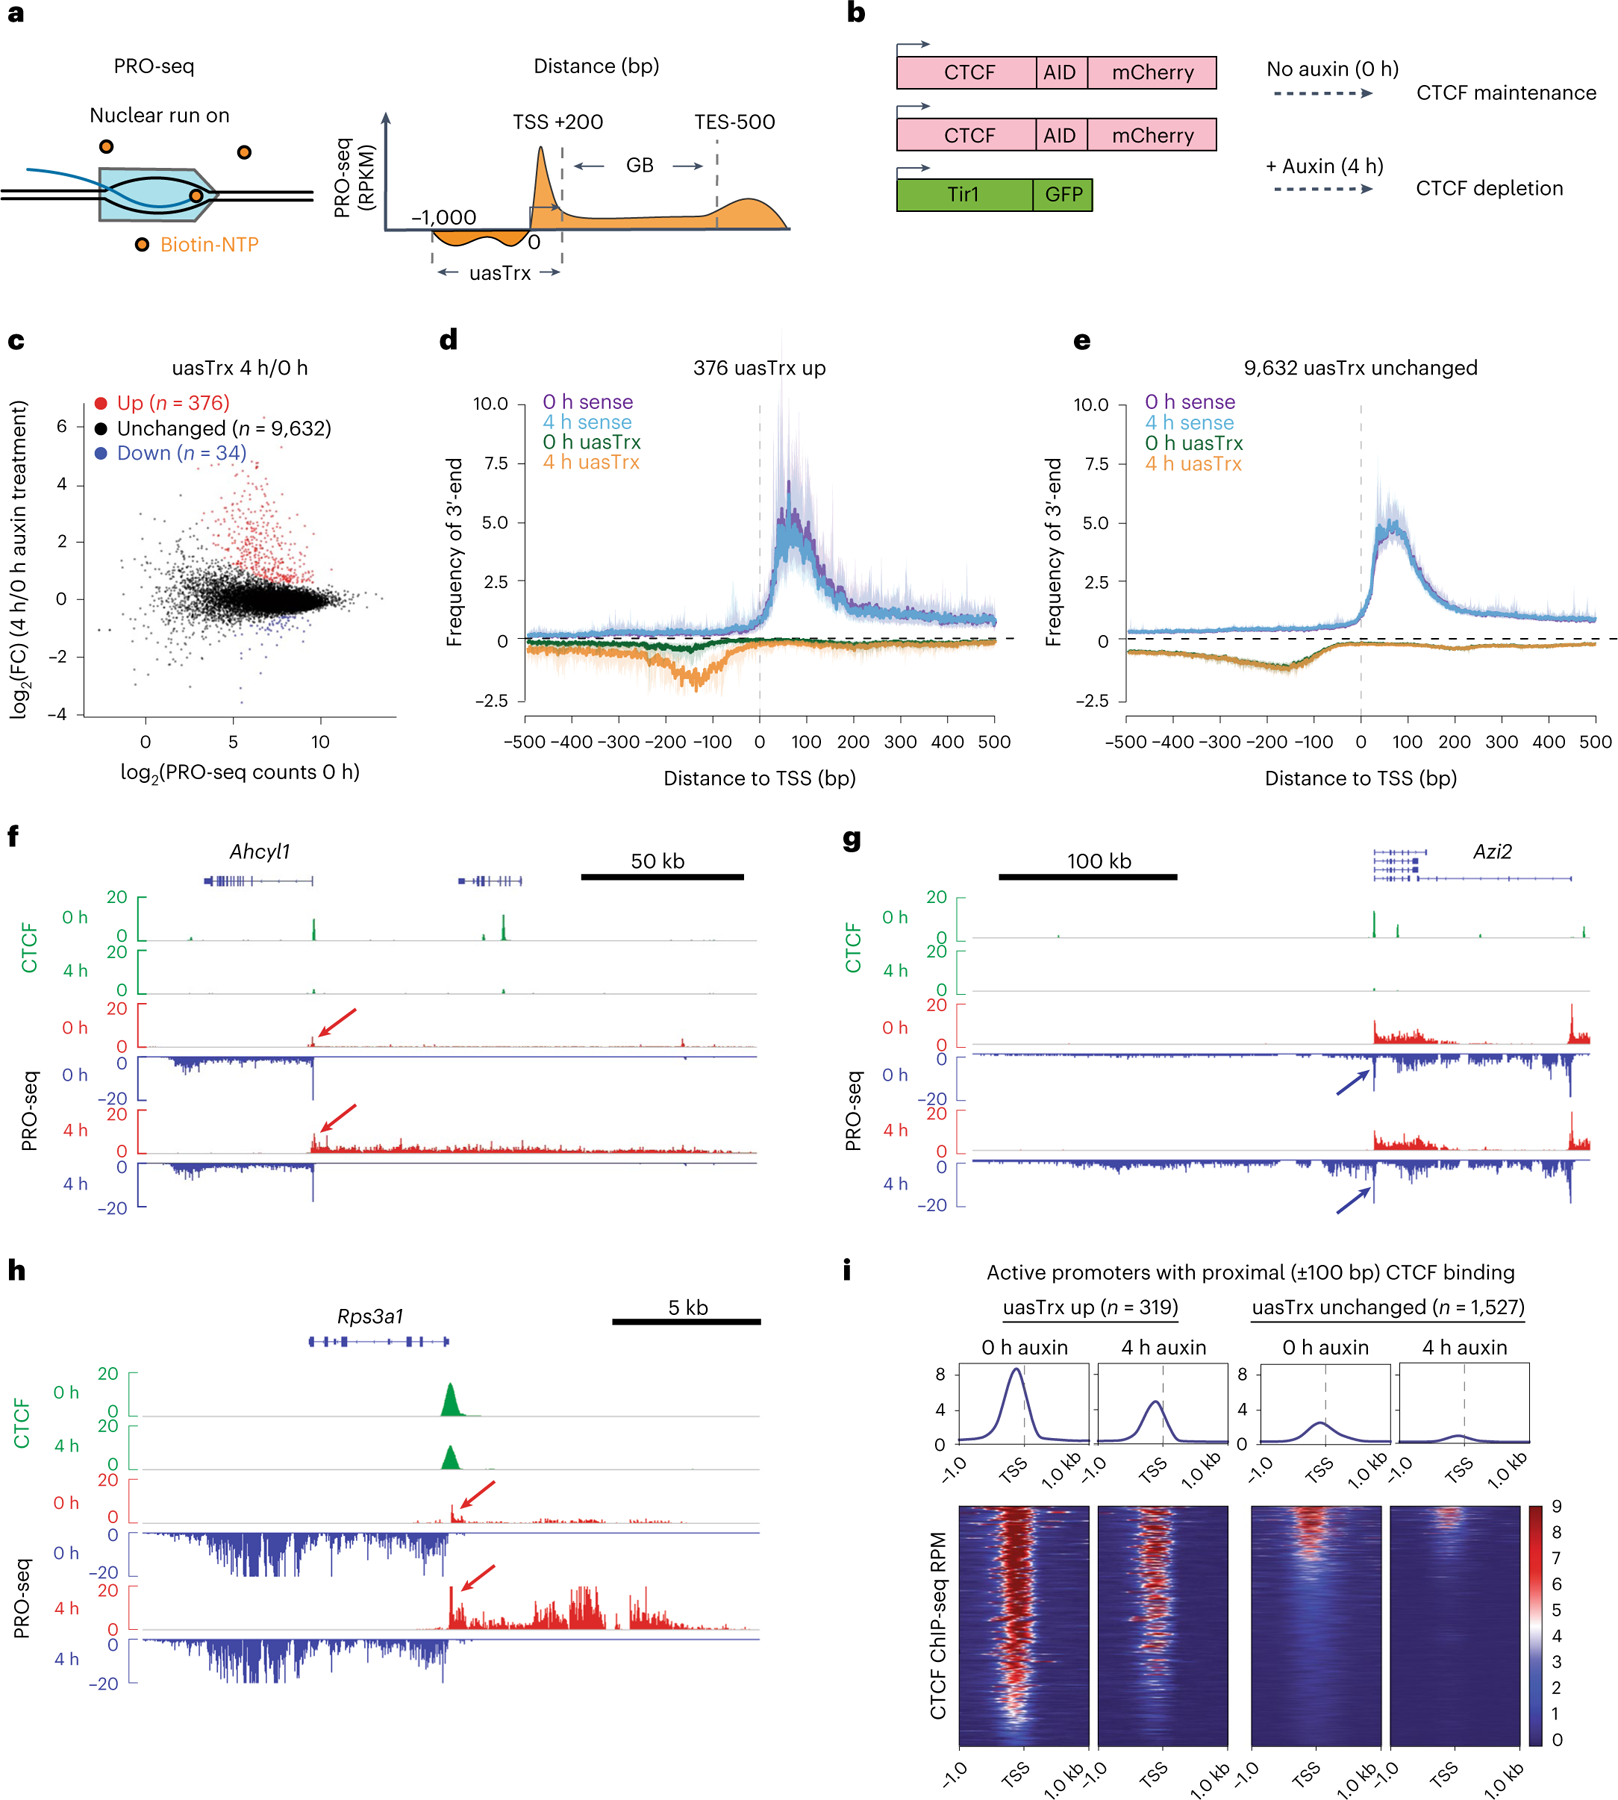
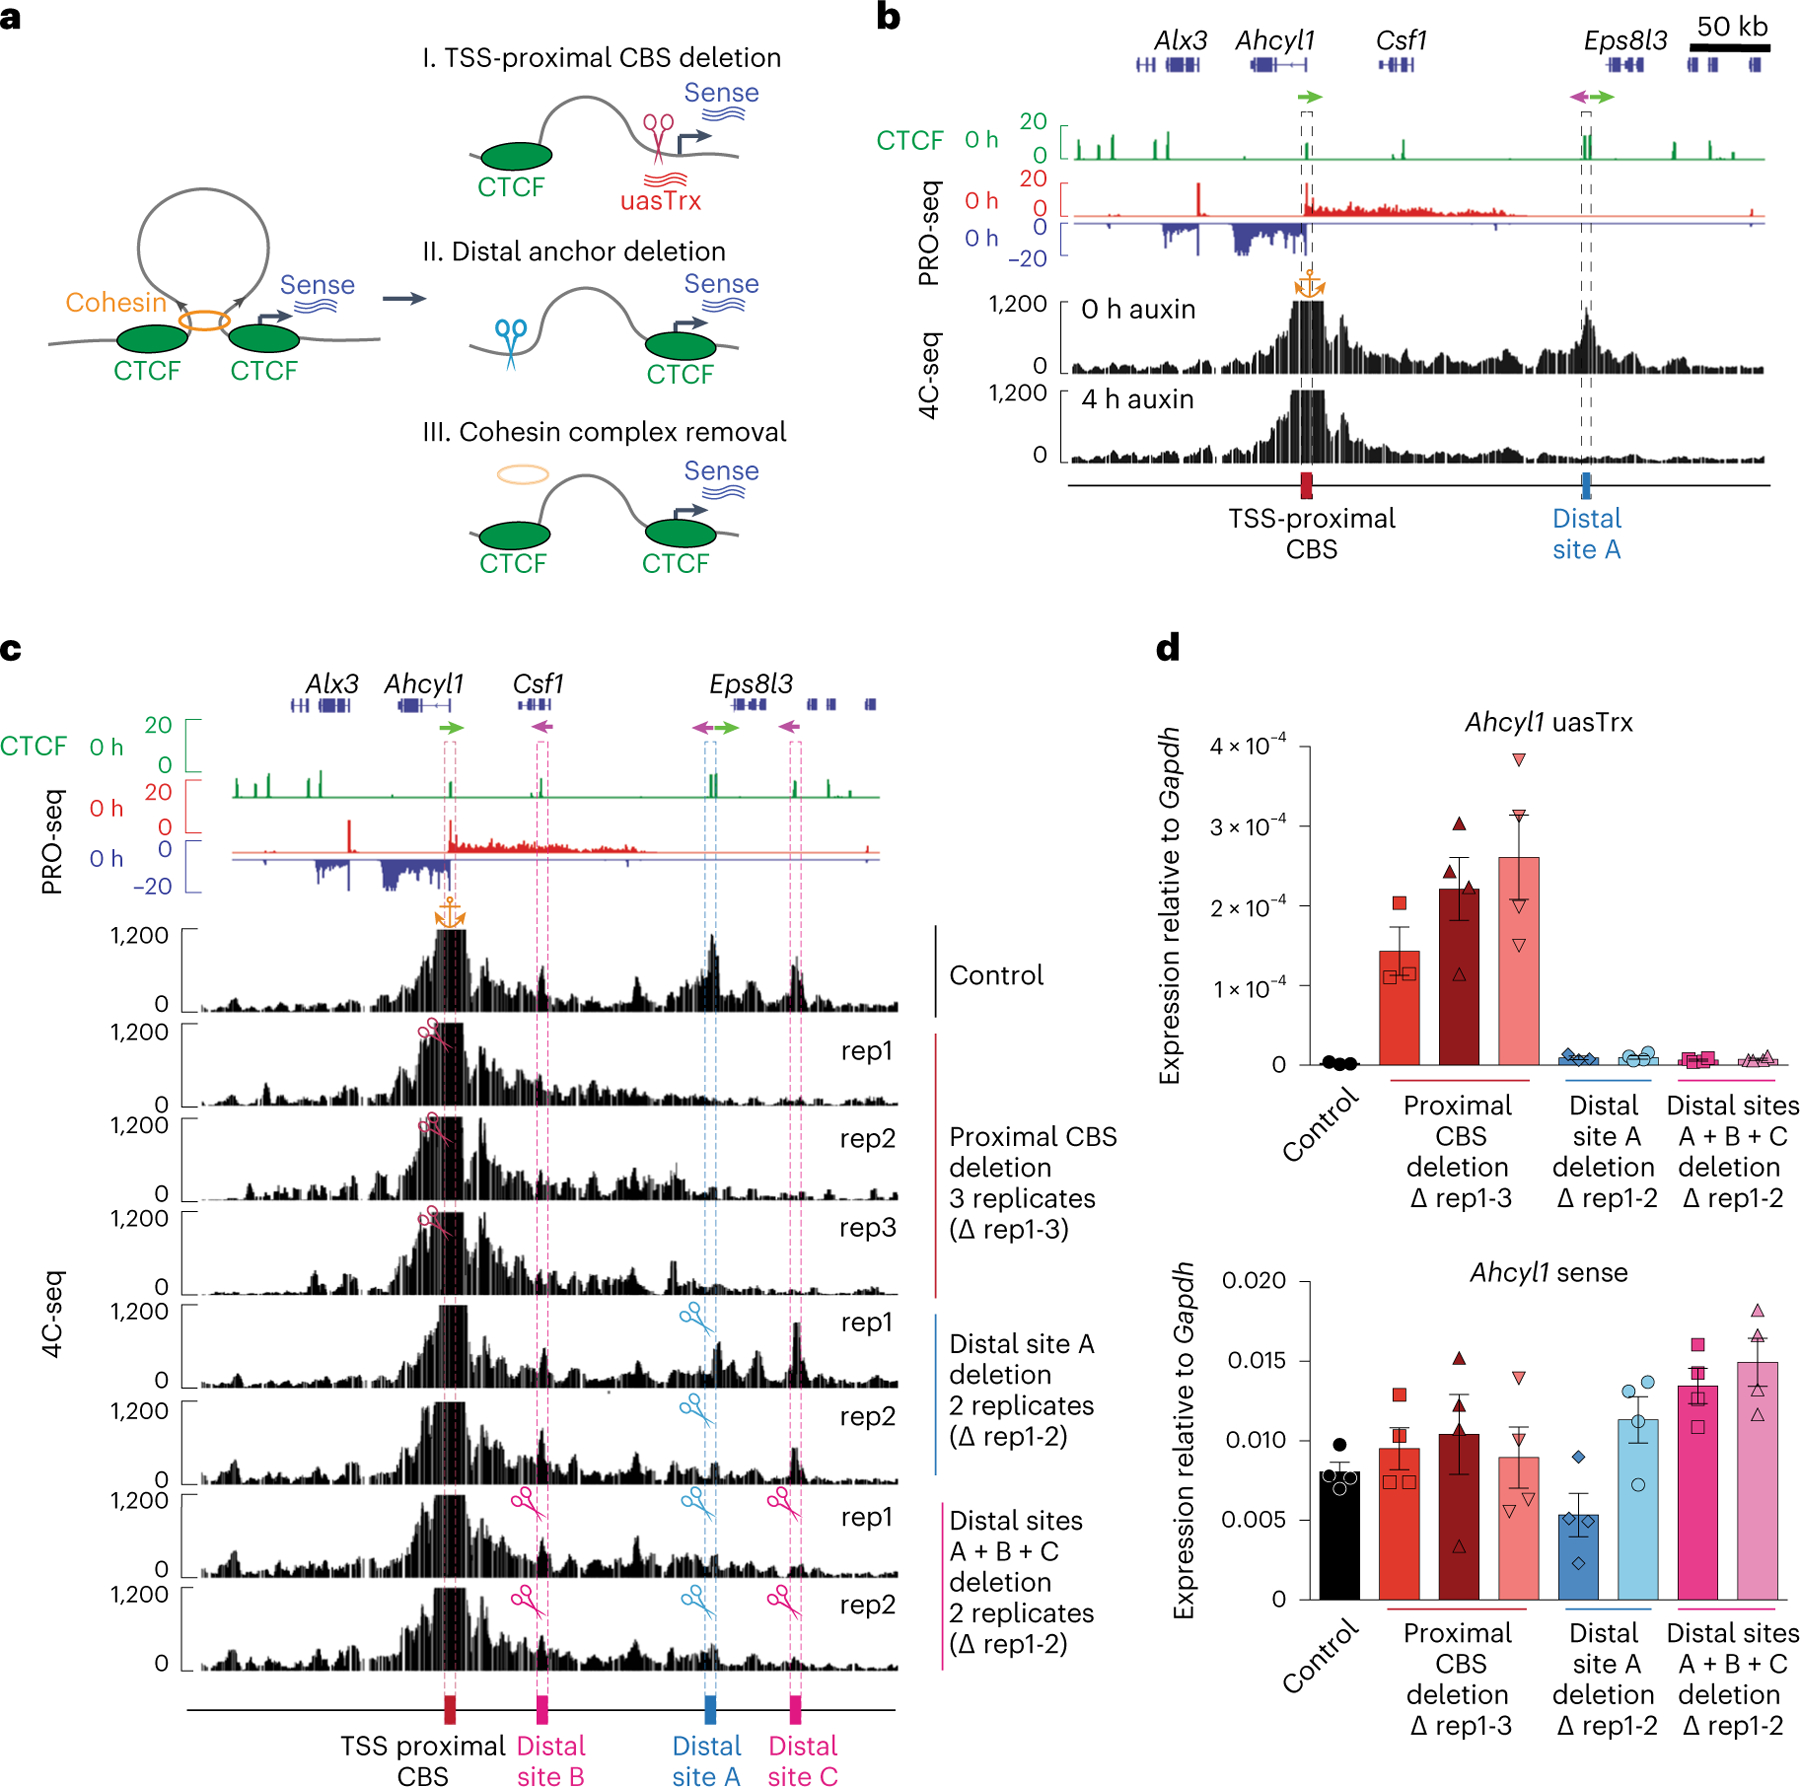
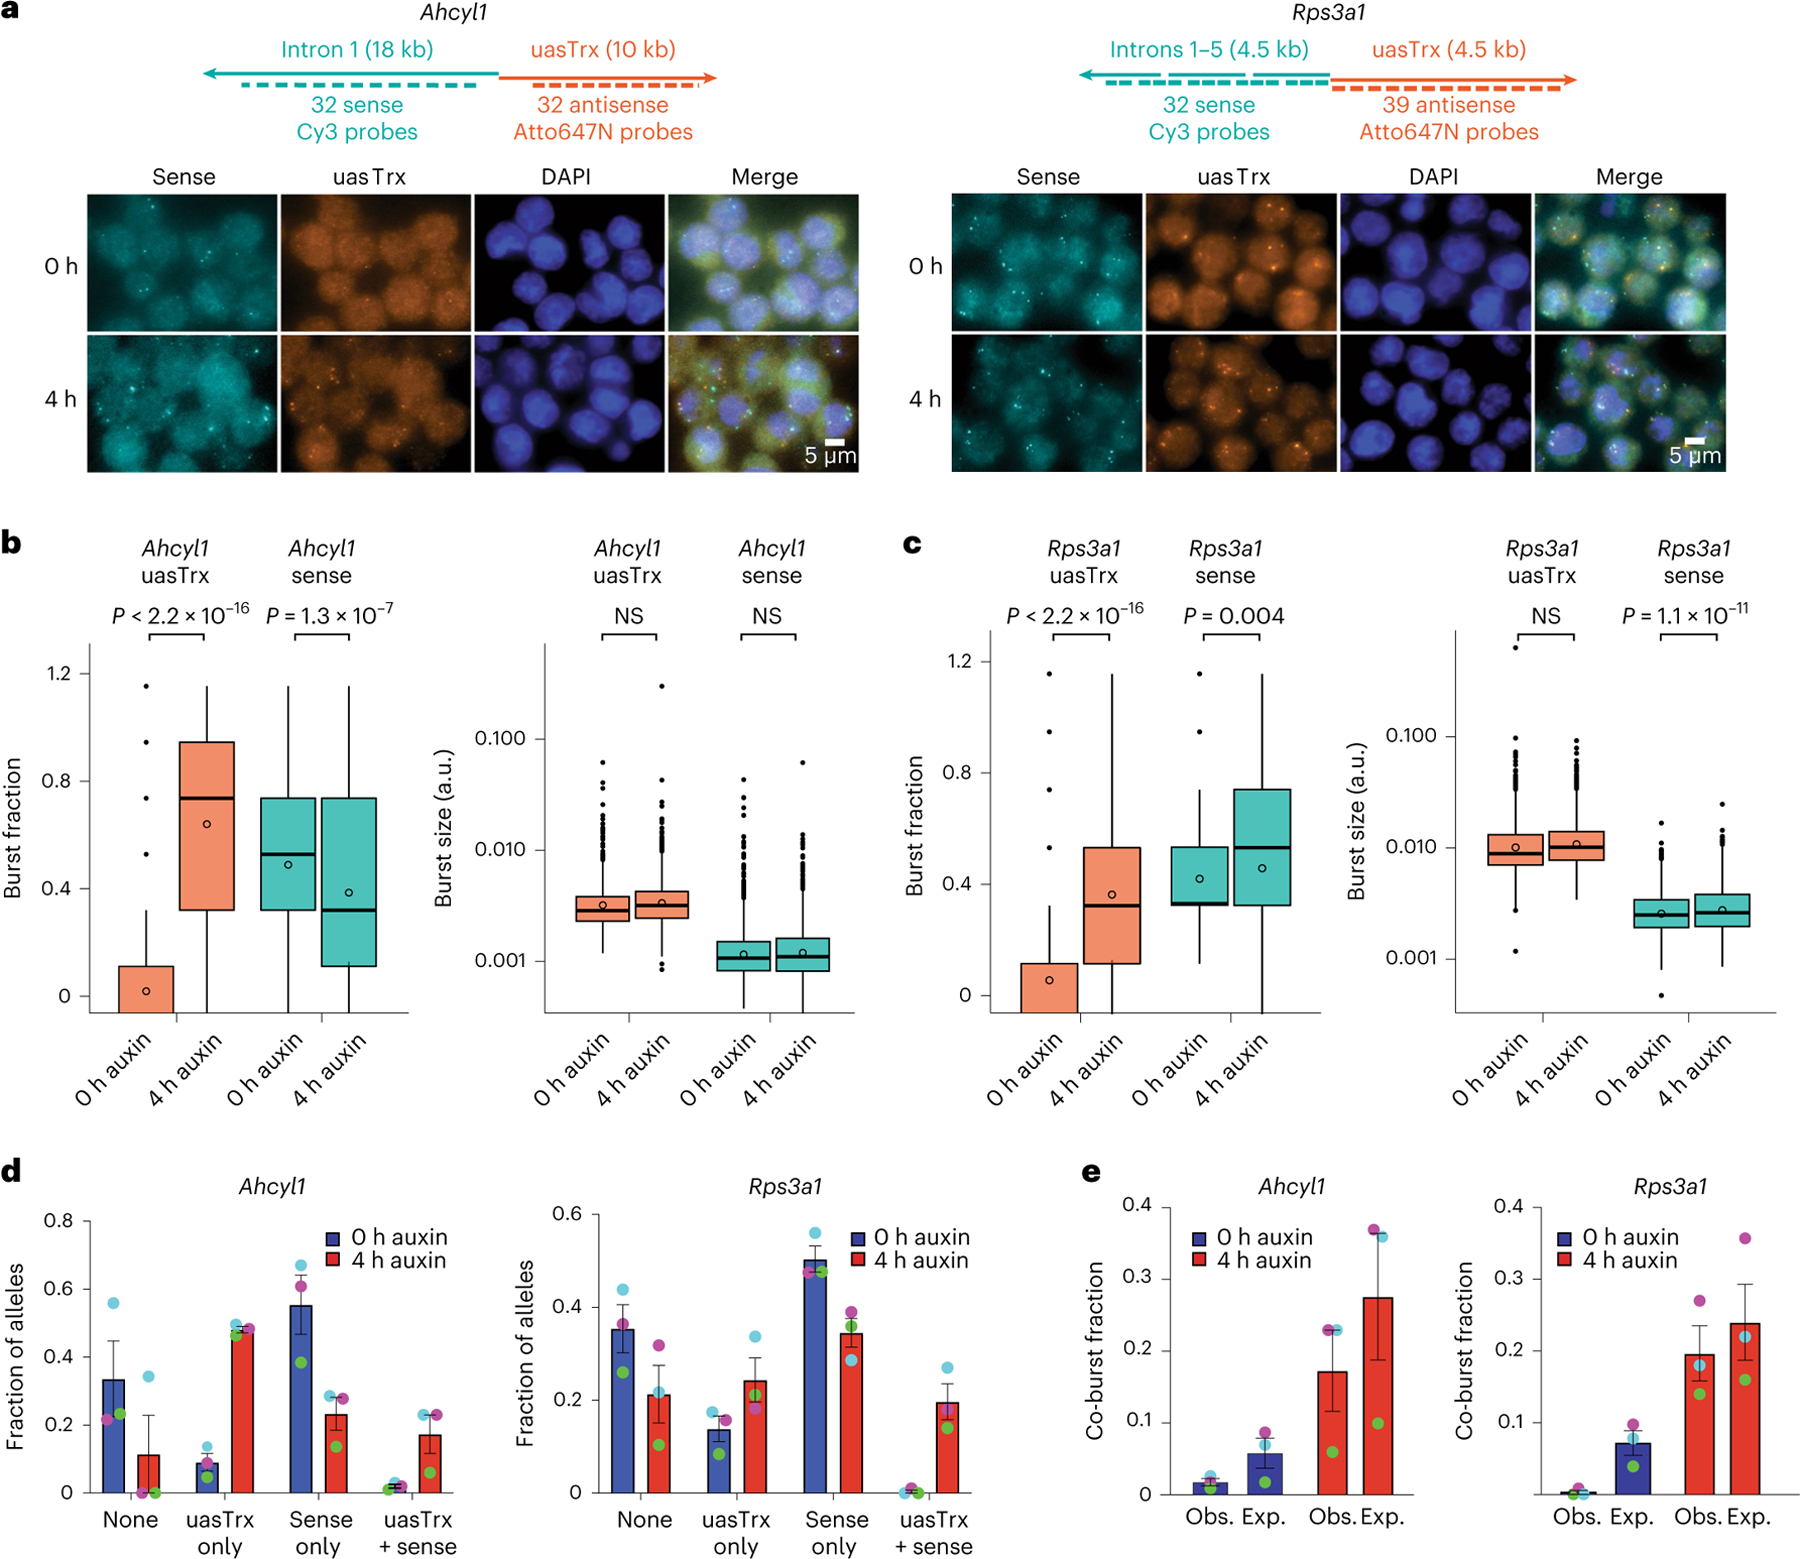
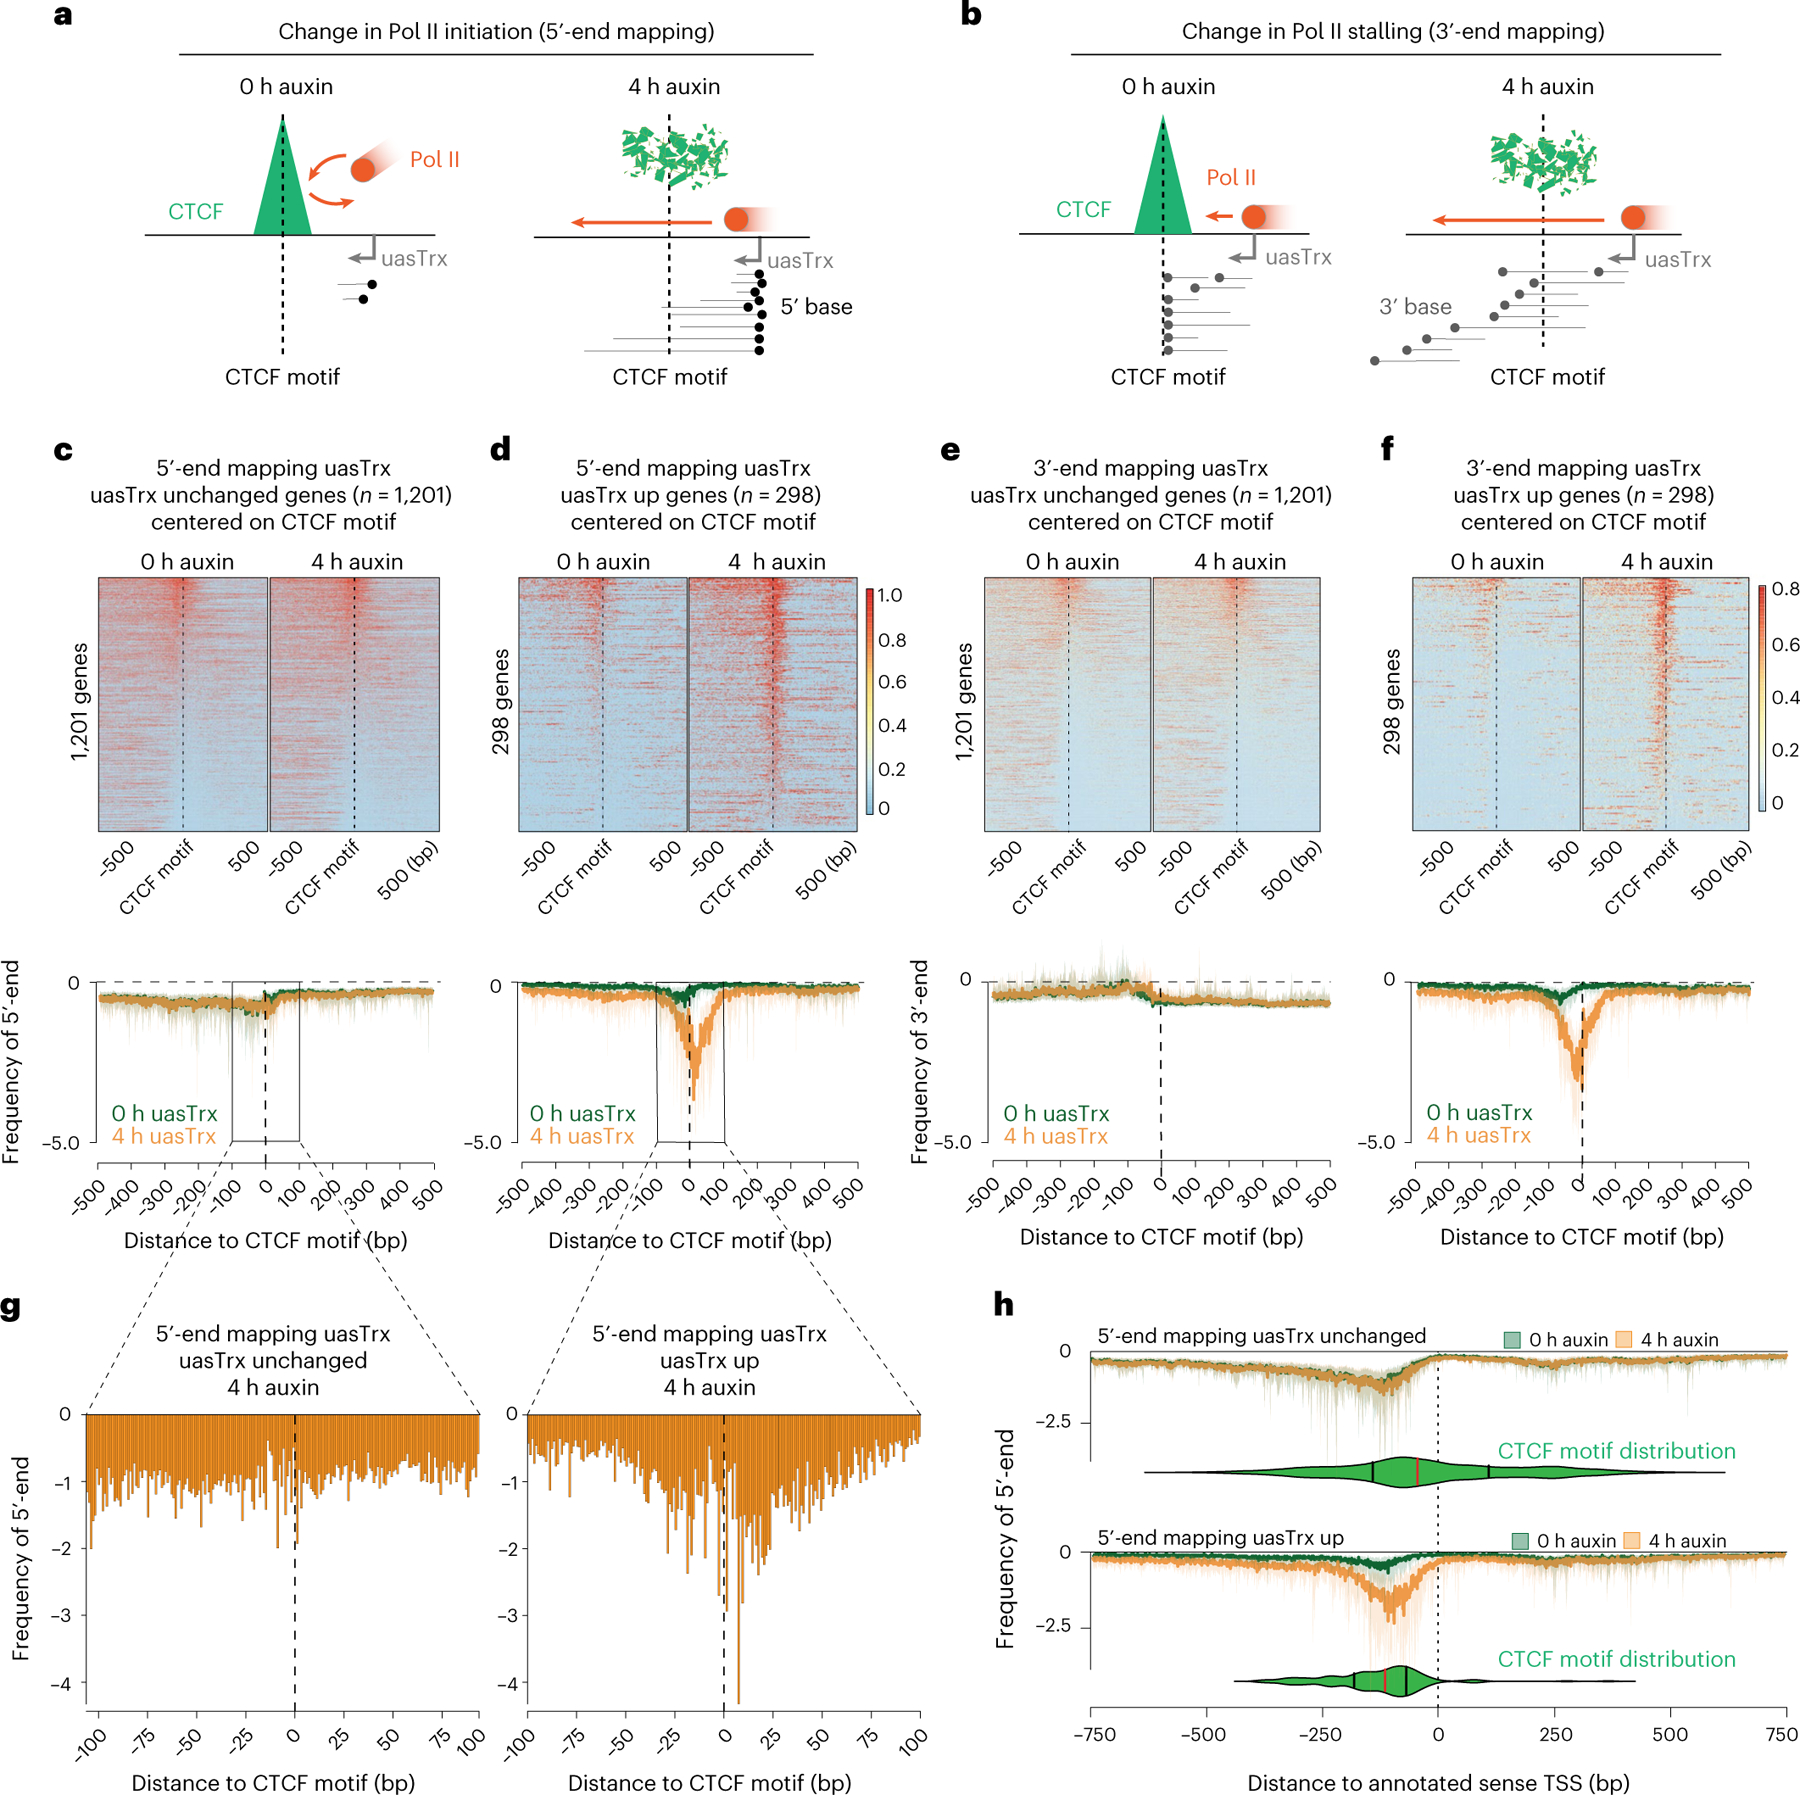
Transcription at most promoters is divergent, initiating at closely spaced oppositely oriented core promoters to produce sense transcripts along with often unstable upstream antisense transcripts (uasTrx). How antisense transcription is regulated and to what extent it is coordinated with sense transcription is not well understood. Here, by combining acute degradation of the multi-functional transcription factor CTCF and nascent transcription measurements, we find that CTCF specifically suppresses antisense but not sense transcription at hundreds of divergent promoters. Primary transcript RNA-FISH shows that CTCF lowers burst fraction but not burst intensity of uasTrx and that co-bursting of sense and antisense transcripts is disfavored. Genome editing, chromatin conformation studies and high-resolution transcript mapping revealed that precisely positioned CTCF directly suppresses the initiation of uasTrx, in a manner independent of its architectural function. In sum, CTCF shapes the transcriptional landscape in part by suppressing upstream antisense transcription.


Conflict of interest statement

Competing interests

The authors declare no competing interests.

Figures

Extended Data Fig. 1 |
Extended Data Fig. 1 |. CTCF depletion leads to widespread uasTrx upregulation at divergent promoters.
a, Distribution of uasTrx lengths, grouped by changes in response to CTCF depletion. b, Row-linked heatmaps showing Pol II occupancy at active promoters, grouped by antisense changes (up, n = 376; unchanged, n = 9,632) upon CTCF depletion, sorted by occupancy level, and shown with respect to sense orientation. c, RT–qPCR of uasTrx for Ahcyl1 at indicated time points after CTCF depletion. Transcripts were normalized to Gapdh (error bar: SEM; n = 4). d, same as (c) but quantifying nascent sense transcripts. e, Scatterplot comparing transcriptional changes in gene body (GB) versus uasTrx. Data points grouped and colored based on uasTrx changes. P values were calculated by Spearman rank correlation test, r is the correlation coefficient. f, Log-transformed PRO-seq fold changes in GB after CTCF depletion, grouped by uasTrx changes. Lower and upper box ends represent the first and third quartiles with the median indicated as a horizontal line within the box. Mean is indicated by a circle within the box. Whiskers define the smallest and largest values within 1.5 times the interquartile range below the first or above the third quartile, respectively. Outliers are plotted as individual dots. g, Transcriptional changes in uasTrx and GB after CTCF depletion. h, Percentage of promoters with and without proximal (±100 bp) CBSs as a function of uasTrx changes. i, Correlation between PRO-seq changes and CTCF loss at uasTrx with proximal (±100 bp) CTCF binding. Linear regression line shown in magenta. P values were calculated by Spearman rank correlation test, r is the correlation coefficient.
Extended Data Fig. 2 |
Extended Data Fig. 2 |. CTCF depletion in human HCT-116 and mESCs leads to antisense transcriptional changes.
a, Fraction of TSSs detected in the indicated numbers of mouse tissues where CTCF binds in proximity (within ± 100 bp), grouped by uasTrx changes. b, PRO-seq MA plot of control versus CTCF-depleted cells on the antisense strand (−1000 bp to +200 relative to annotated TSS) in human HCT-116 cells. Differentially expressed transcripts highlighted in color. c, Browser views of CTCF ChIP-seq (mm9 liftover from Rao et al., 2014) and PRO-seq signals at Gstp1 and Tap2 loci in HCT-116 cells. Arrows highlight location of CTCF-repressed uasTrx. Arrow color indicates uasTrx strandedness. kd, knockdown. d, RNA-seq MA plot of control versus CTCF-depleted cells on the antisense strand (−1000 bp to +200 relative to annotated TSS) in mESCs. Differentially expressed transcripts highlighted in color. e, Row-linked heatmaps showing CTCF occupancy at active promoters, grouped by uasTrx changes, sorted by binding enrichment levels, and shown with respect to sense orientation in HCT-116 cells and mESCs. f, Correlation between uasTrx and GB changes after CTCF depletion in PRO-seq data from HCT-116 cells, and RNA-seq data from mESCs. P value was calculated by Spearman rank correlation test; r is the correlation coefficient. g, Transcriptional changes in uasTrx and GB after CTCF depletion in PRO-seq from HCT-116 cells and RNA-seq data from mESCs. h, Log-transformed PRO-seq and RNA-seq fold changes in GB after CTCF depletion in HCT-116 cells and mESCs, respectively. Lower and upper box ends represent the first and third quartiles with the median indicated as a horizontal line within the box. Mean is indicated by a circle within the box. Whiskers define the smallest and largest values within 1.5 times the interquartile range below the first or above the third quartile, respectively. Outliers are plotted as individual dots. i, Log-transformed RNA-seq fold change in uasTrx in indicated conditions over control in mESCs. j, Brower views of CTCF ChIP-seq and RNA-seq signals at Ahcyl1, Azi2 and Rps3a1 loci in mESCs. Orange to yellow boxes and black arrow indicate (direction of) uasTrx.
Extended Data Fig. 3 |
Extended Data Fig. 3 |. Affected promoters are associated with architectural features.
a, Row-linked heatmaps showing RAD21 occupancy at sites with proximal (±100 bp) CTCF binding (up, n = 319; unchanged, n = 1,527), grouped by CTCF depletion-elicited uasTrx changes, sorted in the same order as Fig. 1i, and shown with respect to sense orientation. b, Distribution of looping frequencies of upregulated versus unchanged uasTrx with proximal (±100 bp) CTCF binding. P value calculated by Wilcoxon signed-rank test. c, Averaged insulation score centered at annotated TSS with proximal CTCF binding (up n = 319, unchanged n = 1,527) over 0.2 Mb window, plotted with respect to sense orientation, and grouped by uasTrx changes. d, Gene ontology terms enriched at genes with activated uasTrx. e, Genome browser views of CTCF ChIP-seq, PRO-seq and 4C-seq signals at Azi2. 4C-seq anchored at Azi2 promoter with (4 h auxin) and without (0 h auxin) CTCF degradation. Orange anchor indicates 4C-seq viewpoint. Sites of interest are indicated below the track and highlighted by dashed boxes. f, Same as in (e) for the Rps3a1 locus. g, Genome browser views of bulk CTCF ChIP-seq and PRO-seq at the Ahcyl1 locus. Predicted CTCF motif is highlighted in green and genotype of edited Ahcyl1 clones shown in Fig. 2c is depicted. h, Genotype of Azi2 TSS-proximally edited clones. Predicted CTCF motif highlighted in green. i, Left, CTCF ChIP-qPCR showing abrogation of CTCF binding at Ahcyl1 TSS-proximal CBS in mutants shown in Fig. 2c. Right, Ahcyl1 distal CBS served as a control for ChIP efficiency (error bar: SEM; n = 3). j, Same as in (i) for Azi2 TSS-proximal CBS.
Extended Data Fig. 4 |
Extended Data Fig. 4 |. CRISPR/Cas9-mediated deletion of TSS-proximal CBS leads to uasTrx activation.
a, Genome browser tracks of CTCF ChIP-seq and PRO-seq shown at the Azi2 locus on top. Representative 4C-seq profiles of control/mutant Azi2 clones. Regions of interest are indicated below tracks and highlighted by dashed boxes. Similar observations were made in 2 independent 4C-seq experiments. Orange anchor indicates 4C-seq viewpoint. Scissors indicate CRISPR/Cas9-edited region. b, RT–qPCR of Ahcyl1 uasTrx in control and edited clones. Transcripts were normalized to Gapdh (error bar: SEM; n = 4, except for uasTrx control, proximal and distal CBS deletion rep1 for which n = 3). c, same as in (b) for sense Ahcyl1 transcripts. d, RT–qPCR of Azi2 uasTrx in control and edited clones. Transcripts were normalized to Gapdh (error bar: SEM; n = 4 for primer pair 1, n = 2 for primer pair 2). e, same as in (d) for sense Azi2 transcripts. f, Genotype of Rps3a1 TSS-proximal CBS edited clones. Predicted CTCF motif highlighted in green. g, Left, CTCF ChIP-qPCR showing abrogation of CTCF binding at Rps3a1 TSS-proximal CBS in mutants. Right, distal CBS served as a control for ChIP efficiency (error bar: SEM; n = 3). h, RT–qPCR of Rps3a1 uasTrx in control and edited clones. Transcripts were normalized to Gapdh (error bar: SEM; n = 3). i, same as in (h) for sense Rps3a1 transcripts.
Extended Data Fig. 5 |
Extended Data Fig. 5 |. CRISPR/Cas9-mediated deletion of distal CBS does not lead to uasTrx activation.
a, Genotype of distal site A edited Ahcyl1 clones shown in Fig. 2c. Predicted CTCF motif is highlighted in green. b, Left, CTCF ChIP-qPCR showing abrogation of CTCF binding at distal anchor A in clones distal site A rep1 and 2 shown in Fig. 2c (error bar: SEM; n = 2). Right, proximal CBS served as a control for ChIP efficiency (error bar: SEM; n = 2). c, Same as in (a) for Ahcyl1 distal site B. d, same as in (a) for Ahcyl1 distal site C. e, same as in (b) for Ahcyl1 distal site B and C. f, Genotype of distal site A and B edited Azi2 clones.
Extended Data Fig. 6 |
Extended Data Fig. 6 |. Removal of chromatin-bound cohesin does not recapitulate CTCF-induced uasTrx changes.
a, PRO-seq MA plot of control versus NIPBL-depleted HCT-116 cells on uasTrx expression (−1000 bp to +200 relative to annotated TSS). Differentially expressed transcripts highlighted in color. b, Same as (a) but of RAD21-depleted HCT-116 cells. c, Scatterplot comparing log-transformed 5’ PRO-seq fold changes in uasTrx and GB. P value was calculated by Spearman rank correlation test; r is the correlation coefficient. d, Table showing the number and percentage of uasTrx and GB changes after RAD21 depletion in HCT-116 cells. e, Box plot showing log-transformed PRO-seq fold changes in GBs after RAD21 depletion in HCT-116 cells. Lower and upper box ends represent the first and third quartiles with the median indicated as a horizontal line within the box. Mean is indicated by a circle within the box. Whiskers define the smallest and largest values within 1.5 times the interquartile range below the first or above the third quartile, respectively. Outliers are plotted as individual dots. f, Left, row-linked heatmap showing CTCF occupancy at active promoters, grouped by uasTrx changes after RAD21 depletion, sorted by occupancy levels, and shown with respect to sense orientation. Right, same as left, but plotting RAD21 occupancy. Note that neither CTCF nor RAD21 is enriched at genes with upregulated uasTrx.
Extended Data Fig. 7 |
Extended Data Fig. 7 |. CTCF inhibits antisense burst fraction; sense/antisense co-bursting is disfavored.
a, Table showing raw smFISH allele counts. b, Experimental outline for RNA half-life estimation. c, Representative smFISH images of 3 independent replicates before and after DRB treatment at Ahcyl1 and Rps3a1. d, Left, box plot showing uasTrx and sense burst fractions at Ahcyl1 before and after DRB treatment. Right, same as left but quantifying burst sizes. Lower and upper box ends represent the first and third quartiles with the median indicated as a horizontal line within the box. Mean is indicated by a circle within the box. Whiskers define the smallest and largest values within 1.5 times the interquartile range below the first or above the third quartile, respectively. Outliers are plotted as individual dots. P values were calculated by two-sample t-test. e, Same as (d) but for Rps3a1. f, RT–qPCR measuring nascent sense and uasTrx levels at Ahcyl1 and Rps3a1 before and after DRB treatment. Transcripts were normalized to Gapdh and plotted relative to time 0 h (error bar: SEM; n = 4).
Extended Data Fig. 8 |
Extended Data Fig. 8 |. CTCF inhibits antisense transcription initiation through precise positioning.
a, 5’ end mapping in a 100 bp window of sense reads on a training set of 1,395 TSSs with the highest PRO-seq reads mapped to ±50 bp around the TSS and no other start sites within 1000 base pairs. b, Metaplot of sense and antisense 5’ end PRO-seq mapping, centered at annotated sense TSSs and plotted with respect to sense orientation for genes with upregulated uasTrx. Solid lines and shades show average signals and the 12.5/87.5 percentiles, respectively. c, Same as in (b) for unchanged uasTrx genes. d, heatmap of 5’ end mapping at unchanged promoters with a portion of sites (10%; ‘downstream proximal’) manually picked from the rest (‘others’), which demonstrates a CTCF distribution similar to that at uasTrx up genes. e, Related to (d), plotting PRO-seq changes in uasTrx at unaffected promoters, grouped based on CTCF positioning relative to 5’ PRO-seq signals. Lower and upper box ends represent the first and third quartiles with the median indicated as a horizontal line within the box. Whiskers define the smallest and largest values within 1.5 times the interquartile range below the first or above the third quartile, respectively. Outliers are plotted as individual dots. f, Related to (d), comparing uasTrx changes and CTCF binding loss at unaffected promoters, grouped based on CTCF positioning relative to 5’ PRO-seq signals.
Extended Data Fig. 9 |
Extended Data Fig. 9 |. Sense transcription initiation mostly unaffected upon uasTrx increase.
a, Heatmap of 5’ end mapping at genes with unchanged uasTrx (n = 1,201) that exhibit proximal CTCF binding and high-confidence CTCF motif(s) (motif prediction score>75), centered on CTCF motifs, sorted by mean antisense signal densities over the center 200 bp and shown with respect to sense orientation. Black line highlights CTCF motif locations. b, Metaplot of data in (a). c, 5’ end mapping of sense and uasTrx transcription at the Eif2s1 gene. Yellow star indicates annotated sense TSS, CTCF motif indicated in green. d, Same as in (c) for Nsmce4a. e, Same as in (c) for Rbm17. f, Same as in (c) for Stk4. g, Violin plot showing sense changes at TSS −50 to +150 bp. P value comparing conditions was calculated using a Wilcoxon rank sum test. Significant differentially enriched TSSs are indicated in colors. Boxes within violins represent first and third quartiles with the median indicated as an horizontal line within the box. Whiskers define 1.5× the interquartile range. Outliers are plotted as individual dots.
Fig. 1 |
Fig. 1 |. CTCF depletion leads to widespread upregulation of antisense transcription at divergent promoters.
a, Schematic of the PRO-seq experiment (left) and quantification strategy (right). b, Schematic of the experimental set-up. c, PRO-seq MA plot of control versus CTCF-depleted cells on the antisense strand (−1,000 base pair (bp) to +200 bp relative to annotated TSS) in G1E-ER4s. Differentially expressed transcripts are highlighted in color. d, Metaplot of sense and antisense 3′-end PRO-seq mapping, centered at annotated TSSs and plotted with respect to sense orientation for genes with upregulated uasTrx. Solid lines and shading show average signals and the 12.5/87.5th percentiles, respectively. e, As in d for unchanged uasTrx genes. f, Genome browser views of CTCF ChIP-seq (green) and PRO-seq signals (plus strand in red, minus strand in blue) at the Ahcyl1 locus. Arrows point to increased uasTrx. g, As in f for the Azi2 locus. h, As in f for the Rps3a1 locus. i, Heatmaps showing CTCF occupancy at active promoters with proximal (±100 bp) CTCF-binding (up, n = 319; unchanged, n = 1,527) sorted by occupancy level, and shown with respect to sense orientation.
Fig. 2 |
Fig. 2 |. CTCF inhibits uasTrx directly and proximally, and independently of its architectural functions.
a, Illustration of the experimental strategy and summarized findings from this figure and Extended Data Figs. 3–5. b, Genome browser views of CTCF ChIP-seq, PRO-seq and 4C-seq signals at Ahcyl1. Arrows indicate CTCF motif orientation. 4C-seq anchored at the Ahcyl1 promoter with (4 h auxin) and without (0 h auxin) CTCF degradation. The orange anchor indicates the 4C-seq viewpoint. Sites of interest are indicated below the track and are highlighted by dashed boxes. c, Genome browser tracks of CTCF ChIP-seq and PRO-seq and representative 4C-seq profiles of Ahcyl1 control and edited clones. Similar observations were made in two or three independent 4C-seq experiments. The orange anchor indicates the 4C-seq viewpoint. Arrows indicate CTCF motif orientation. Scissors indicate CRISPR/Cas9-edited regions. d, RT–qPCR of Ahcyl1 uasTrx and sense transcription in control and edited clones. Transcripts were normalized to Gapdh (error bar indicates s.e.m.; n = 4, except for uasTrx control, proximal and distal CBS deletion rep1, for which n = 3). Same analyses with different primer pairs are depicted in Extended Data Fig. 4b,c.
Fig. 3 |
Fig. 3 |. CTCF mainly regulates antisense burst fraction, and sense and antisense co-bursting is disfavored at divergent promoters.
a, Top: maps of RNA-FISH probes targeting sense and antisense nascent transcripts at Ahcyl1 and Rps3a1 loci. Bottom: representative FISH images of three independent replicates before and after CTCF depletion. b, Left: box plot showing antisense and sense burst fractions before and after CTCF depletion at Ahcyl1. Right: box plot showing antisense and sense burst sizes before (0 h) and after (4 h) CTCF depletion. n = 3 biological replicates. P values were calculated by a two-sample t-test. Lower and upper box ends represent the first and third quartiles, with the median indicated as a horizontal line within the box. The mean is indicated by a circle within the box. Whiskers define the smallest and largest values within 1.5 times the interquartile range below the first or above the third quartile, respectively. Outliers are plotted as individual dots. c, As in b but for Rps3a1. d, Left: fraction of Ahcyl1 alleles with different sense/antisense burst status at 0 h and 4 h auxin (error bar, s.e.m.; n = 3). Right: same but for Rps3a1. Biological replicates are matched by dot color. e, Left: expected and observed co-burst fraction at Ahcyl1 at 0 h and 4 h auxin (error bar, s.e.m.; n = 3). Right: same but for Rps3a1. Biological replicates are matched by dot color.
Fig. 4 |
Fig. 4 |. CTCF inhibits antisense transcription initiation through TSS-proximal binding.
a, Model illustrating expected 5′-end mapping changes if CTCF blocks transcription initiation. b, Model illustrating expected 3′-end mapping changes if CTCF blocks Pol II stalling. c, Top: 5′-end mapping at genes with unchanged uasTrx (n = 1,201) that exhibit proximal CTCF binding and high-confidence CTCF motif(s) (motif prediction score > 75), centered on CTCF motifs, sorted by mean antisense signal densities over the center 200 bp and shown with respect to sense orientation. Black dashed lines highlight CTCF motif locations. Bottom: metaplot of data in the upper panel. d, As in c but for genes with upregulated uasTrx. e, Top: 3′-end mapping at genes with unchanged uasTrx (n = 1,201). Bottom: metaplot of data in the upper panel. f, As in e but for genes with upregulated uasTrx (n = 298). g, Zoom of 5′-end mapping of uasTrx, centered on the CTCF motif, after (4 h) CTCF depletion at genes with unchanged and upregulated uasTrx. h, 5′-end mapping before (0 h) and after (4 h) CTCF depletion centered on the annotated sense TSS. CTCF motif locations are indicated by the green violin plots (median in red, upper and lower quartiles in black) below PRO-seq tracks.

Similar articles

Cited by

References

    1. Seila AC et al. Divergent transcription from active promoters. Science 322, 1849–1851 (2008). - PMC - PubMed
    1. Core LJ, Waterfall JJ & Lis JT Nascent RNA sequencing reveals widespread pausing and divergent initiation at human promoters. Science 322, 1845–1848 (2008). - PMC - PubMed
    1. Preker P et al. RNA exosome depletion reveals transcription upstream of active human promoters. Science 322, 1851–1854 (2008). - PubMed
    1. Bagchi DN & Iyer VR The determinants of directionality in transcriptional initiation. Trends Genet. 32, 322–333 (2016). - PMC - PubMed
    1. Murray SC et al. Sense and antisense transcription are associated with distinct chromatin architectures across genes. Nucleic Acids Res. 43, 7823–7837 (2015). - PMC - PubMed

Publication types