. 2022 Nov 11;13(1):6865.
doi: 10.1038/s41467-022-34517-w.

An opioid-gated thalamoaccumbal circuit for the suppression of reward seeking in mice

Affiliations

An opioid-gated thalamoaccumbal circuit for the suppression of reward seeking in mice

Kelsey M Vollmer et al. Nat Commun. .

Erratum in

Abstract

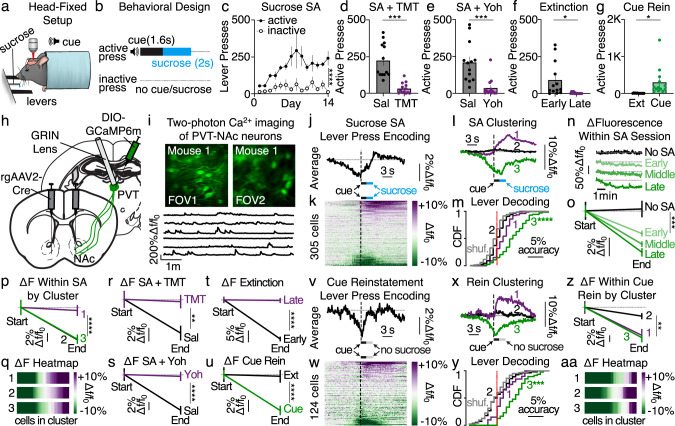
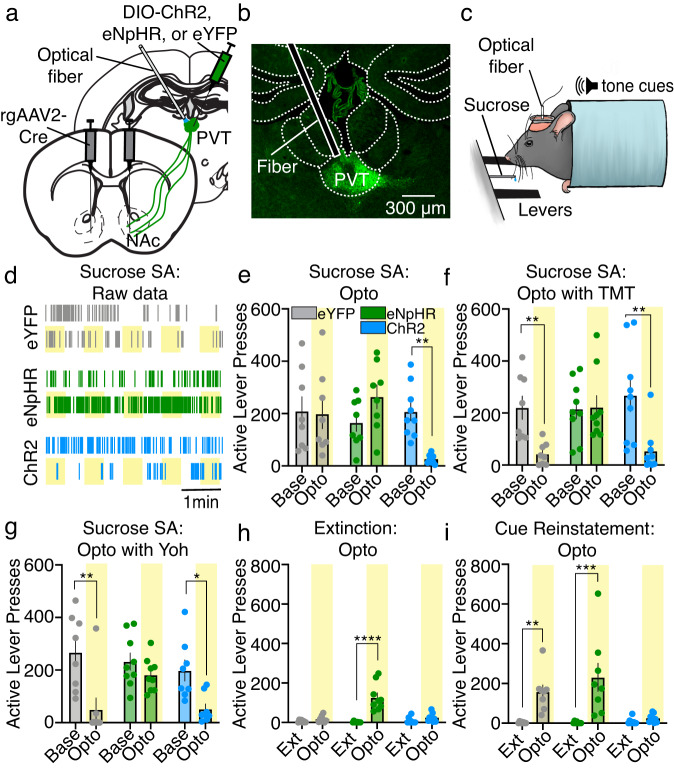
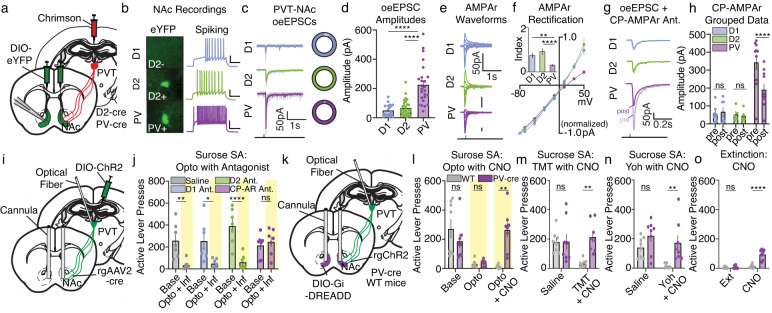
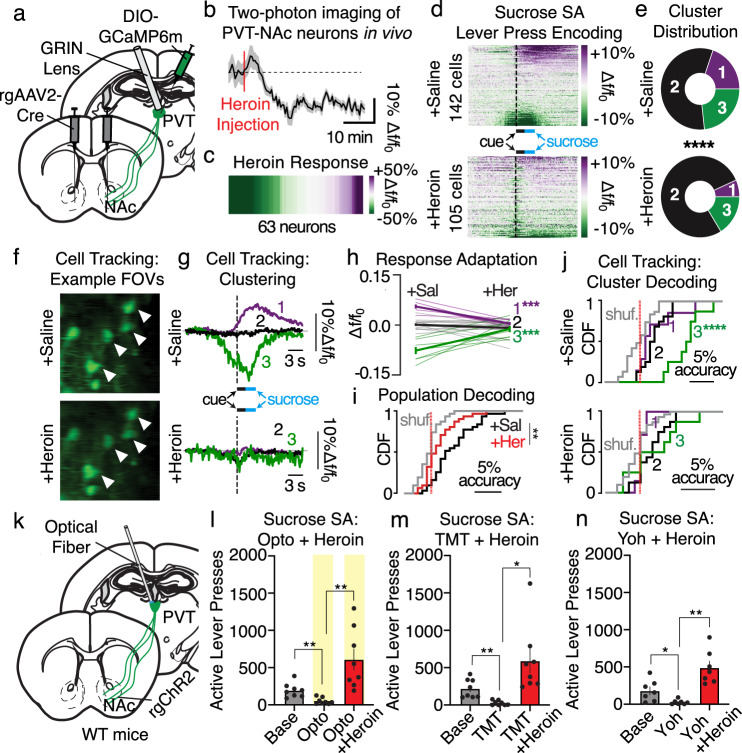
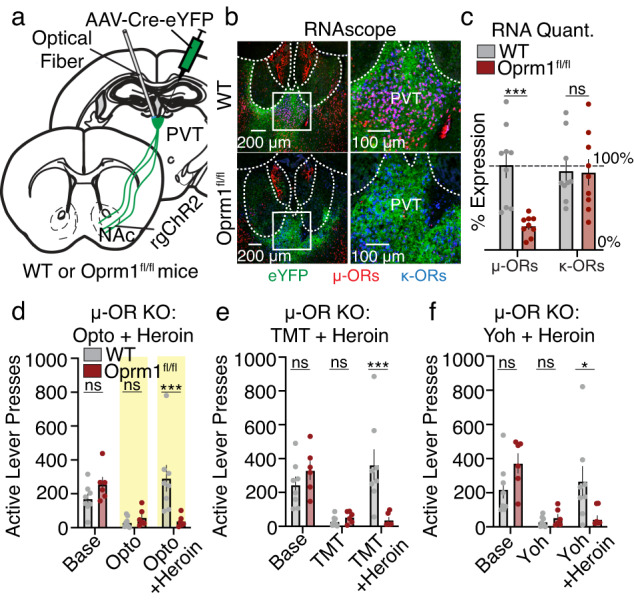
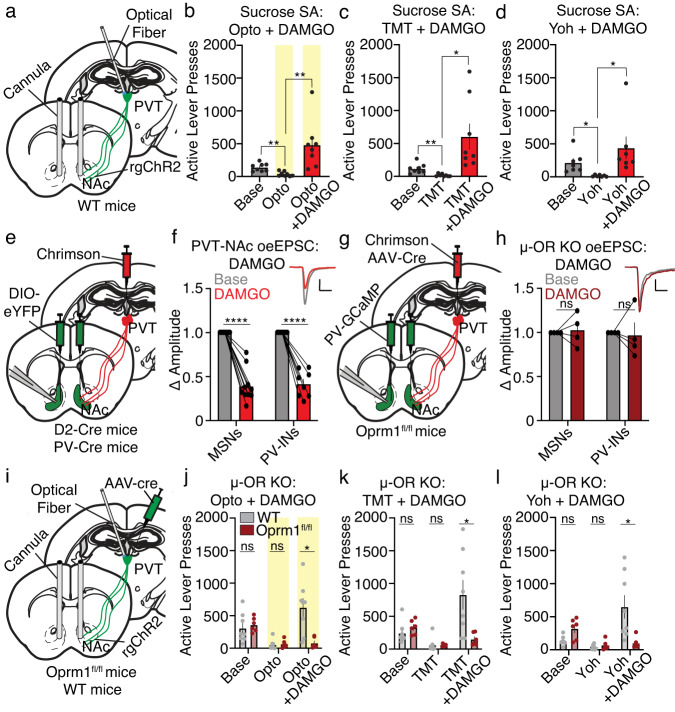
Suppression of dangerous or inappropriate reward-motivated behaviors is critical for survival, whereas therapeutic or recreational opioid use can unleash detrimental behavioral actions and addiction. Nevertheless, the neuronal systems that suppress maladaptive motivated behaviors remain unclear, and whether opioids disengage those systems is unknown. In a mouse model using two-photon calcium imaging in vivo, we identify paraventricular thalamostriatal neuronal ensembles that are inhibited upon sucrose self-administration and seeking, yet these neurons are tonically active when behavior is suppressed by a fear-provoking predator odor, a pharmacological stressor, or inhibitory learning. Electrophysiological, optogenetic, and chemogenetic experiments reveal that thalamostriatal neurons innervate accumbal parvalbumin interneurons through synapses enriched with calcium permeable AMPA receptors, and activity within this circuit is necessary and sufficient for the suppression of sucrose seeking regardless of the behavioral suppressor administered. Furthermore, systemic or intra-accumbal opioid injections rapidly dysregulate thalamostriatal ensemble dynamics, weaken thalamostriatal synaptic innervation of downstream neurons, and unleash reward-seeking behaviors in a manner that is reversed by genetic deletion of thalamic µ-opioid receptors. Overall, our findings reveal a thalamostriatal to parvalbumin interneuron circuit that is both required for the suppression of reward seeking and rapidly disengaged by opioids.


Conflict of interest statement

The authors declare no competing interests.

Figures

Fig. 1
Fig. 1. Inhibition of select PVT→NAc neuronal ensembles predicts sucrose self-administration and seeking.
ac Behavioral design (a; image modified from Vollmer et al., 2021), schematic (b), and grouped data (c) for sucrose self-administration (n = 13 mice; two-way ANOVA, lever: F1,24 = 60.65, P < 0.001). df TMT (d), yohimbine (e), and extinction (f) suppressed lever pressing (n = 13 mice; TMT: two-tailed t-test t12 = 5.54, P = 0.001; yohimbine: t12 = 5.66, P = 0.001; extinction: t12 = 2.72, P = 0.02). g Cue presentation provoked reinstatement after extinction (n = 13 mice; t12 = 2.79, P = 0.02). h, i Surgery (h) for visualization of PVT→NAc neurons (i; top) and calcium-mediated fluorescent signals (i; bottom). j, k Averaged trace (j) and single-cell heatmap (k) revealing PVT→NAc dynamics during sucrose self-administration (n = 6 mice, 305 cells). l Clustering revealed three PVT→NAc neuronal ensembles during sucrose self-administration: excitatory (purple, 79 cells), non-responding (black, 153 cells), and inhibitory (green, 73 cells). m Active lever press decoding was most accurate for ensemble 3 during self-administration (two-way ANOVA, ensemble × shuffle interaction: F2,604 = 34.02, P < 0.001; Sidak’s post-hoc: Ps < 0.001). n, o Example waveforms (n) and grouped data (o) showing reduced PVT→NAc activity during self-administration but not a baseline (No-SA) session (n = 3–6 mice, 105–327 neurons; two-way ANOVA, session × time: F3,2116 = 5.19, P = 0.001; Sidak’s post-hoc: No-SA vs. other sessions, P-values < 0.002). p, q Grouped data (p) and heatmap (q) reveal within-session reductions in activity for each ensemble (two-way ANOVA, ensemble × time: F2,604 = 4.99, P = 0.007; Sidak’s post-hoc: excited vs. inhibited/non-responding, P-values < 0.001). rt TMT (r), yohimbine (s), and extinction (t) prevented reductions in PVT→NAc activity (66–150 neurons/session; TMT: two-way ANOVA, session × time: F1,550 = 4.19, P = 0.04, Sidak’s post-hoc: P = 0.002; yohimbine: ANOVA, F1,274 = 12.59, P < 0.001, Sidak’s post-hoc: P < 0.001; extinction: ANOVA, session × time: F1,570 = 47.04, P < 0.001, Sidak’s post-hoc: P < 0.001). u PVT→NAc activity was reduced during cue-induced reinstatement (n = 124 cells; two-way ANOVA, session × time: F1,544 = 7.83, P = 0.005; Sidak’s post-hoc: P < 0.001). v, w Averaged trace (v) and heatmap (w) revealing PVT→NAc dynamics during cue reinstatement. x Clustering revealed three ensembles: excitatory (20 cells), non-responding (56 cells), and inhibitory (48 cells). y Active lever press decoding was most accurate for ensemble 3 during reinstatement (two-way ANOVA, ensemble × shuffle: F2,242 = 8.23, P = 0.0004; Sidak’s post-hoc: P < 0.001). z, aa Grouped data (z) and heatmap (aa) reveal reductions in activity for each ensemble during cue-induced reinstatement (two-way ANOVA, ensemble × time: F2,242 = 4.27, P = 0.015; Sidak’s post-hoc: non-responding vs. excited/inhibited, P-values < 0.004). FOV field of view, SA self-administration, Rein reinstatement, Yoh yohimbine. Group comparisons: *P < 0.05, **P < 0.01, ***P = 0.001, ****P < 0.001. Bar and line graphs presented as mean ± SEM. Source data are provided as a Source Data file.
Fig. 2
Fig. 2. PVT→NAc activity dynamics are necessary and sufficient for the expression and suppression of sucrose self-administration and seeking.
ac Surgical strategy (a) for optogenetic manipulation of PVT→NAc neurons (b) during sucrose self-administration (c; image modified from Vollmer et al.). d Raster plot showing example active lever pressing rates in each group during sucrose self-administration (examples from 5 mice/group; yellow bar = light on). e Group data showing that optogenetic stimulation of PVT→NAc neurons suppressed active lever pressing (n = 8 eYFP, 8 eNpHR, 9 ChR2 mice; repeated-measures two-way ANOVA, day × group interaction: F2,22 = 7.09, P = 0.004; Sidak’s post-hoc: P = 0.006). fh TMT (f), yohimbine (g), and extinction (h) suppressed active lever pressing, whereas inhibition of PVT→NAc neurons in eNpHR mice rescued active lever pressing (TMT: n = 8 eYFP, 9 eNpHR, 9 ChR2 mice; repeated-measures two-way ANOVA, day × group interaction: F2,23 = 5.36, P = 0.01; Sidak’s post-hoc: eYFP P = 0.009, ChR2 P = 0.001; yohimbine: n = 8 eYFP, 9 eNpHR, 8 ChR2 mice; repeated-measures two-way ANOVA, day effect: F1,22 = 20.46, P = 0.002; Sidak’s post-hoc: eYFP P = 0.002, ChR2 P = 0.04; extinction: n = 8 eYFP, 9 eNpHR, 9 ChR2 mice; repeated-measures two-way ANOVA, day × group interaction: F2,23 = 19.55, P < 0.001; Sidak’s post-hoc: P < 0.001). i Cue-induced reinstatement of active lever pressing after extinction was abolished by stimulation of PVT→NAc neurons in ChR2 mice (n = 8 eYFP, 8 eNpHR, 9 ChR2 mice; repeated-measures two-way ANOVA, day × group interaction: F2,22 = 6.15, P = 0.008; Sidak’s post-hoc: eYFP P = 0.007, eNpHR P = 0.001). Ext extinction, Opto optogenetic manipulation, SA self-administration. Group comparisons: *P < 0.05, **P < 0.01, ***P = 0.001, ****P < 0.001. Bar graphs are presented as mean ± SEM. Source data are provided as a Source Data file.
Fig. 3
Fig. 3. PVT→NAc-dependent suppression of sucrose seeking requires downstream CP-AMPArs and PV interneurons.
a Surgery for slice electrophysiology. b Example fluorescent images (left) and current-clamp traces (right) for NAc cell types (scale: 25 mV/0.2 s). c, d Example waveforms (c; pie charts show proportion of light-responding neurons) and grouped data (d) reveal elevated oeEPSC amplitudes in NAc PV-INs (D1-MSNs: n = 19 cells, 8 mice; D2-MSNs: n = 28 cells, 11 mice; PV-INs: n = 25 cells, 9 mice; one-way ANOVA, F2,69 = 27.78, P < 0.001; Sidak’s post-hoc: PV-INs vs D1/D2-MSNs P-values < 0.001). e, f Example waveforms (e) and grouped data (f) showing PVT→NAcPV-IN synapses are selectively inwardly rectifying (D1-MSNs: n = 11 cells, 5 mice; D2-MSNs: n = 10 cells, 5 mice; PV-INs: n = 16 cells, 7 mice). Inset: rectification index (I50/-I−70; one-way ANOVA, F2,34 = 13.27, P < 0.001; Sidak’s post-hoc: PV-INs vs D1/D2-MSNs P-values < 0.003). g, h Waveforms (g) and grouped data (h) showing that bath application of the CP-AMPAr antagonist IEM-1640 selectively reduced oeEPSC amplitudes at PVT→NAcPV-IN synapses (D1-MSNs: n = 7 cells, 5 mice; D2-MSNs: n = 5 cells, 4 mice; PV-INs: n = 10 cells, 5 mice; two-way ANOVA, cell type × time: F2,19 = 13.17, P = 0.003; Sidak’s post-hoc: PV-INs P < 0.001). i Surgery for simultaneous optogenetic manipulation of PVT→NAc neurons and intra-NAc neuropharmacology. j Microinfusions of the CP-AMPAr antagonist prevented the suppression of sucrose self-administration caused by stimulation of PVT→NAc neurons (n = 7 mice/group; two-way ANOVA, group × day: F3,24 = 5.98, P = 0.003; Sidak’s post-hoc: P-values < 0.01). k Surgery for simultaneous optogenetic stimulation of PVT→NAc neurons and chemogenetic inhibition of PV-INs. l CNO-mediated inhibition of NAc PV-INs prevented the suppression of sucrose self-administration caused by optogenetic stimulation of PVT→NAc neurons (n = 8 mice/group; two-way ANOVA, group x day: F2,28 = 11.33, P < 0.001; Sidak’s post-hoc: Opto + CNO P = 0.004). m–o Chemogenetic inhibition of PV-INs also prevented the suppression of sucrose self-administration caused by TMT (m), yohimbine (n), and extinction learning (o) (TMT: n = 8 mice/group; two-way ANOVA, group × day: F1,14 = 5.34, P = 0.04; Sidak’s post-hoc: TMT + CNO P = 0.002; yohimbine: n = 8 mice/group; ANOVA, group: F1,14 = 10.93, P = 0.01; Sidak’s post-hoc: yohimbine + CNO P = 0.005; extinction: n = 7 mice/group; ANOVA, group × day: F1,12 = 29.91, P = 0.001; Sidak’s post-hoc: extinction + CNO P < 0.001). CP-AMPAr calcium-permeable AMPA receptor, oeEPSC optically evoked excitatory postsynaptic current, SA self-administration, WT wild-type, Yoh yohimbine; Group comparisons: *P < 0.05, **P < 0.01, ****P < 0.001. Bar and line graphs are presented as mean ± SEM. Source data are provided as a Source Data file.
Fig. 4
Fig. 4. PVT→NAc-dependent suppression of reward seeking is disrupted by an injection of heroin.
a Surgery for in vivo two-photon imaging. b, c Averaged trace (b) and heatmap (c) from two-photon imaging reveal that heroin reduced PVT→NAc neuronal activity (n = 63 neurons/3 mice; two-tailed t-test, t62 = 3.03, P = 0.004). d Heatmaps for all neurons during sucrose self-administration following injection of saline (top; n = 142 cells/4 mice) or heroin (bottom; n = 105 cells/4 mice). e Heroin reduced the proportion of cells in excited and inhibited ensembles (Chi-squared, χ2 = 23.5, P < 0.001). f Example FOVs for PVT→NAc neurons tracked across sucrose self-administration days (n = 4 mice, 31 tracked cells; top: saline, bottom: heroin). g Clustering of tracked cells revealed a change in ensemble dynamics for excitatory responders (7 cells), non-responders (16 cells), and inhibitory responders (8 cells). h Response amplitudes for tracked cells reveal significant response adaptations in ensemble 1 and 3, but not 2, due to heroin injection (two-way ANOVA, ensemble × time: F2,56 = 29.21; P < 0.001; Sidak’s post-hoc: ensembles 1, 3 P-values = 0.001). i Heroin reduced active lever press decoding by PVT→NAc cells (two-way ANOVA, drug × shuffling: F1,120 = 7.15, P = 0.01; Sidak’s post-hoc: Saline vs. Heroin P = 0.002). j Cluster decoding of tracked cells shows that the inhibitory ensemble best predicts an active lever during the saline test (top; two-way ANOVA, ensemble × shuffling interaction: F2,56 = 7.00, P = 0.002; Sidak’s post-hoc: P < 0.001), but none of the ensembles can predict an active lever press during the heroin test (bottom; interaction: two-way ANOVA, F2,56 = 0.75, P > 0.48). k Surgical strategy for optogenetic manipulation. ln Heroin prevented the suppression of sucrose self-administration caused by PVT→NAc stimulation (l), TMT (m), and yohimbine (n) (Opto: n = 8 mice/group; one-way ANOVA, F2,21 = 11.56, P = 0.004; planned two-tailed t-tests: base vs. opto P < 0.01, opto vs. heroin + opto P < 0.01; TMT: n = 8 mice/group; one-way ANOVA, F2,21 = 8.77, P = 0.002; planned two-tailed t-tests: base vs. TMT P < 0.01, TMT vs. heroin + TMT P < 0.05; yohimbine: n = 7 mice/group; one-way ANOVA, F2,18 = 16.36, P < 0.001; planned two-tailed t-tests: base vs. yohimbine P < 0.05, yohimbine vs. heroin + yohimbine P < 0.01). FOV field of view, SAL saline, HER heroin, Base Baseline, Opto optogenetics, Yoh Yohimbine. Group comparisons: *P < 0.05, **P < 0.01, ***P = 0.001, ****P < 0.001. Bar and line graphs are presented as mean values ± SEM. Source data are provided as a Source Data file.
Fig. 5
Fig. 5. Selective knockout of PVT µ-opioid receptors prevents heroin-induced behavioral disinhibition.
a Surgical strategy for PVT µ-OR knockout with simultaneous optogenetic manipulation of PVT→NAc neurons. b Example images showing RNAscope in situ hybridization of PVT µ-ORs and κ-ORs in WT (top) and Oprm1fl/fl (bottom) mice. c Quantification reveals reduced µ-OR but not κ-OR RNA expression in Oprm1fl/fl mice (n = 3 Oprm1fl/fl, 2 WT mice; two-way ANOVA, group x receptor interaction: F1,32 = 7.61, P = 0.01; Sidak’s post-hoc: P = 0.001). df Knockout of PVT µ-ORs in Oprm1fl/fl mice rescued the suppression of sucrose self-administration caused by optogenetic stimulation of PVT→NAc neurons (d), TMT (e), and yohimbine (f) despite systemic heroin injection (n = 6–8 mice/group; Opto: n = 6 Oprm1fl/fl, 8 WT mice; repeated-measures two-way ANOVA, group × day interaction: F2,24 = 8.33, P = 0.002; Sidak’s post-hoc: opto + heroin P = 0.001; TMT: n = 6 Oprm1fl/fl, 8 WT mice; repeated-measures two-way ANOVA, group × day interaction: F2,24 = 8.94, P = 0.001; Sidak’s post-hoc: TMT + heroin P = 0.001; yohimbine: n = 6 Oprm1fl/fl, 8 WT mice; repeated-measures two-way ANOVA, group × day interaction: F2,24 = 5.53, P = 0.01; Sidak’s post-hoc: TMT + heroin P = 0.02). µ-OR µ-opioid receptor, κ-OR κ-opioid receptor, Base Baseline, Opto optogenetics, Yoh Yohimbine. Group comparisons: *P < 0.05, **P < 0.01, ***P = 0.001. Bar graphs are presented as mean values ± SEM. Source data are provided as a Source Data file.
Fig. 6
Fig. 6. PVT→NAc-dependent suppression of reward seeking is gated by presynaptic µ-opioid receptors.
a Surgical strategy for optogenetic manipulation of PVT→NAc neurons and intra-NAc DAMGO infusions. bd Intra-NAc infusion of DAMGO prevented the suppression of sucrose self-administration caused by PVT→NAc stimulation (b), TMT (c), and yohimbine (d) (Opto: n = 8 mice/group; one-way ANOVA, F2,21 = 9.33, P = 0.001; planned two-tailed t-tests: base vs. opto P < 0.01, opto vs. DAMGO + opto P < 0.01; TMT: n = 8 mice/group; one-way ANOVA, F2,21 = 8.02, P = 0.003; planned t-tests: base vs. TMT P < 0.01, TMT vs. DAMGO + TMT P = 0.02; yohimbine: n = 7 mice/group; one-way ANOVA, F2,18 = 4.26, P = 0.03; planned t-tests: base vs. yohimbine P = 0.02, yohimbine vs. DAMGO + yohimbine P < 0.05). e Surgical strategy for patch-clamp electrophysiology. f Example electrophysiological waveforms (scale: 50pA/50 ms) and grouped data reveal that DAMGO reduced PVT→NAcMSN and PVT→NAcPV-IN oeEPSC amplitudes (MSNs: n = 10 cells, 6 mice; PV-INs: n = 8 cells, 5 mice; repeated-measures two-way ANOVA, effect of DAMGO: F1,16 = 210.9, P < 0.0001; Sidak’s post-hoc: P-values < 0.001). g Surgical strategy for knockout of PVT µ-ORs with patch-clamp electrophysiology. h Example electrophysiological waveforms (scale: 50pA/50 ms) and grouped data reveal that PVT µ-OR knockout prevented the DAMGO-induced decrease in PVT→NAcMSN and PVT→NAcPV-IN oeEPSC amplitudes (n = 4 cells per group, 2 mice; repeated-measures two-way ANOVA, effect of DAMGO F1,6 = 0.0001 P = 0.99). i Surgical strategy for PVT µ-OR knockout with simultaneous optogenetic manipulation of PVT→NAc neurons and intra-NAc DAMGO infusions. jl Knockout of PVT µ-ORs in Oprm1fl/fl mice rescued the suppression of sucrose self-administration caused by optogenetic stimulation of PVT→NAc neurons (j), TMT (k), and yohimbine (l) despite intra-NAc DAMGO infusions (Opto: n = 6 Oprm1fl/fl, 8 WT mice; repeated-measures two-way ANOVA, day × group interaction: F2,24 = 9.74, P = 0.001; Sidak’s post-hoc: opto + DAMGO P = 0.02; TMT: n = 6 Oprm1fl/fl, 8 WT mice; repeated-measures two-way ANOVA, day × group interaction: F2,24 = 7.04, P = 0.004; Sidak’s post-hoc: TMT + DAMGO P < 0.001; yohimbine: n = 6 Oprm1fl/fl, 8 WT mice; repeated-measures two-way ANOVA, day × group interaction: F2,24 = 10.97, P = 0.0004; Sidak’s post-hoc: yohimbine + DAMGO P < 0.05). µ-OR µ-opioid receptor, Base Baseline, Opto optogenetics, Yoh Yohimbine, KO knockout; Group comparisons: *P < 0.05, **P < 0.01, ****P < 0.001. Bar graphs are presented as mean values ± SEM. Source data are provided as a Source Data file.

References

    1. Logan GD. Executive control of thought and action. Acta Psychol. (Amst.) 1985;60:193–210. doi: 10.1016/0001-6918(85)90055-1. - DOI
    1. Mansouri FA, Tanaka K, Buckley MJ. Conflict-induced behavioural adjustment: a clue to the executive functions of the prefrontal cortex. Nat. Rev. Neurosci. 2009;10:141–152. doi: 10.1038/nrn2538. - DOI - PubMed
    1. Stephens, D. W. & Krebs, J. R. Foraging Theory. (Princeton University Press, 1986).
    1. Webster LR. Risk factors for opioid-use disorder and overdose. Anesth. Analg. 2017;125:1741–1748. doi: 10.1213/ANE.0000000000002496. - DOI - PubMed
    1. Kirouac GJ. Placing the paraventricular nucleus of the thalamus within the brain circuits that control behavior. Neurosci. Biobehav. Rev. 2015;56:315–329. doi: 10.1016/j.neubiorev.2015.08.005. - DOI - PubMed

Publication types

LinkOut - more resources