Caloric restriction improves glycaemic control without reducing plasma branched-chain amino acids or keto-acids in obese men
- PMID: 36369511
- PMCID: PMC9652417
- DOI: 10.1038/s41598-022-21814-z
Caloric restriction improves glycaemic control without reducing plasma branched-chain amino acids or keto-acids in obese men
Abstract
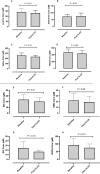
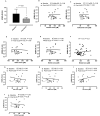
Higher plasma leucine, isoleucine and valine (BCAA) concentrations are associated with diabetes, obesity and insulin resistance (IR). Here, we evaluated the effects of 6-weeks very-low calorie diet (VLCD) upon fasting BCAA in overweight (OW) non-diabetic men, to explore associations between circulating BCAA and IR, before and after a weight loss intervention. Fasting plasma BCAAs were quantified in an OW (n = 26; BMI 32.4 ± 3 kg/m2; mean age 44 ± 9 y) and a normal-weight (NW) group (n = 26; BMI 24 ± 3.1 kg/m2; mean age 32 ± 12.3 y). Ten of the OW group (BMI 32.2 ± 4 kg/m2; 46 ± 8 y) then underwent 6-weeks of VLCD (600-800 kcal/day). Fasting plasma BCAA (gas chromatography-mass spectrometry), insulin sensitivity (HOMA-IR) and body-composition (DXA) were assessed before and after VLCD. Total BCAA were higher in OW individuals (sum leucine/isoleucine/valine: 457 ± 85 µM) compared to NW control individuals (365 ± 78 µM, p < 0.001). Despite significant weight loss (baseline 103.9 ± 12.3 to 93 ± 9.6 kg and BMI 32.2 ± 4 to 28.9 ± 3.6 kg/m2), no changes were observed in BCAAs after 6-weeks of VLCD. Moreover, although VLCD resulted in a significant reduction in HOMA-IR (baseline 1.19 ± 0.62 to 0.51 ± 0.21 post-VLCD; p < 0.001), Pearson's r revealed no relationships between BCAA and HOMA-IR, either before (leucine R2: 2.49e-005, p = 0.98; isoleucine R2: 1.211-e006, p = 0.9; valine R2: 0.004, p = 0.85) or after VLCD (leucine R2: 0.003, p = 0.86; isoleucine R2: 0.006, p = 0.82; valine R2: 0.002, p = 0.65). Plasma BCAA are higher in OW compared to NW individuals. However, while 6-weeks VLCD reduced body weight and IR in OW individuals, this was not associated with reductions in BCAA. This suggests that studies demonstrating links between BCAA and insulin resistance in OW individuals, are complex and are not normalised by simply losing weight.
© 2022. The Author(s).
Conflict of interest statement
The authors declare no competing interests.
Figures


Similar articles
-
Diabetes and branched-chain amino acids: What is the link?J Diabetes. 2018 May;10(5):350-352. doi: 10.1111/1753-0407.12645. Epub 2018 Feb 13. J Diabetes. 2018. PMID: 29369529
-
Associations between Plasma Branched Chain Amino Acids and Health Biomarkers in Response to Resistance Exercise Training Across Age.Nutrients. 2020 Oct 2;12(10):3029. doi: 10.3390/nu12103029. Nutrients. 2020. PMID: 33023275 Free PMC article. Clinical Trial.
-
Impact of combined resistance and aerobic exercise training on branched-chain amino acid turnover, glycine metabolism and insulin sensitivity in overweight humans.Diabetologia. 2015 Oct;58(10):2324-35. doi: 10.1007/s00125-015-3705-6. Epub 2015 Aug 9. Diabetologia. 2015. PMID: 26254576 Free PMC article.
-
The role of skeletal muscle in the pathogenesis of altered concentrations of branched-chain amino acids (valine, leucine, and isoleucine) in liver cirrhosis, diabetes, and other diseases.Physiol Res. 2021 Jul 12;70(3):293-305. doi: 10.33549/physiolres.934648. Epub 2021 May 12. Physiol Res. 2021. PMID: 33982576 Free PMC article. Review.
-
Branched-Chain Amino Acids and Insulin Resistance, from Protein Supply to Diet-Induced Obesity.Nutrients. 2022 Dec 23;15(1):68. doi: 10.3390/nu15010068. Nutrients. 2022. PMID: 36615726 Free PMC article. Review.
Cited by
-
Effect of a Very Low-Calorie Diet on Oxidative Stress, Inflammatory and Metabolomic Profile in Metabolically Healthy and Unhealthy Obese Subjects.Antioxidants (Basel). 2024 Feb 29;13(3):302. doi: 10.3390/antiox13030302. Antioxidants (Basel). 2024. PMID: 38539836 Free PMC article.
-
A Systematic Review and Meta-Analysis of the Effect of Caloric Restriction on Skeletal Muscle Mass in Individuals with, and without, Type 2 Diabetes.Nutrients. 2024 Sep 30;16(19):3328. doi: 10.3390/nu16193328. Nutrients. 2024. PMID: 39408294 Free PMC article.
References
Publication types
MeSH terms
Substances
Grants and funding
LinkOut - more resources
Full Text Sources

