. 2023 Apr;52(4):733-742.
doi: 10.1007/s13280-022-01797-x. Epub 2022 Nov 11.

Local stakeholder perceptions of forest degradation: Keys to sustainable tropical forest management

Affiliations

Local stakeholder perceptions of forest degradation: Keys to sustainable tropical forest management

Dolors Armenteras et al. Ambio. 2023 Apr.

Abstract

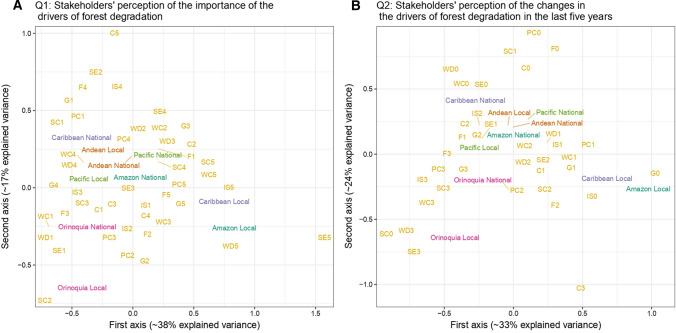
Land use policies and planning in Latin America have been partially successful in halting deforestation yet have not stopped forest degradation. Here, we study the different stakeholders' perspectives of the drivers of forest degradation. We use Colombia as a case study for understanding synergies and trade-offs of the sustainable development goals (SDGs) and analyzed what the most important causes are, to whom it matters, and their regional contribution. We identified a common perception, but miscommunication and misunderstandings occur between local- and national-level actors in terms of their views on responsibilities and rates of change. The results are a call for action. Cross-scale governance is necessary to improve the design and implementation of policies for forest management at the subnational and local levels and to ensure that we move toward sustainable development without worsening existing inequalities. It is essential that countries provide the enabling conditions to develop a coherent governing framework.

Keywords: Colombia; Forest fire; Forest loss; Grazing; Logging; Trade-offs.


Conflict of interest statement

The authors have no relevant financial or non-financial interests to disclose.

Figures

Fig. 1
Fig. 1
Survey Diagram. Closed-choice questions are shown in blue, and open-response questions are shown in yellow. The first section shows the characteristics of the interviewees, referring to personal information and characterization of focal groups. The second section shows the structure of the survey regarding degradation drivers (direct, indirect, others) and trends in the last five years. In the case of forest extraction, questions regarding the type of product, its extraction frequency, and the type of use were included. Respondents were asked to give a rating from 1 to 10 on the incidence of each driver in forest degradation and its tendency (reduction or increase). As an illustration, we provide examples of two drivers, "selective extraction of wood for domestic use," which had a rating of 8 in importance as a degradation driver, but this activity has diminished in the last 5 years, or “livestock,” with a rating of 10 and a strong increasing trend
Fig. 2
Fig. 2
Mean values of stakeholders’ perceptions of the importance of forest degradation. The purple dots correspond to the means. The central horizontal bars are the medians. The lower and upper limits of the box are the first and third quartiles. C-coal; F-fire; G-grazing; IS-invasive species; P_NTFP-persistent extraction for domestic use of NTFP, PC-persistent cutting, S_NTFP-selective extraction for domestic use of NTFP, SC-selective cutting, WC-wood for commercial use, WD-wood. for domestic use
Fig. 3
Fig. 3
Degradation drivers identified by participants. A represents the direct (black) and indirect (blue) drivers identified by survey participants, and B represents the grouping of these drivers into degradation categories
Fig. 4
Fig. 4
Correspondence analysis representing stakeholder perceptions at two levels (local and national) in the five regions of Colombia. The centroid of every group of stakeholders is labeled according to the scale and region (i.e., Amazon local). The position of such labels indicates the similarity between group perceptions (when proximity between labels is assessed) or the most common response given by group members (when proximity between labels and yellow abbreviations is assessed). Abbreviations represent the score (1–5 in Q1 and 0–3 in Q2) given by stakeholders to the importance of each driver in forest degradation (C-Coal; F-Fire; G-Grazing; IS-Invasive Species; PC-Persistent Cutting, SC-Selective Cutting, WC-Wood for Commercial Use, WD-Wood for domestic use)

References

    1. Andela N, Morton DC, Giglio L, Chen Y, Van Der Werf GR, Kasibhatla PS, DeFries RS, Collatz GJ, et al. A human-driven decline in global burned area. Science. 2017;356:1356–1362. doi: 10.1126/science.aal4108. - DOI - PMC - PubMed
    1. Armenteras D, Cabrera E, Rodríguez N, Retana J. National and regional determinants of tropical deforestation in Colombia. Regional Environmental Change. 2013;13:1181–1193. doi: 10.1007/s10113-013-0433-7. - DOI
    1. Armenteras D, González TM, Barreto S. Fuegos y áreas protegidas de la Amazonia Colombiana: Cambio en los motores de deforestación. Revista Colombia Amazonica. 2018;11:73–84.
    1. Armenteras, D., T.M. González, M. Meza, J.P. Ramírez-Delgado, E. Cabrera, G. Galindo, A. Yepes. 2018a. Causas de degradación forestal en Colombia: una primera aproximación.
    1. Armenteras D, Negret P, Melgarejo LF, Lakes TM, Londoño MC, García J, Krueger T, Baumann M, et al. Curb land grabbing to save the Amazon. Nature Ecology and Evolution. 2019 doi: 10.1038/s41559-019-1020-1. - DOI - PubMed

LinkOut - more resources