

Association between B-cell depletion and attack risk in neuromyelitis optica spectrum disorder: An exploratory analysis from N-MOmentum, a double-blind, randomised, placebo-controlled, multicentre phase 2/3 trial
- PMID: 36370634
- PMCID: PMC9664402
- DOI: 10.1016/j.ebiom.2022.104321
Association between B-cell depletion and attack risk in neuromyelitis optica spectrum disorder: An exploratory analysis from N-MOmentum, a double-blind, randomised, placebo-controlled, multicentre phase 2/3 trial
Abstract
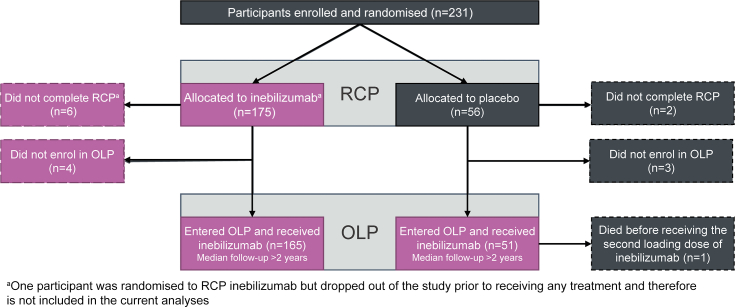
Background: Inebilizumab is an anti-CD19 antibody approved for the treatment of neuromyelitis optica spectrum disorder (NMOSD) in adults with aquaporin-4 autoantibodies. The relationship between B-cell, plasma-cell (PC), and immunoglobulin depletion with longitudinal reductions in NMOSD activity after inebilizumab treatment was characterised post hoc in an exploratory analysis from the N-MOmentum study (NCT02200770).
Methods: Peripheral blood CD20+ B cells, PC gene signature, and immunoglobulin levels were assessed throughout N-MOmentum (follow-up ≥2.5 years); correlations with clinical metrics and magnetic resonance imaging (MRI) lesion activity were assessed.
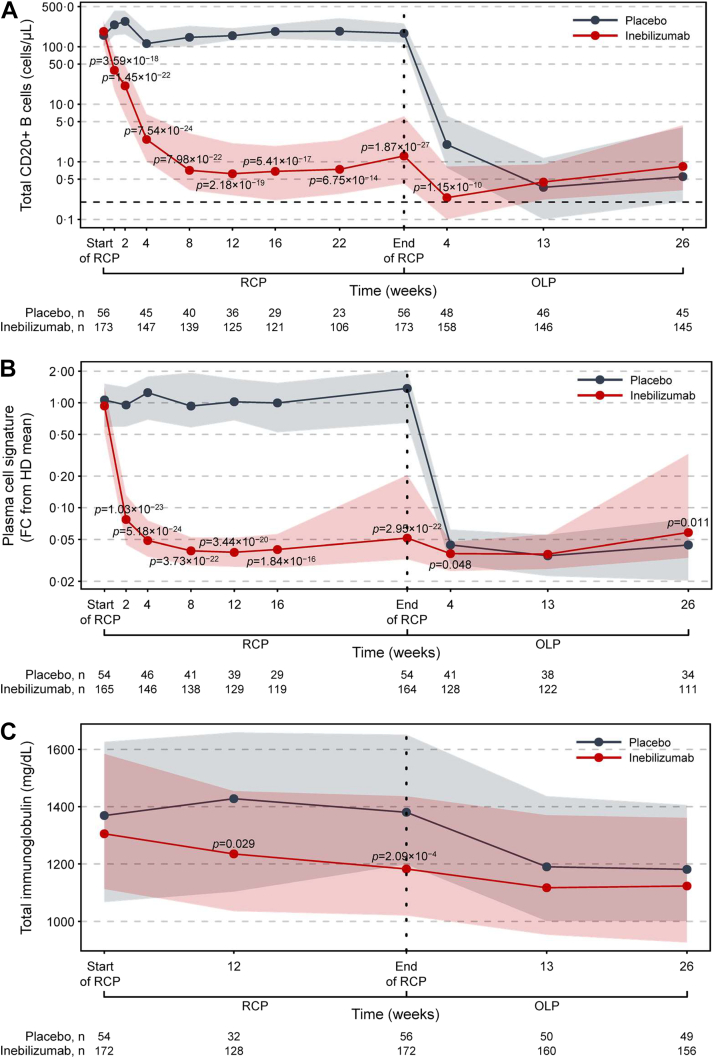
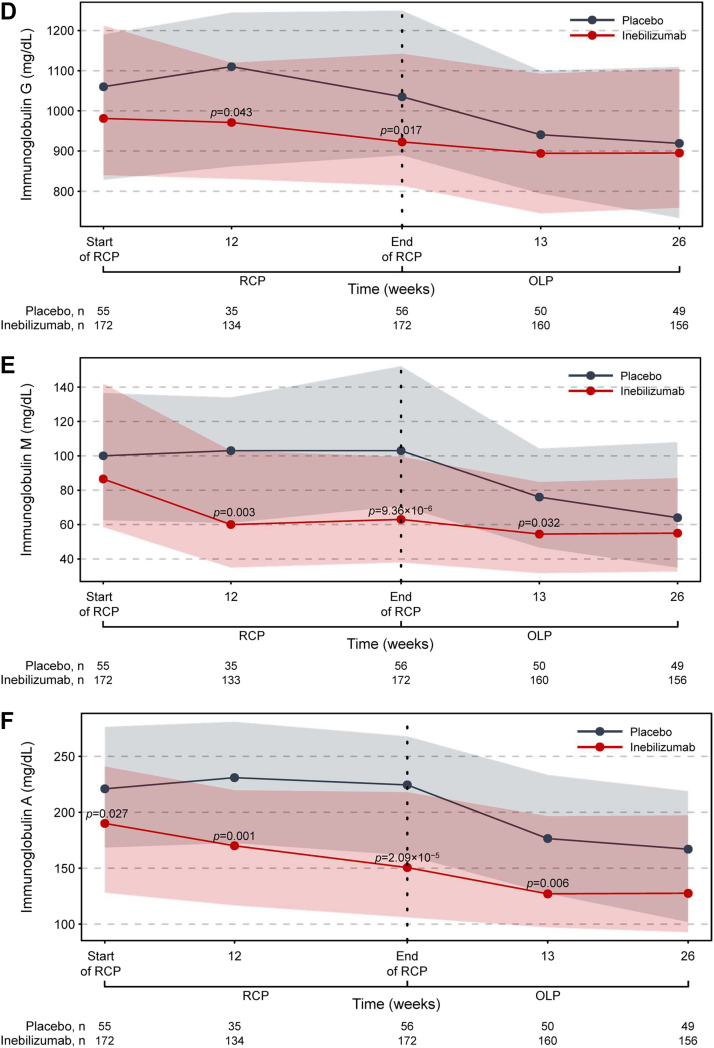
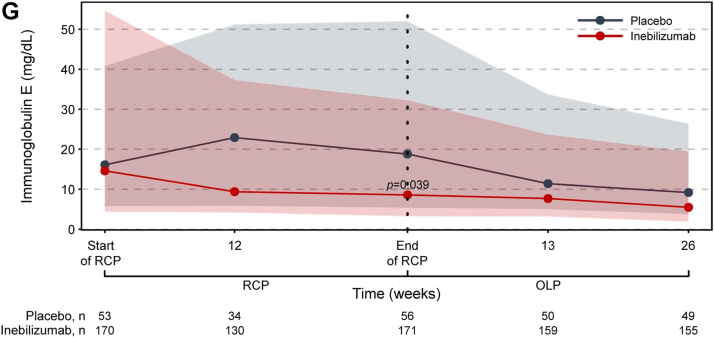
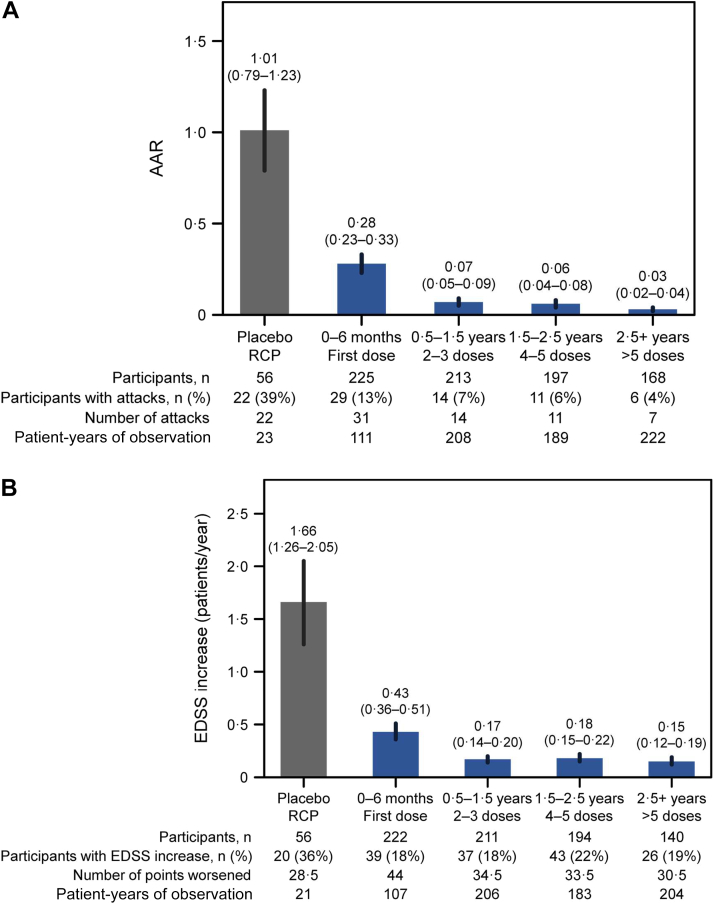
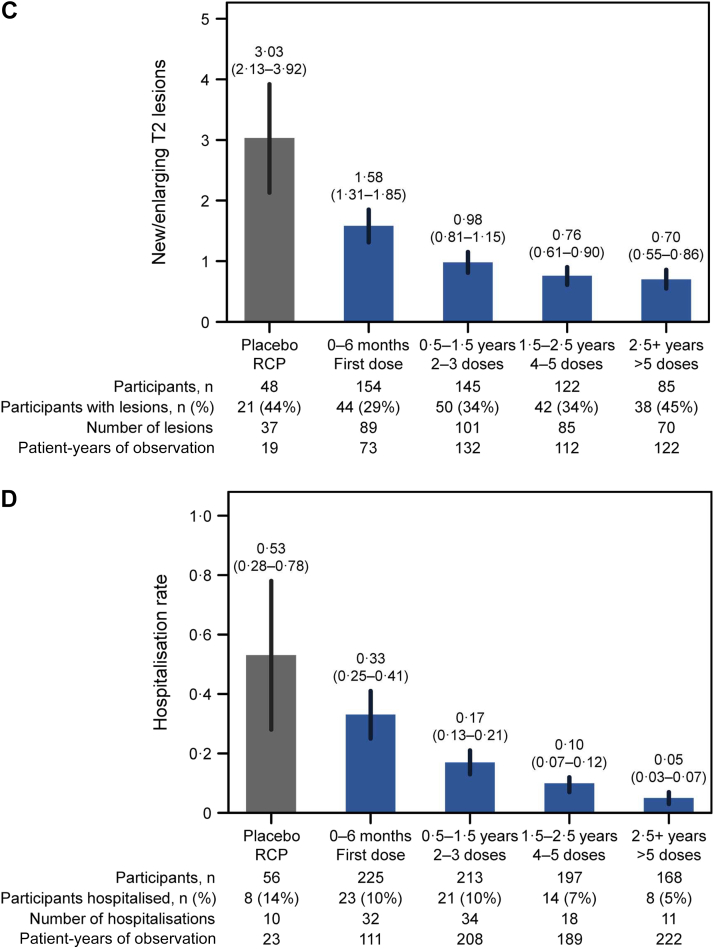
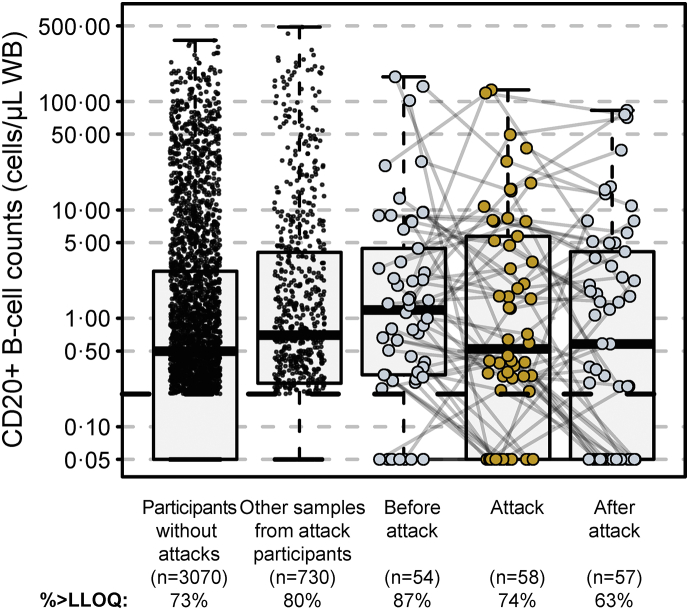
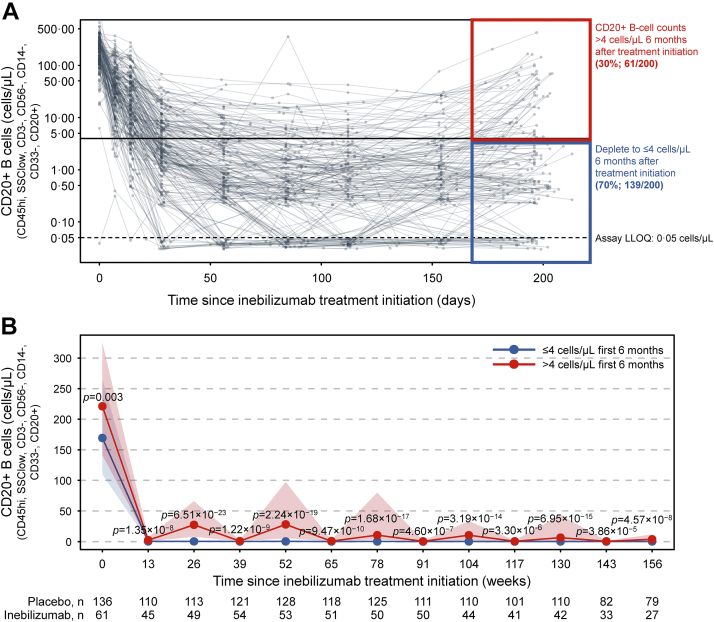
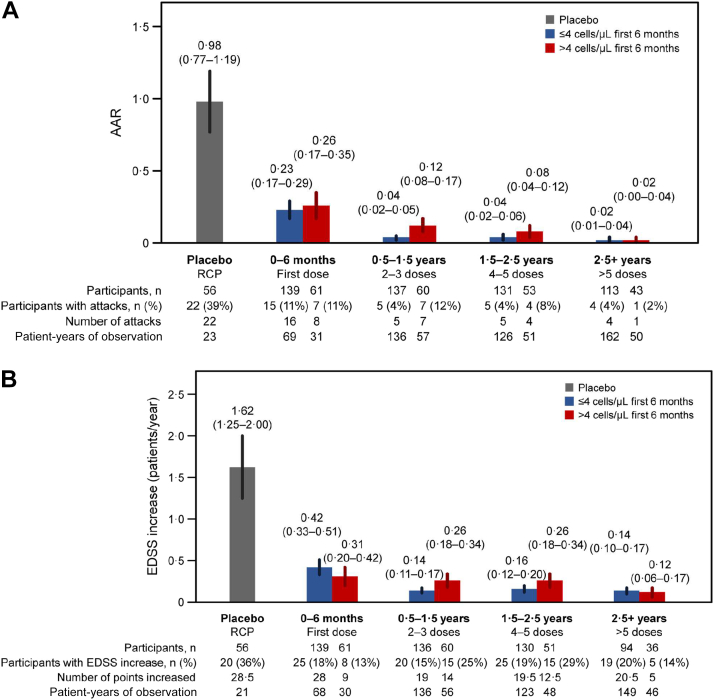
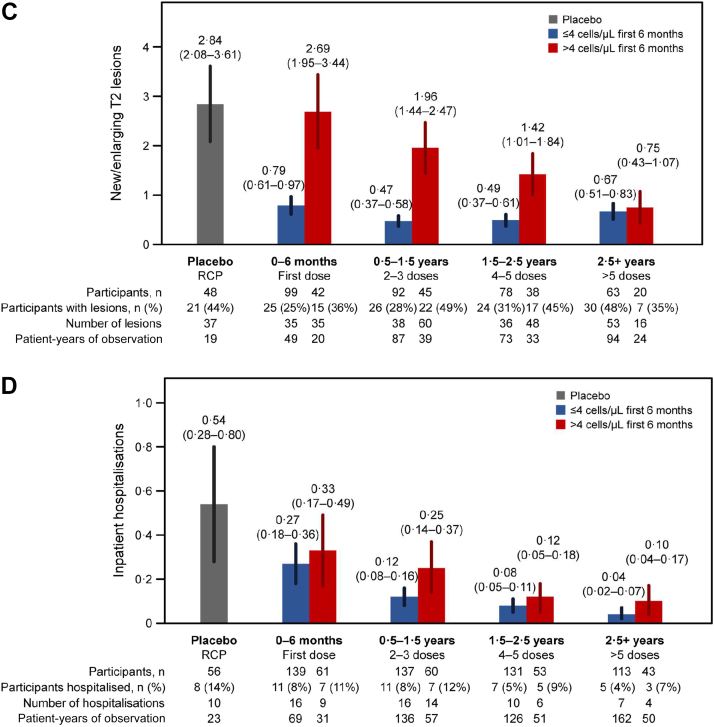
Findings: Inebilizumab induced durable B-cell and PC depletion within 1 week versus placebo. Although no association was observed between B-cell counts at time of attack and NMOSD activity, depth of B-cell depletion after the first dosing period correlated with clinical outcomes. All participants receiving inebilizumab demonstrated a robust long-term therapeutic response, and participants with ≤4 cells/μL after the first 6-month dosing interval had persistently deeper B-cell depletion, lower annualised attack rates (estimated rate [95% CI]: 0.034 [0.024-0.04] vs 0.086 [0.056-0.12]; p = 0.045), fewer new/enlarging T2 MRI lesions (0.49 [0.43-0.56] vs 1.36 [1.12-1.61]; p < 0.0001), and a trend towards decreased Expanded Disability Status Scale worsening (0.076 [0.06-0.10] vs 0.14 [0.10-0.18]; p = 0.093). Antibodies to inebilizumab, although present in a proportion of treated participants, did not alter outcomes.
Interpretation: This analysis suggests that compared with placebo, inebilizumab can provide specific, rapid, and durable depletion of B cells in participants with NMOSD. Although deep and persistent CD20+ B-cell depletion correlates with long-term clinical stability, early, deep B-cell depletion correlates with improved disease activity metrics in the first 2 years.
Funding: Horizon Therapeutics (formerly from Viela Bio/MedImmune).
Keywords: Anti-CD19 monoclonal antibody; Aquaporin-4 antibody-positive neuromyelitis optica spectrum disorder; B-cell suppression; Devic disease.
Copyright © 2022 Horizon Therapeutics plc. Published by Elsevier B.V. All rights reserved.
Conflict of interest statement
Declaration of interests J.L.Bennett reports payment for study design/consultation from MedImmune; personal fees from AbbVie, Alexion, Antigenomycs, BeiGene, Chugai, Clene Nanomedicine, Genentech, Genzyme, Reistone Bio, Roche, and TG; grants from Alexion, the National Institutes of Health, and Novartis. In addition, Dr Bennett has a patent ‘Compositions and methods for the treatment of neuromyelitis optica’. O.Aktas reports grants from the German Research Foundation (DFG) and the German Ministry of Education and Research (BMBF); grants and personal fees from Bayer HealthCare, Biogen, Genzyme, Horizon Therapeutics (formerly from Viela Bio), Novartis, and Teva; and personal fees from Almirall, MedImmune, Merck Serono, and Roche. W.A.Rees, M.A.Smith, D.She, and D.Cimbora are employees of Horizon Therapeutics (formerly Viela Bio) and own stock. L.Yan, M.Gunsior, and E.Katz are former employees of Horizon Therapeutics. S.J.Pittock reports grants, personal fees, and non-financial support from Alexion Pharmaceuticals, Inc.; grants from Autoimmune Encephalitis Alliance and Grifols; grants, personal fees, non-financial support, and other from Horizon Therapeutics (formerly from Viela Bio) and MedImmune; personal fees for consulting services from Astellas; grants, personal fees, non-financial support and other from Roche/Genentech; personal fees for consulting services from UCB; and has a patent #9,891,219 (Application#12-573942) ’Methods for Treating Neuromyelitis Optica (NMO) by Administration of Eculizumab to an individual that is Aquaporin-4 (AQP4)-IgG Autoantibody Positive’. B.G.Weinshenker received payments for serving as chair of attack adjudication committees for clinical trials in NMOSD for Alexion, MedImmune, and Viela Bio/Horizon Therapeutics; has consulted with Chugai, Genentech, Horizon Therapeutics, Mitsubishi Tanabe Pharma, and Roche Pharmaceuticals; and has a patent for NMO-IgG for diagnosis of neuromyelitis optica, with royalties paid by Hospices Civils de Lyon, MVZ Labor PD Dr. Volkmann und Kollegen GbR, University of Oxford, and RSR. F.Paul has received research support, speaker honoraria, and travel reimbursement from Bayer, Biogen Idec, Merck Serono, Novartis, Sanofi Genzyme, and Teva; is supported by the German Research Council (DFG Exc 257) and the German Competence Network for Multiple Sclerosis; has received travel reimbursement from the Guthy-Jackson Charitable Foundation; and serves on the steering committee of the OCTIMS study, sponsored by Novartis. R.Marignier reports personal fees for consulting from Alexion, Horizon Therapeutics (formerly Viela Bio), Roche, and UCB. D.Wingerchuk reports personal fees from Biogen, Celgene, Genentech, MedImmune, Mitsubishi Tanabe, Novartis, Reistone Biopharma, and TG Therapeutics; research support paid to the Mayo Clinic by Alexion and Terumo BCT; and has served on a clinical trial adjudication committee for Horizon Therapeutics (formerly Viela Bio) and MedImmune. G.Cutter has received personal fees for participation on Data and Safety Monitoring Boards from AstraZeneca, Avexis Pharmaceuticals, BioLineRx, Brainstorm Cell Therapeutics, Bristol Myers Squibb/Celgene, CSL Behring, the Eunice Kennedy Shriver National Institute of Child Health and Human Development (Obesity Policy Research Unit oversight committee), Galmed Pharmaceuticals, Hisun Pharmaceutical, Horizon Pharmaceuticals (formerly Viela Bio), Mapi Pharma, Merck, Merck/Pfizer, the National Heart, Lung, and Blood Institute (Protocol Review Committee), Neurim Pharmaceuticals, Novartis, OncoImmune, OPKO Biologics, Orphazyme, Reata Pharmaceuticals, Sanofi-Aventis, Teva Pharmaceuticals, and Vivus; personal fees for consulting or advisory board participation from BioDelivery Sciences International, Biogen, Click Therapeutics, Genentech, Genzyme, GW Pharmaceuticals, Immunic, Klein Buendel, MedDay, MedImmune, NeuroGenesis, Novartis, Osmotica Pharmaceuticals, Perception Neurosciences, Recursion/Cerexis Pharmaceuticals, Roche, and TG Therapeutics; is employed by the University of Alabama at Birmingham, AL, USA; and is President of Pythagoras, Inc., a private consulting company based in Birmingham, AL, USA. A.Green reports grants from the Conrad N. Hilton Foundation and the Tom Sherak MS Hope Foundation; other financial relationships (for activities as expert witness, associate editor, advisory board/steering committee participation, and endpoint adjudication) with Bionure, Inception Sciences, JAMA Neurology, MedImmune/Horizon Therapeutics (formerly Viela Bio), Mylan, Synthon, and Trims Pharma; and personal fees from and other financial relationships with Pipeline Therapeutics. H.-P.Hartung has received fees for consulting, speaking, and serving on steering committees from Bayer HealthCare, Biogen Idec, Celgene Receptos, CSL Behring, GeNeuro, Genzyme, Horizon Therapeutics (formerly Viela Bio), MedDay, MedImmune, Merck Serono, Novartis, Roche, Sanofi, and TG Therapeutics with approval by the Rector of Heinrich Heine University Düsseldorf. H.J.Kim has received a grant from the National Research Foundation of Korea; consultancy/speaker fees or research support from Alexion, AprilBio, Celltrion, Daewoong Pharmaceutical, Eisai, GC Pharma, HanAll Biopharma, Horizon Therapeutics (formerly Viela Bio), Kolon Life Science, MedImmune, Merck Serono, Mitsubishi Tanabe Pharma, Novartis, Sanofi Genzyme, Teva-Handok, and UCB; and is a co-editor for the Multiple Sclerosis Journal and an associate editor for the Journal of Clinical Neurology. K.Fujihara has received fees for consulting, speaking, and serving on steering committees from AbbVie, Alexion, Asahi Kasei Kuraray Medical Co., Biogen, Chugai/Roche, Eisai, Japan Tobacco, MedImmune/Viela Bio, Merck, Merck Biopharma, Mitsubishi Tanabe Pharma, Novartis, Teijin, Takeda Pharmaceutical Company, and UCB; and a grant-in-aid for scientific research from the Ministry of Health, Labour and Welfare of Japan. M.Levy currently receives research support from Acorda Therapeutics, Alexion, Alnylam Pharmaceuticals, ApoPharma, Maryland Technology Development Corporation, the National Institutes of Health, Sanofi Genzyme, and Shire/Takeda; has received personal compensation for consultation with Acorda Therapeutics, Alexion, and Genzyme; and serves on the scientific advisory boards for Acorda Therapeutics, Alexion, and Quest Diagnostics. B.A.C.Cree reports personal compensation for consulting from Alexion, Atara Biotherapeutics, Autobahn Therapeutics, Avotres Inc., Biogen, Boston Pharma, EMD Serono, Gossamer Bio, Hexal/Sandoz, Horizon Therapeutics, Neuron23, Novartis, Sanofi, Siemens, TG Therapeutics, and Therini Bio; and has received research support from Genentech.
Figures
References
-
- Wingerchuk D.M., Lennon V.A., Lucchinetti C.F., Pittock S.J., Weinshenker B.G. The spectrum of neuromyelitis optica. Lancet Neurol. 2007;6:805–815. - PubMed
-
- Kim Y., Kim S.Y., Han S.-M., et al. Functional impairment of CD19+CD24hiCD38hi B cells in neuromyelitis optica spectrum disorder is restored by B cell depletion therapy. Sci Transl Med. 2021;13 - PubMed
Publication types
MeSH terms
Substances
Associated data
LinkOut - more resources
Full Text Sources
Other Literature Sources
Medical
