. 2022 Dec 13;55(12):2369-2385.e10.
doi: 10.1016/j.immuni.2022.10.020. Epub 2022 Nov 11.

The transcription factor IRF2 drives interferon-mediated CD8+ T cell exhaustion to restrict anti-tumor immunity

Affiliations

The transcription factor IRF2 drives interferon-mediated CD8+ T cell exhaustion to restrict anti-tumor immunity

Sabelo Lukhele et al. Immunity. .

Abstract

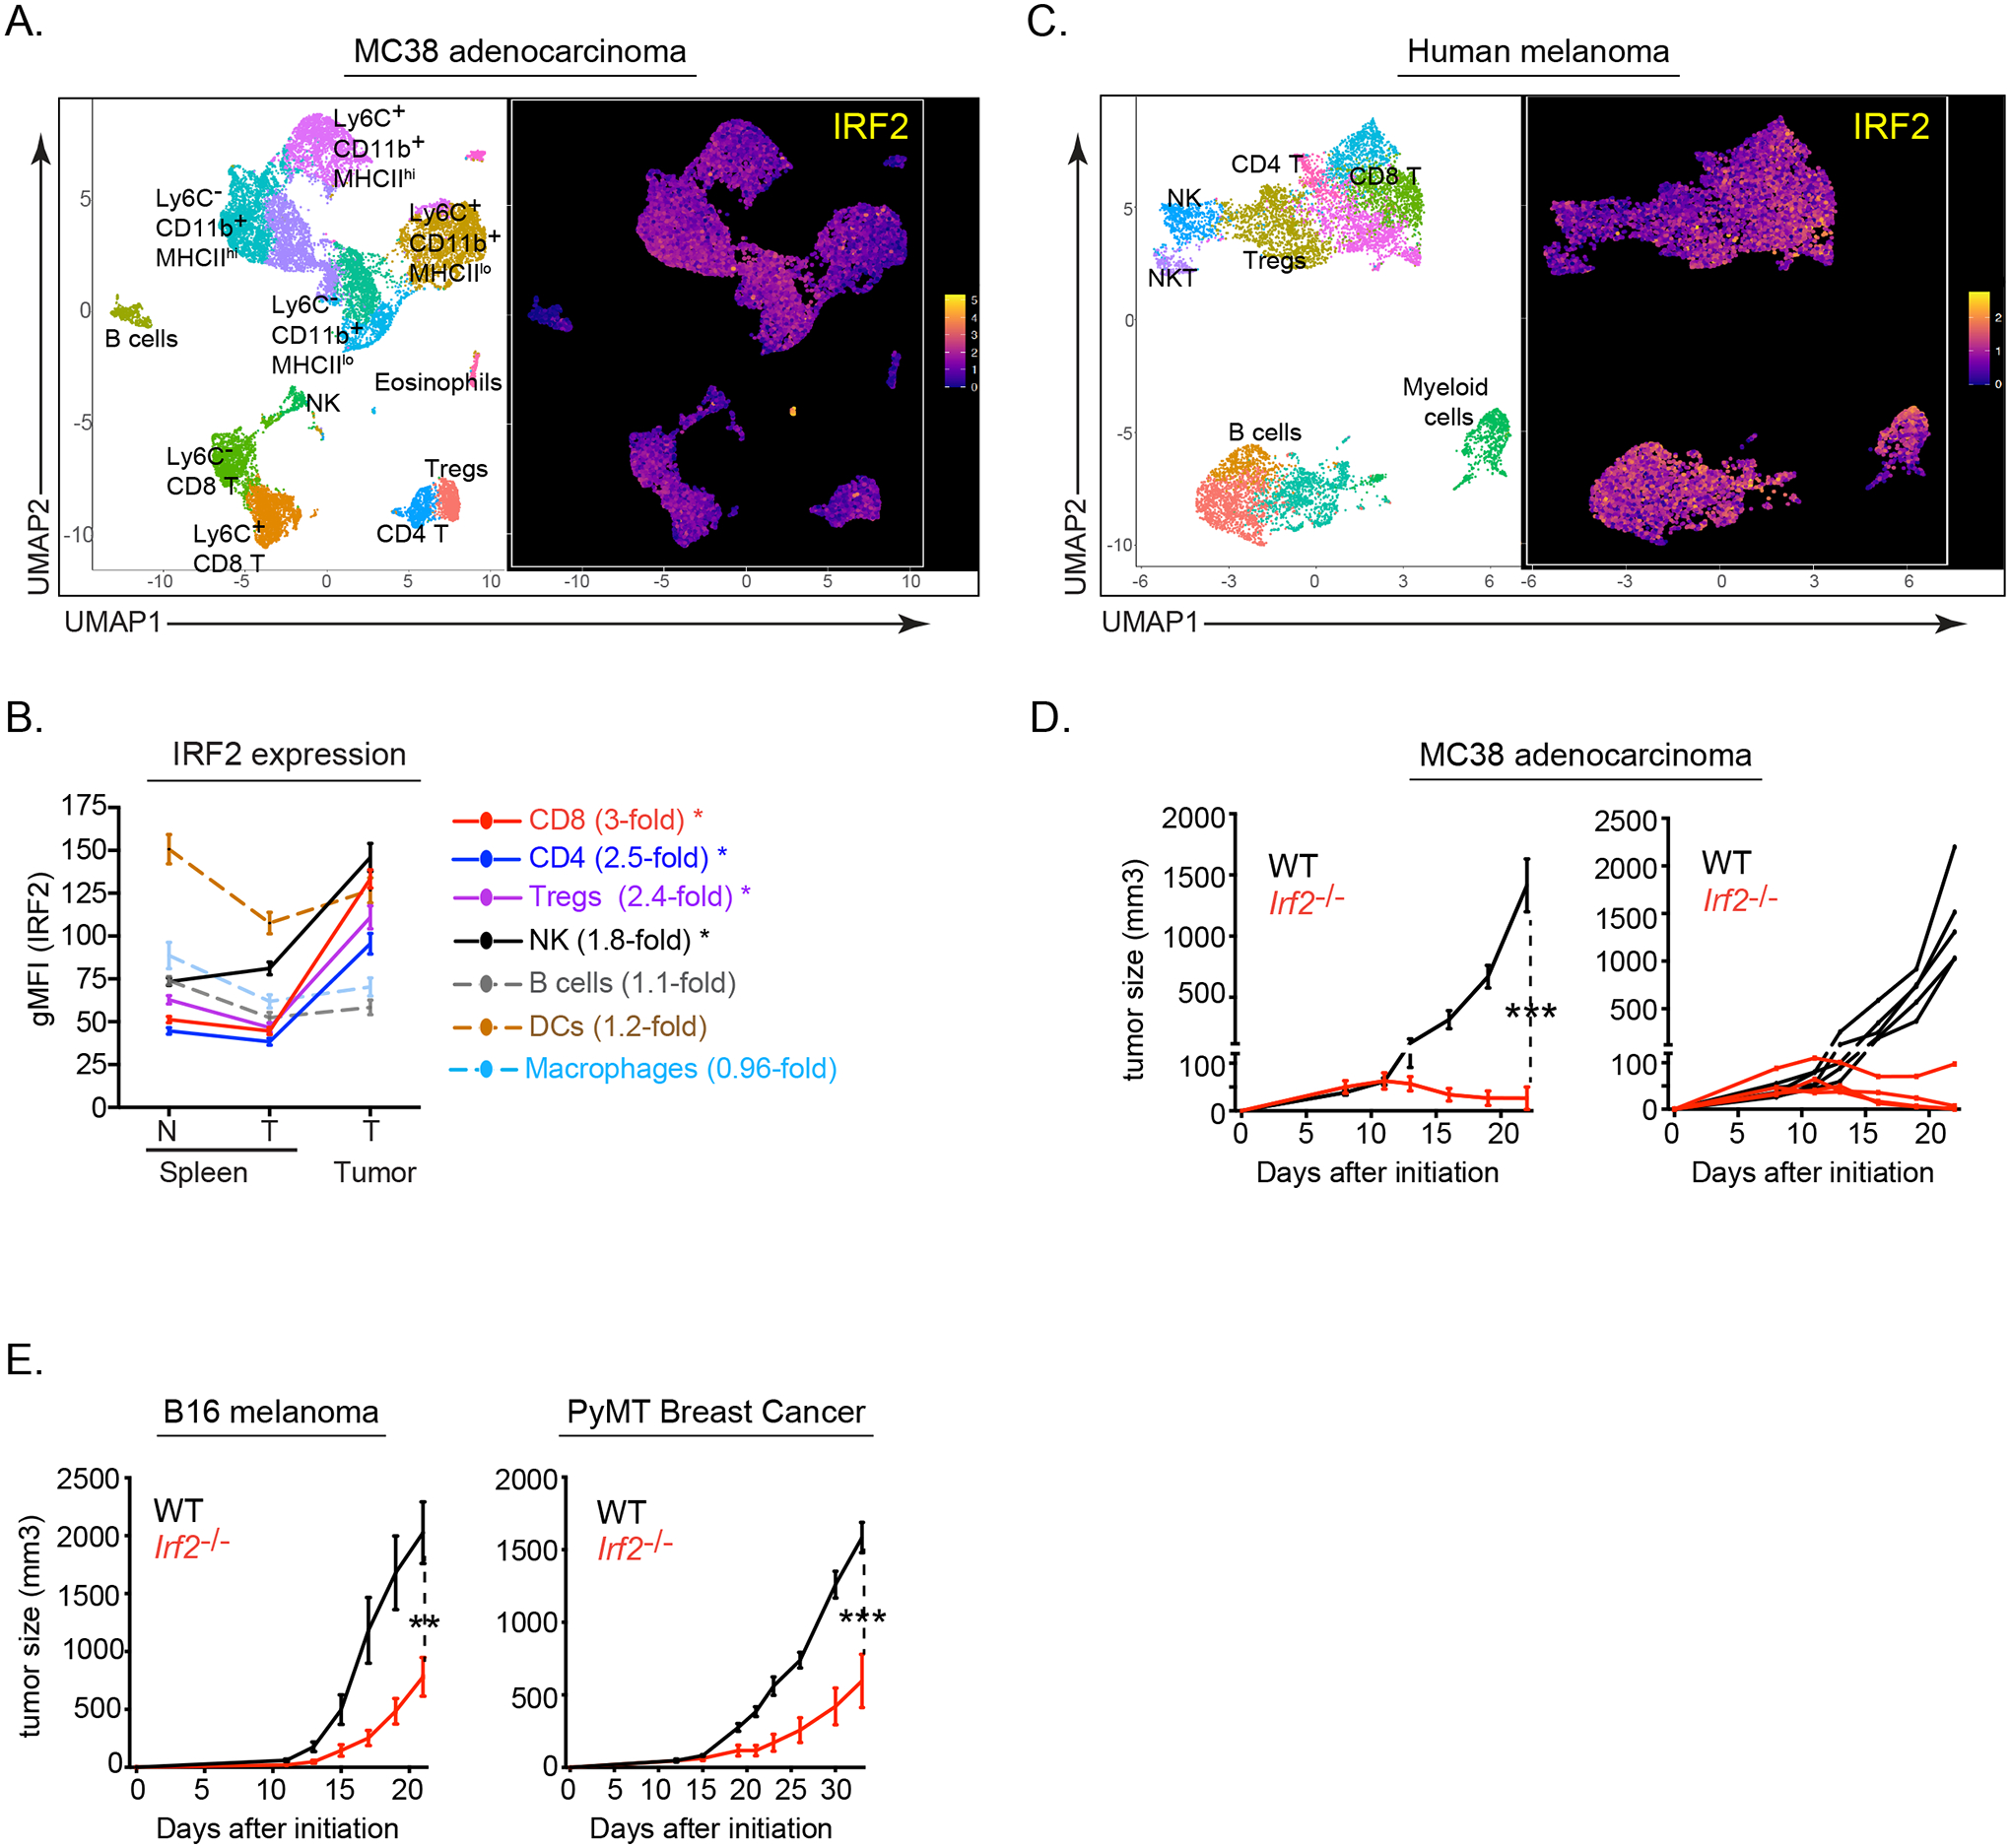
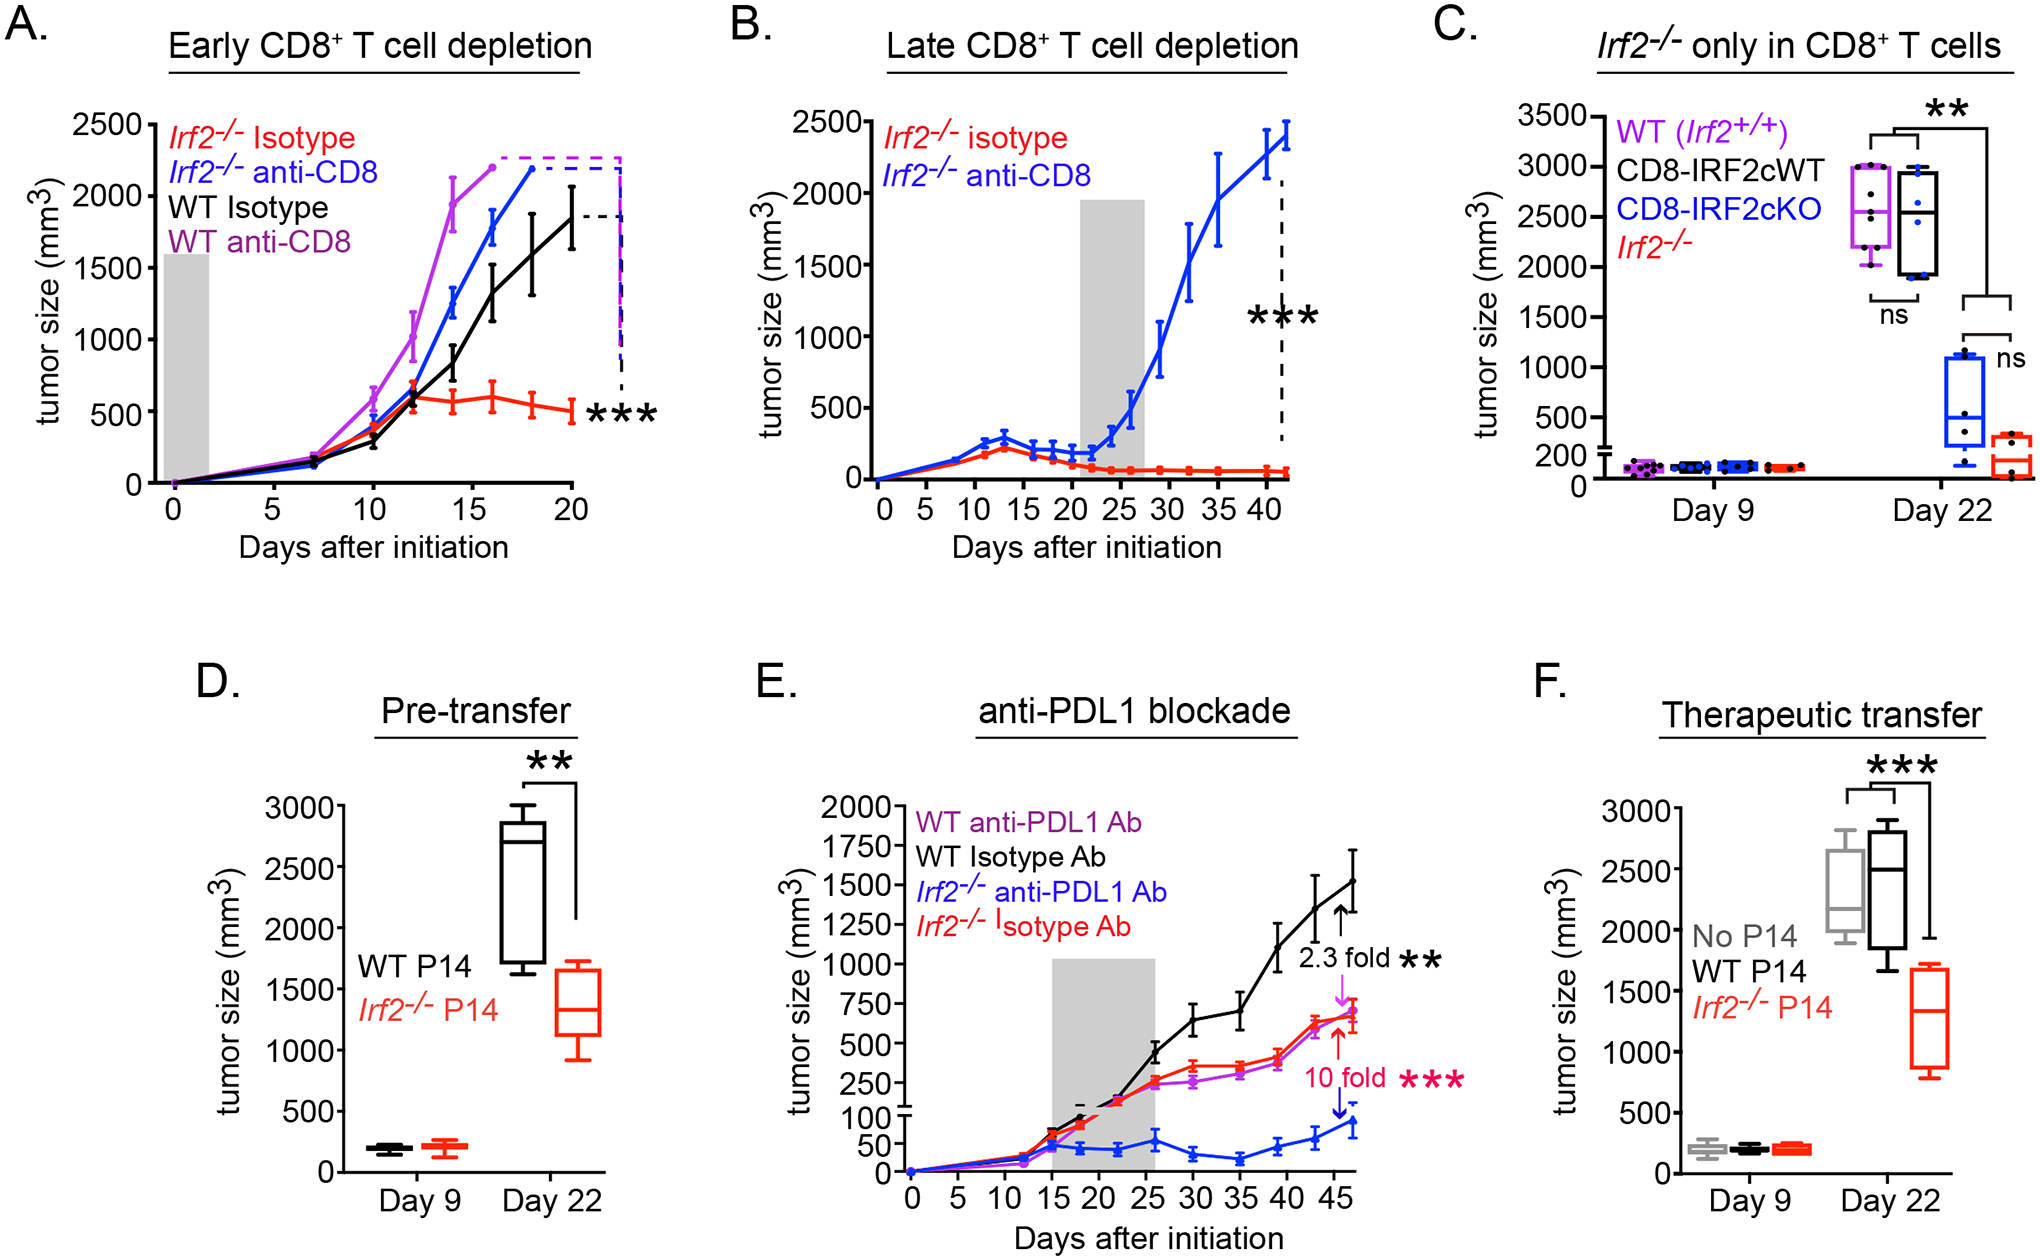
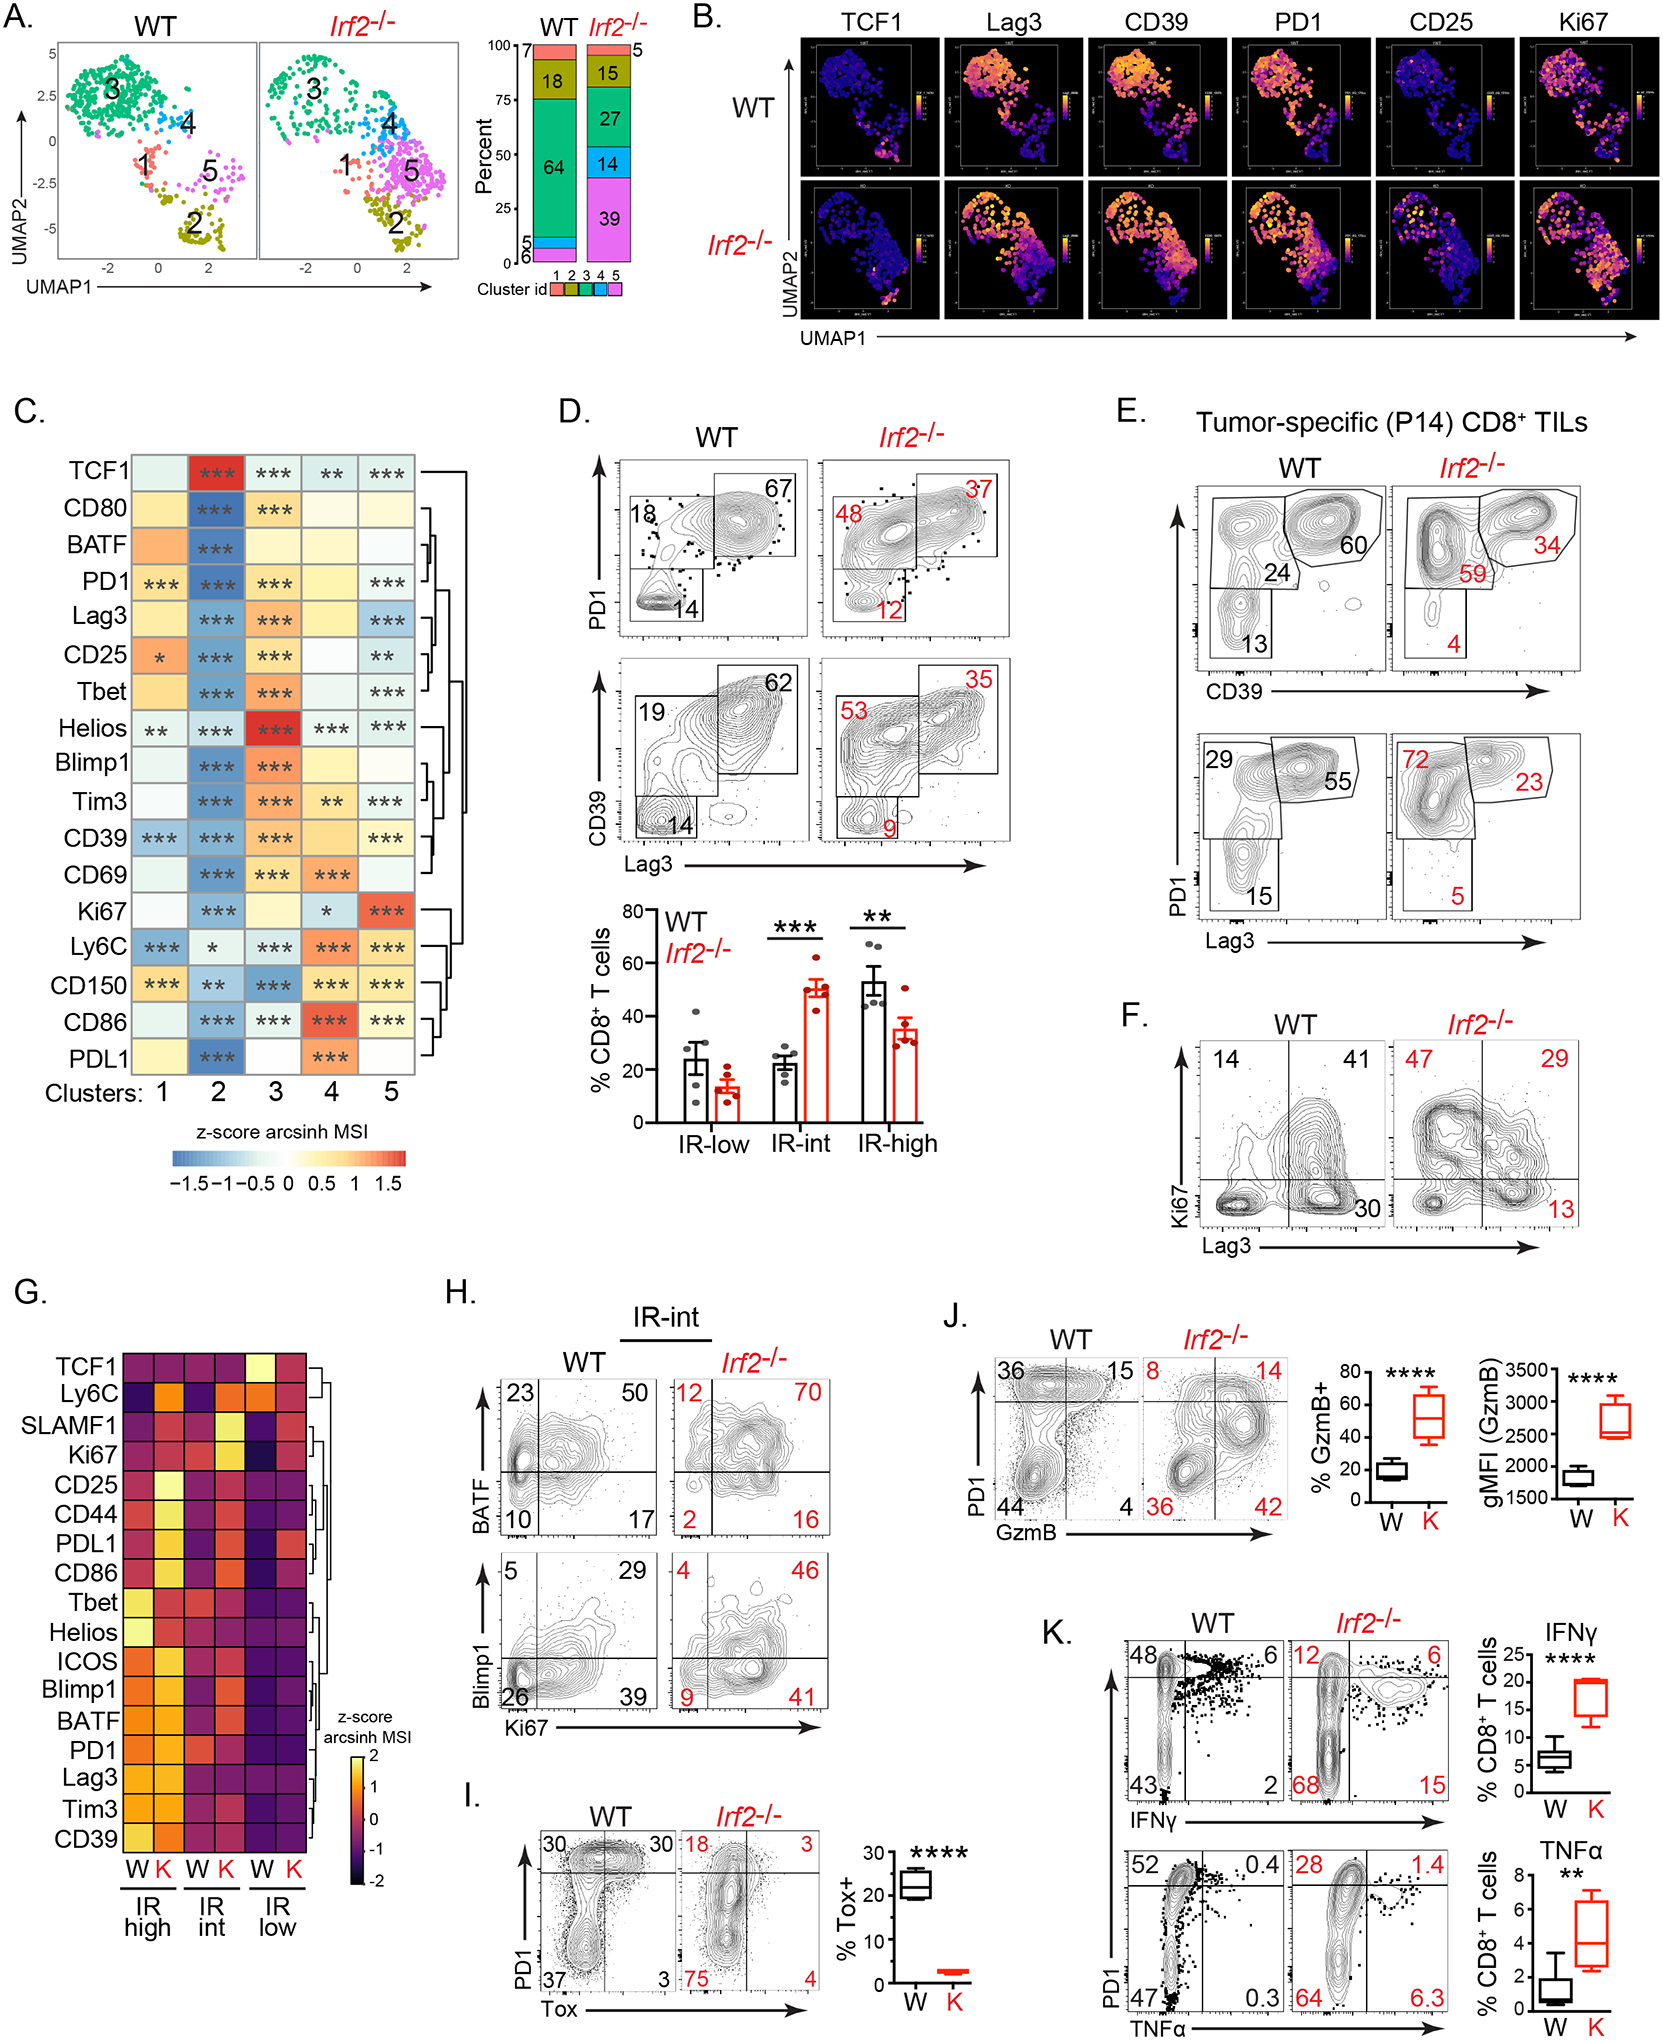
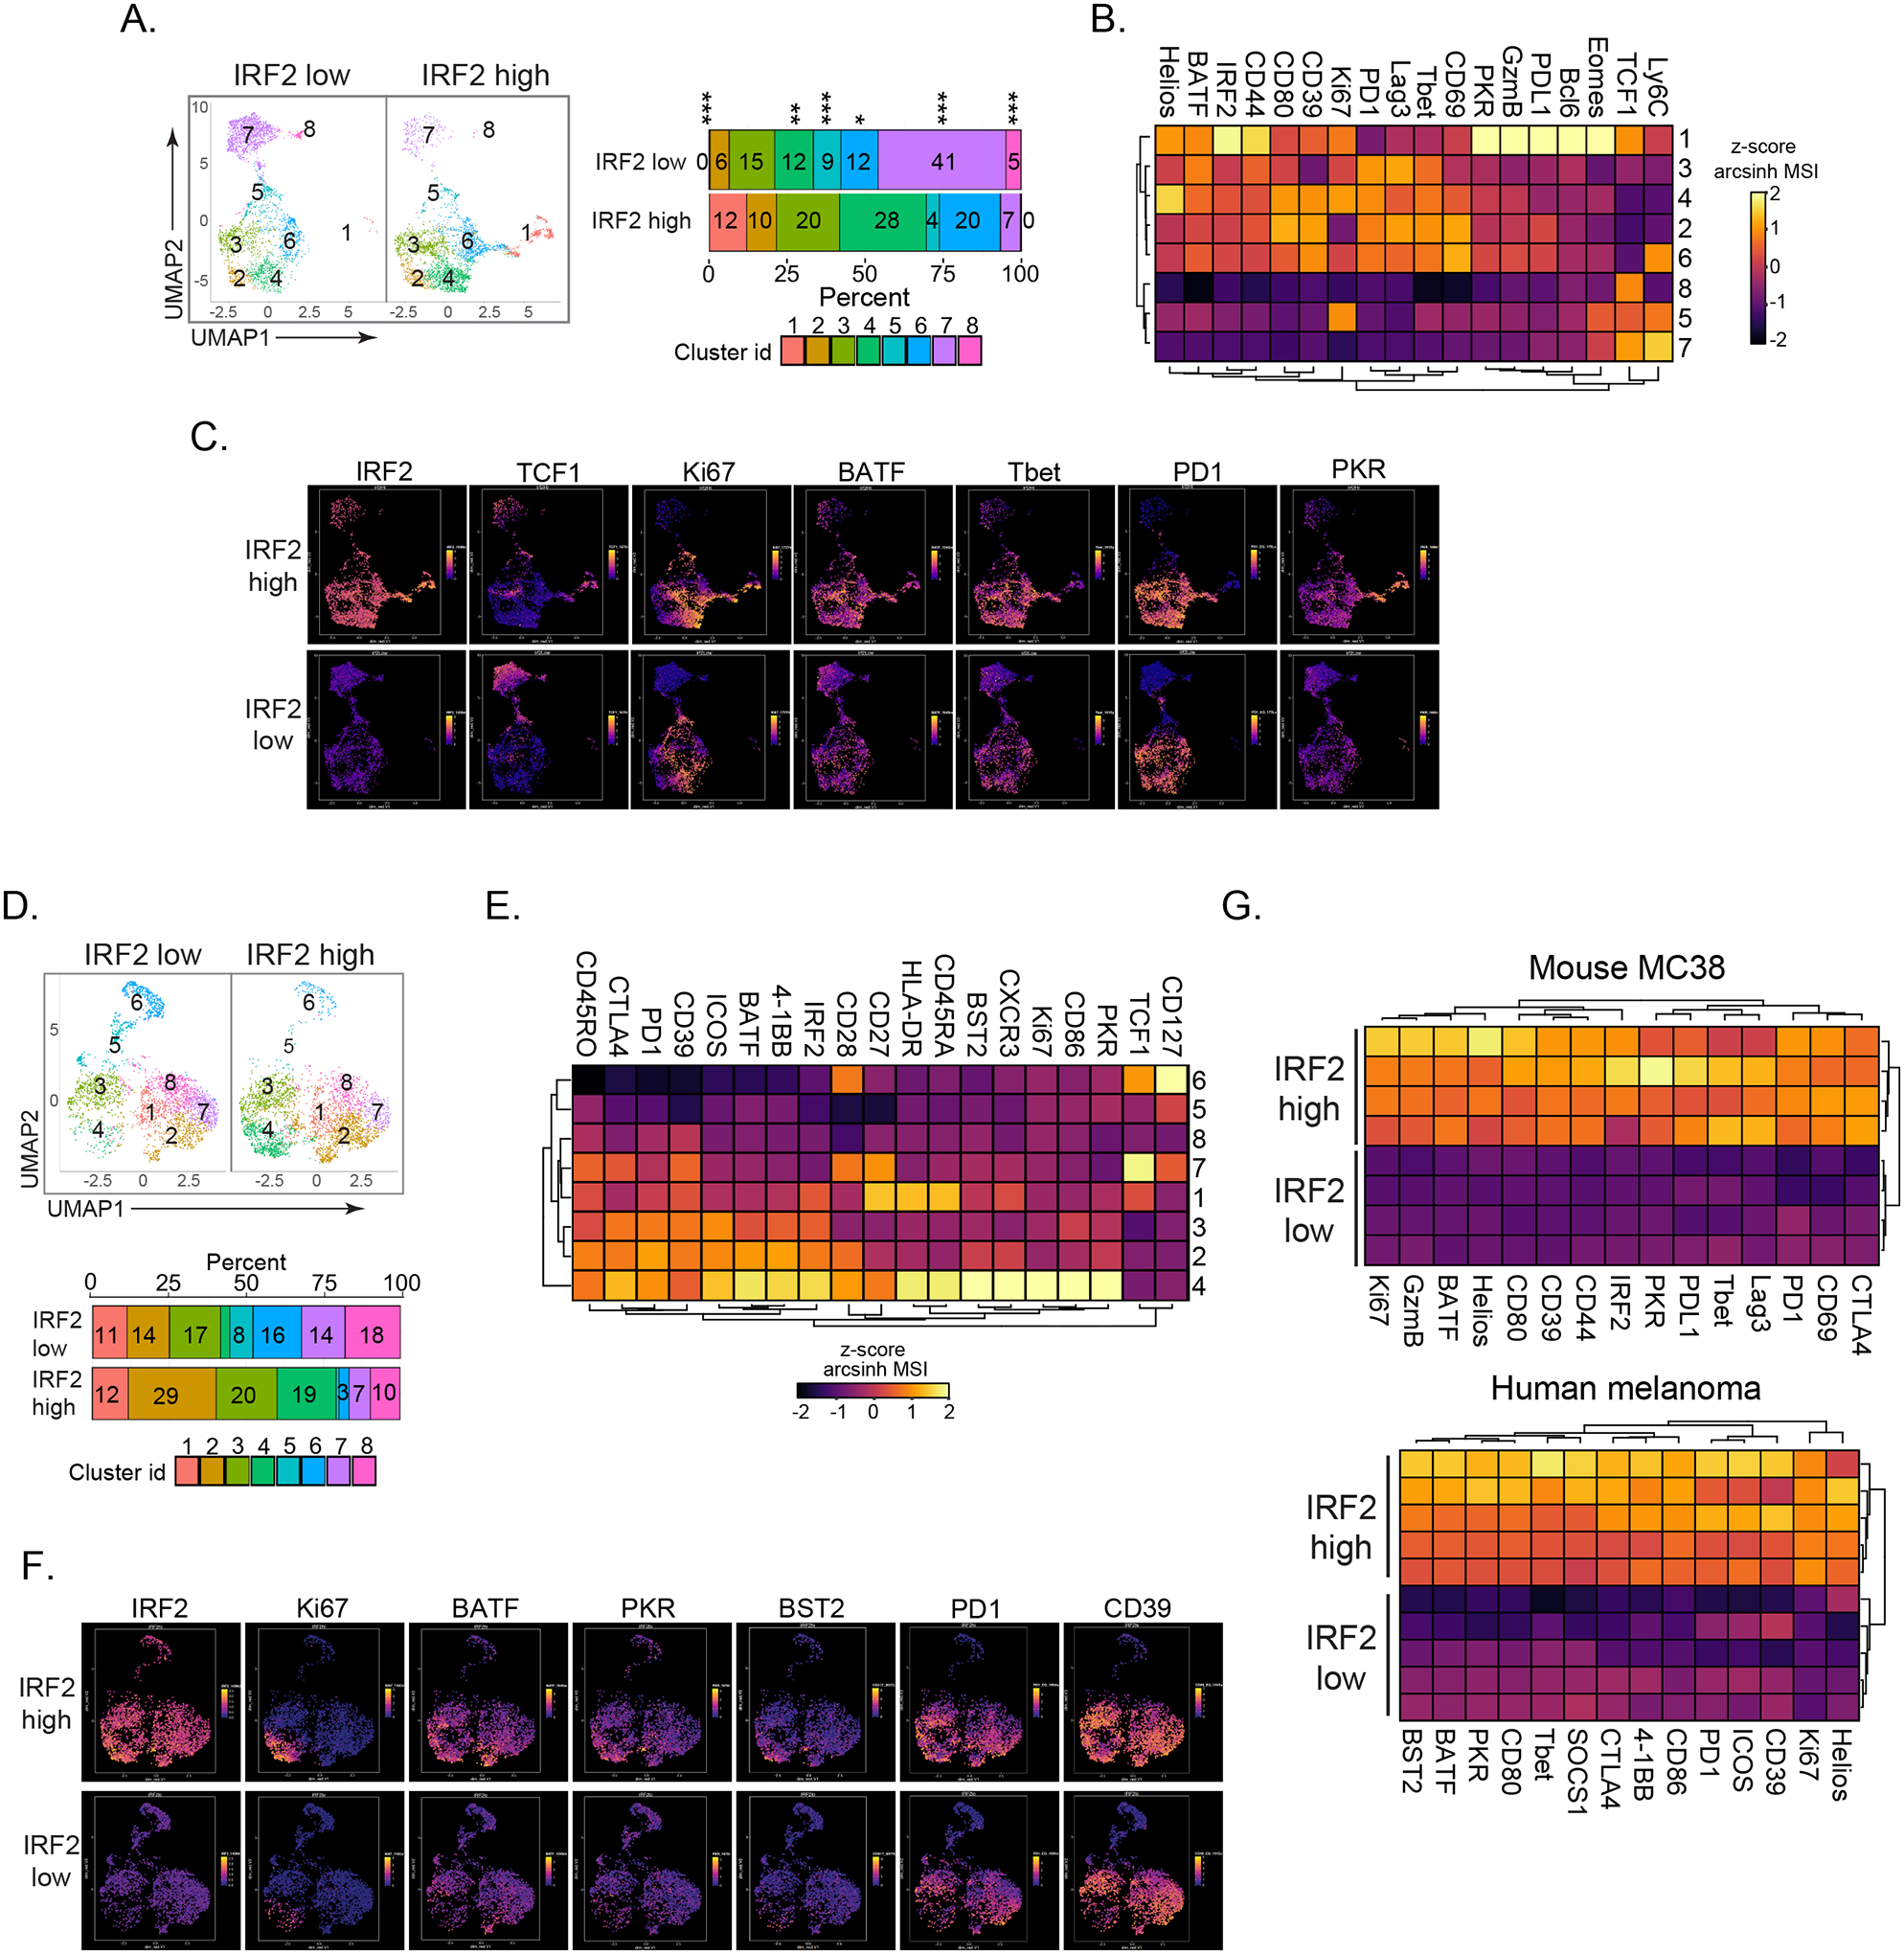
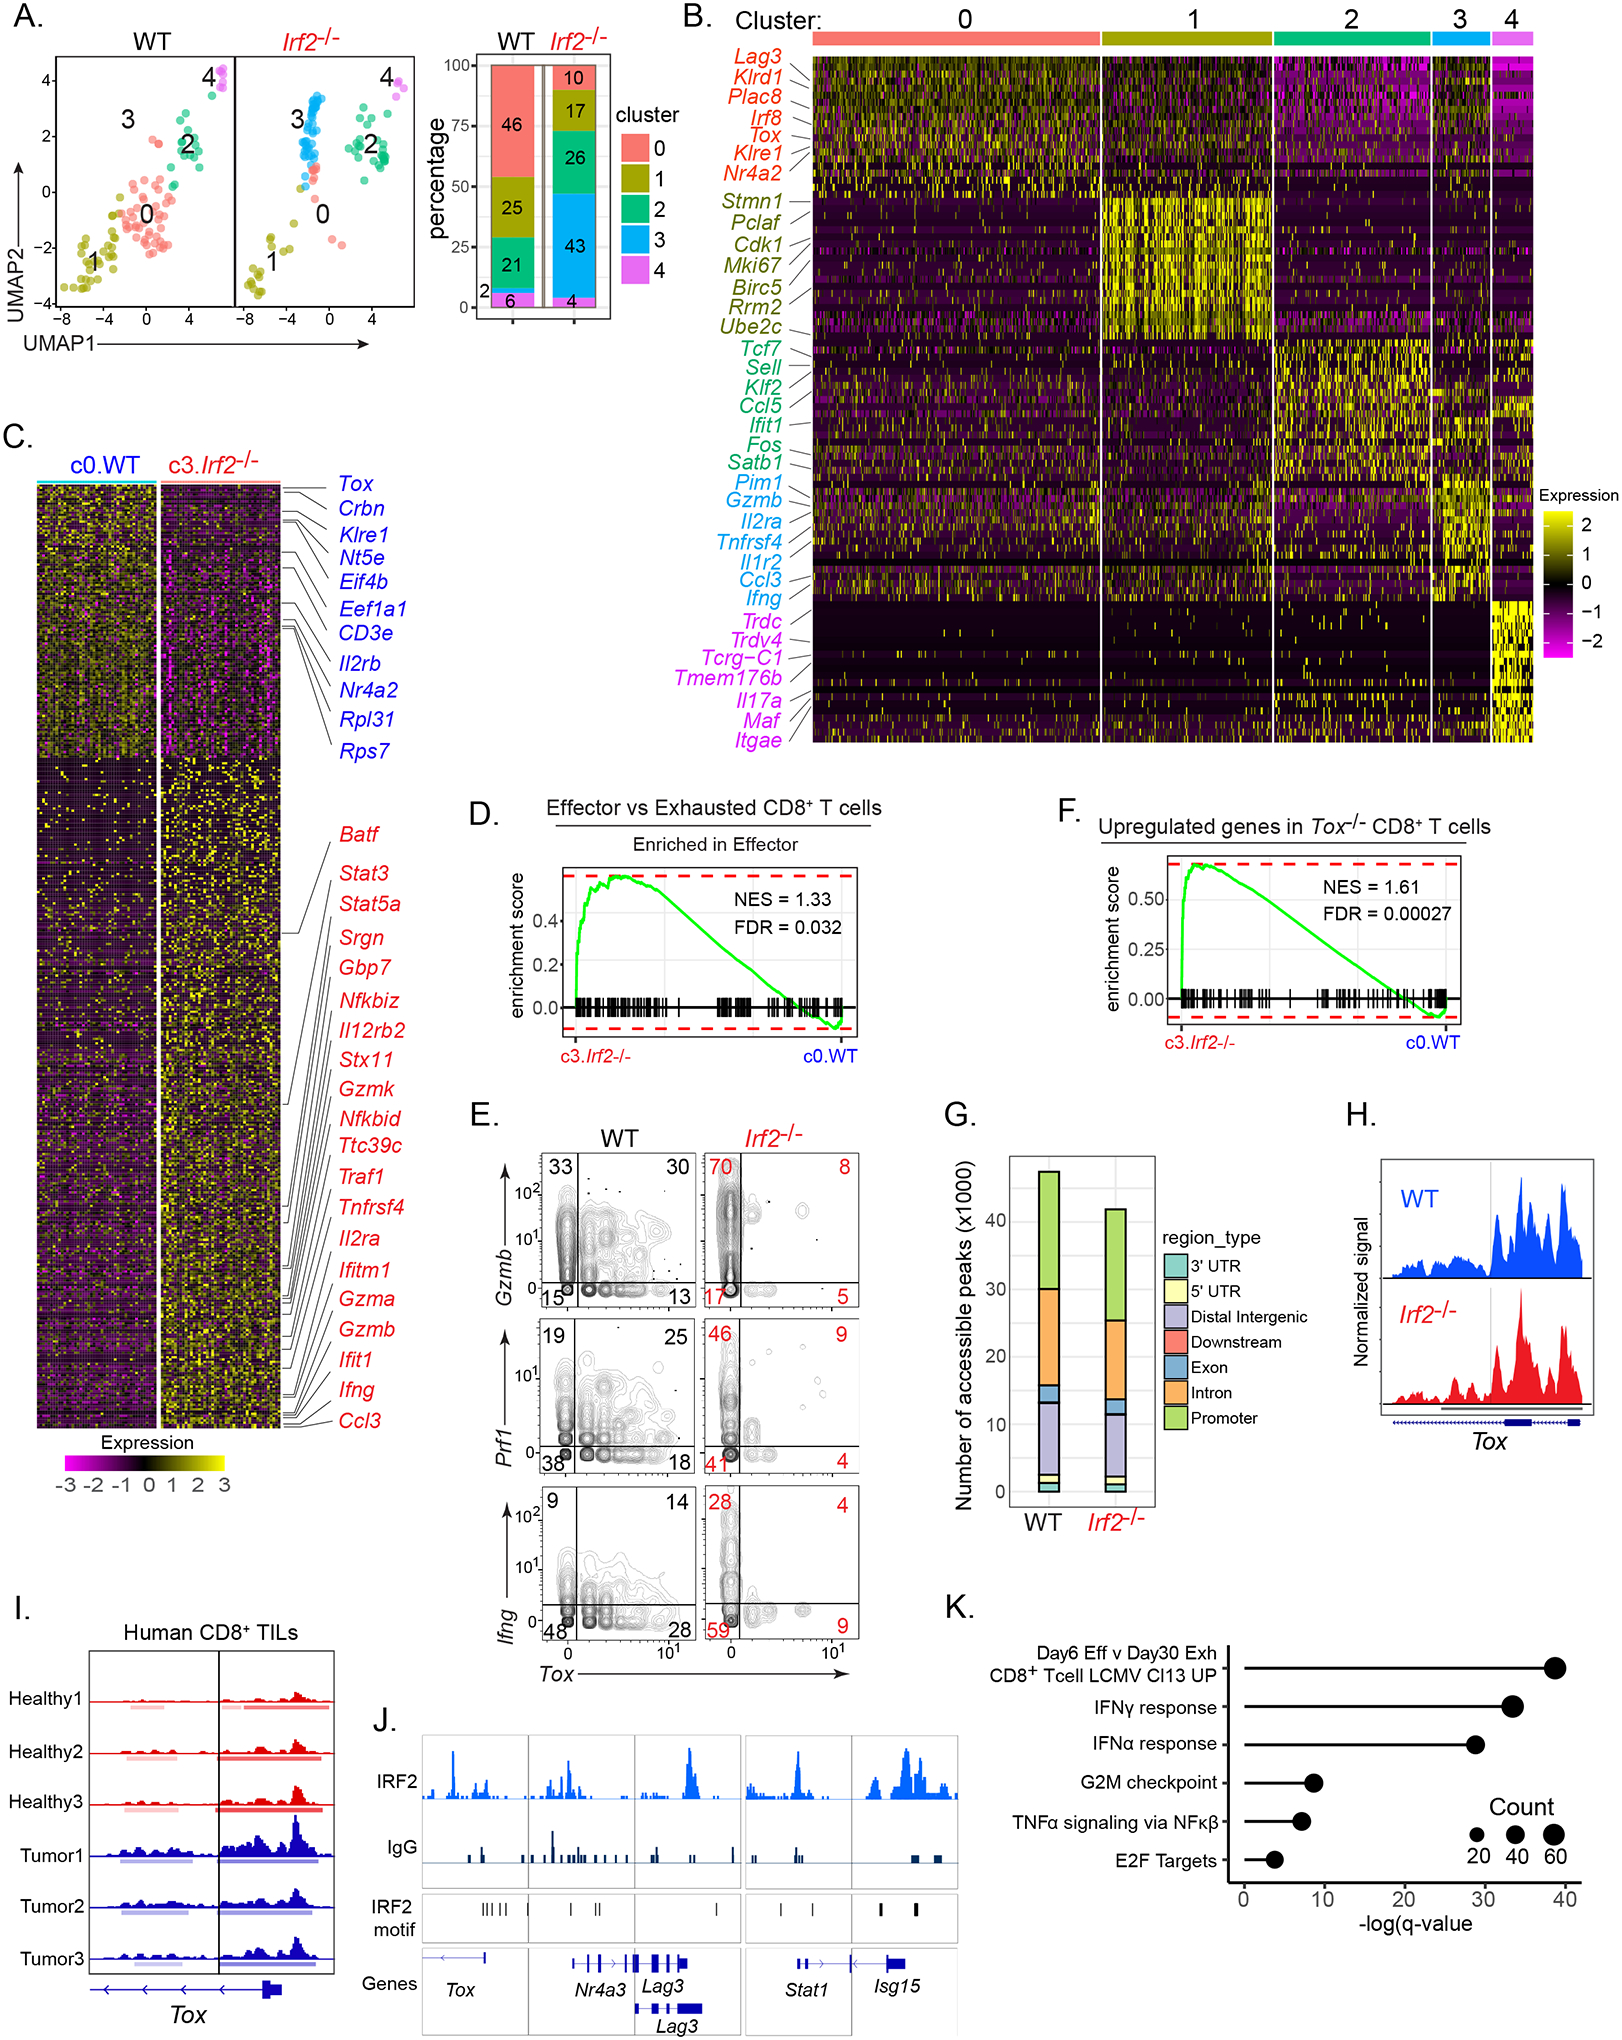
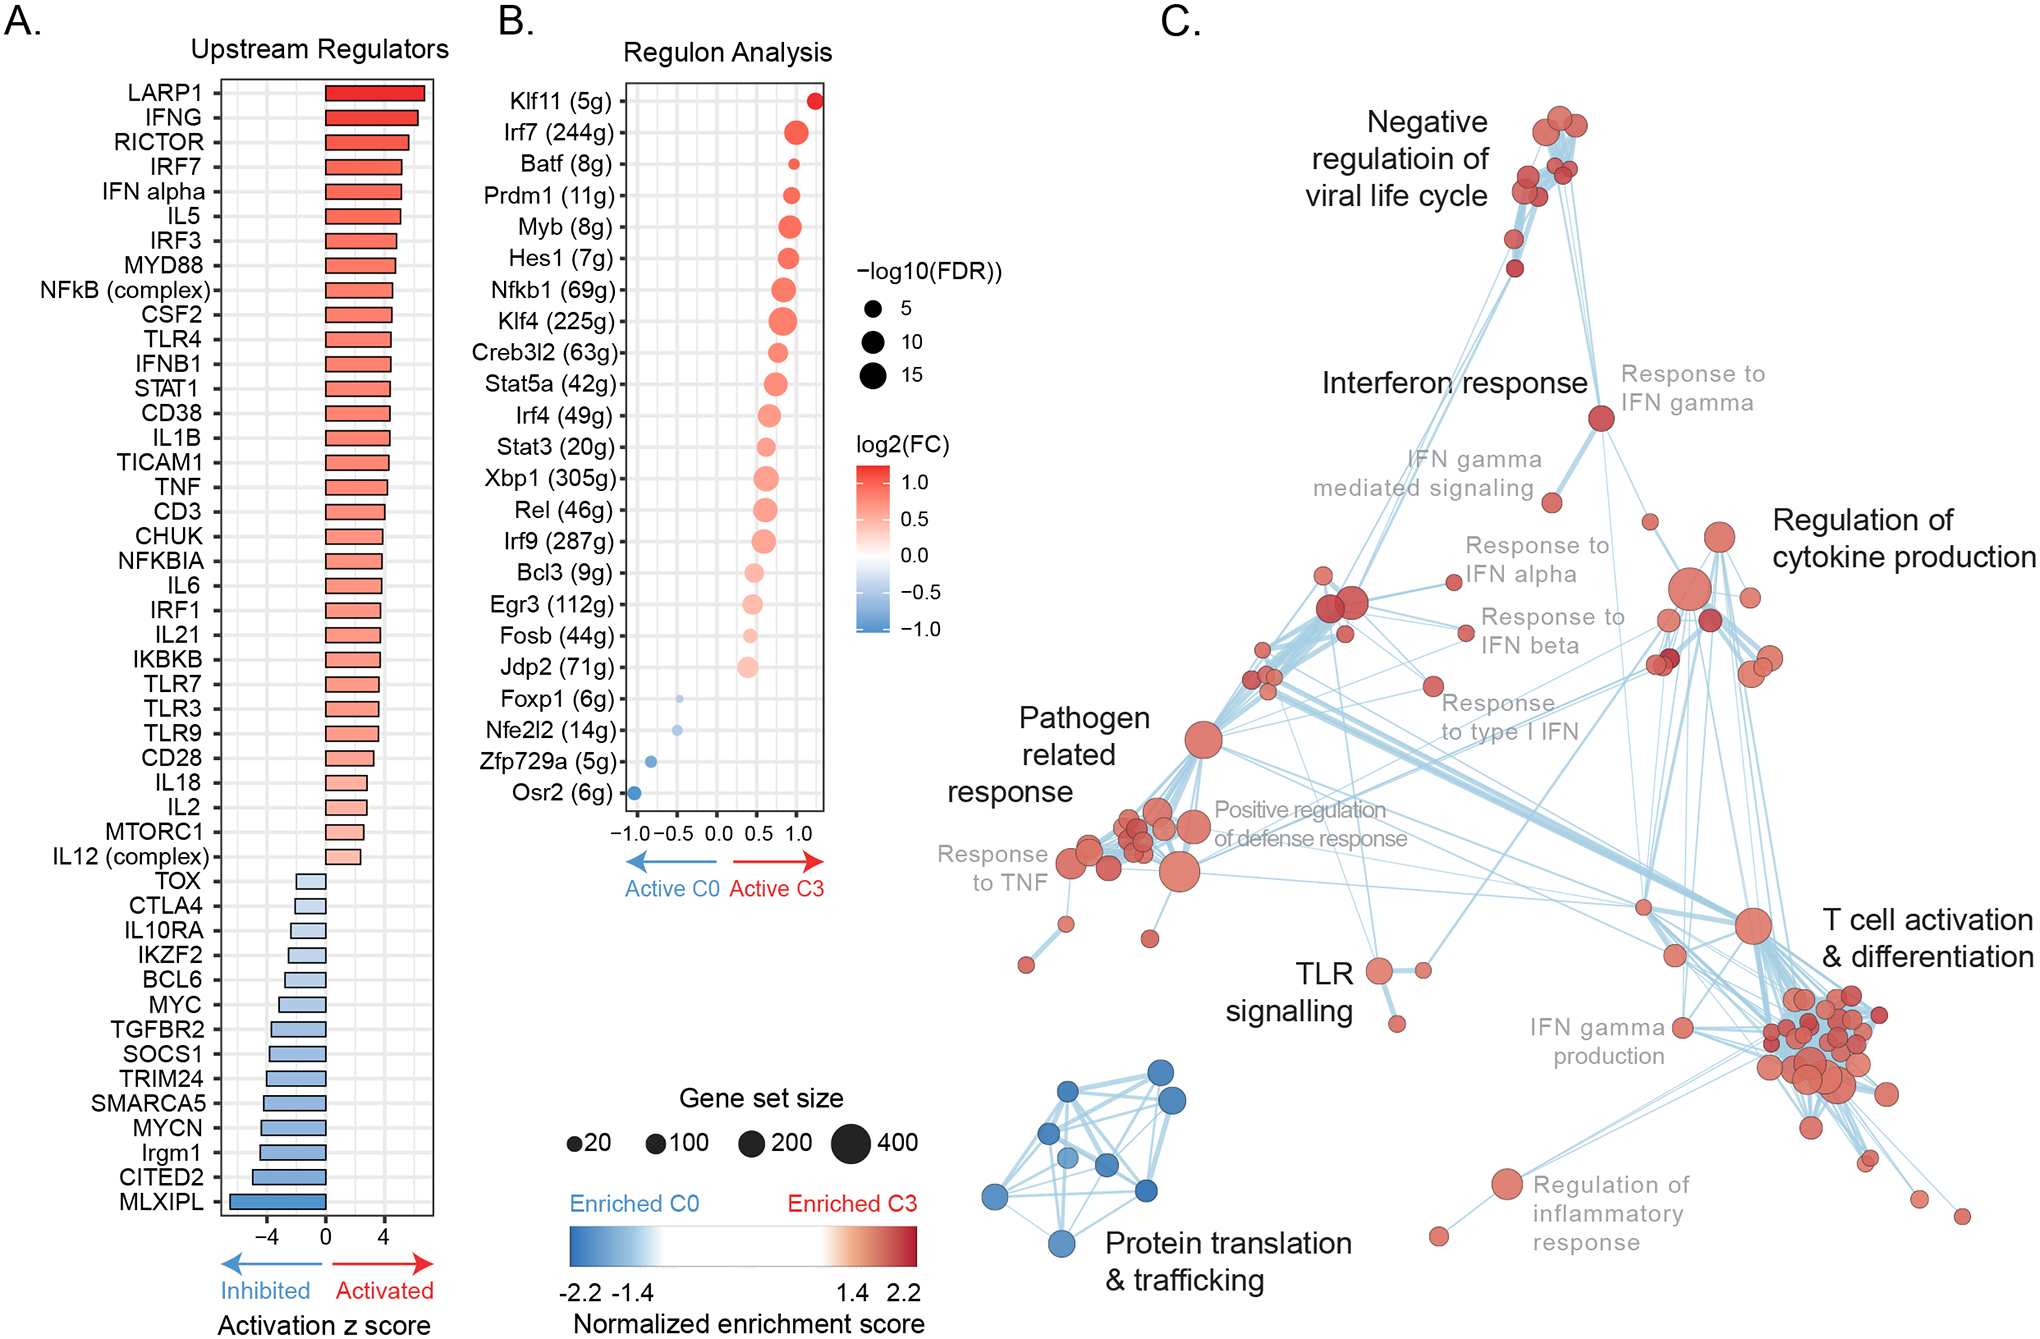
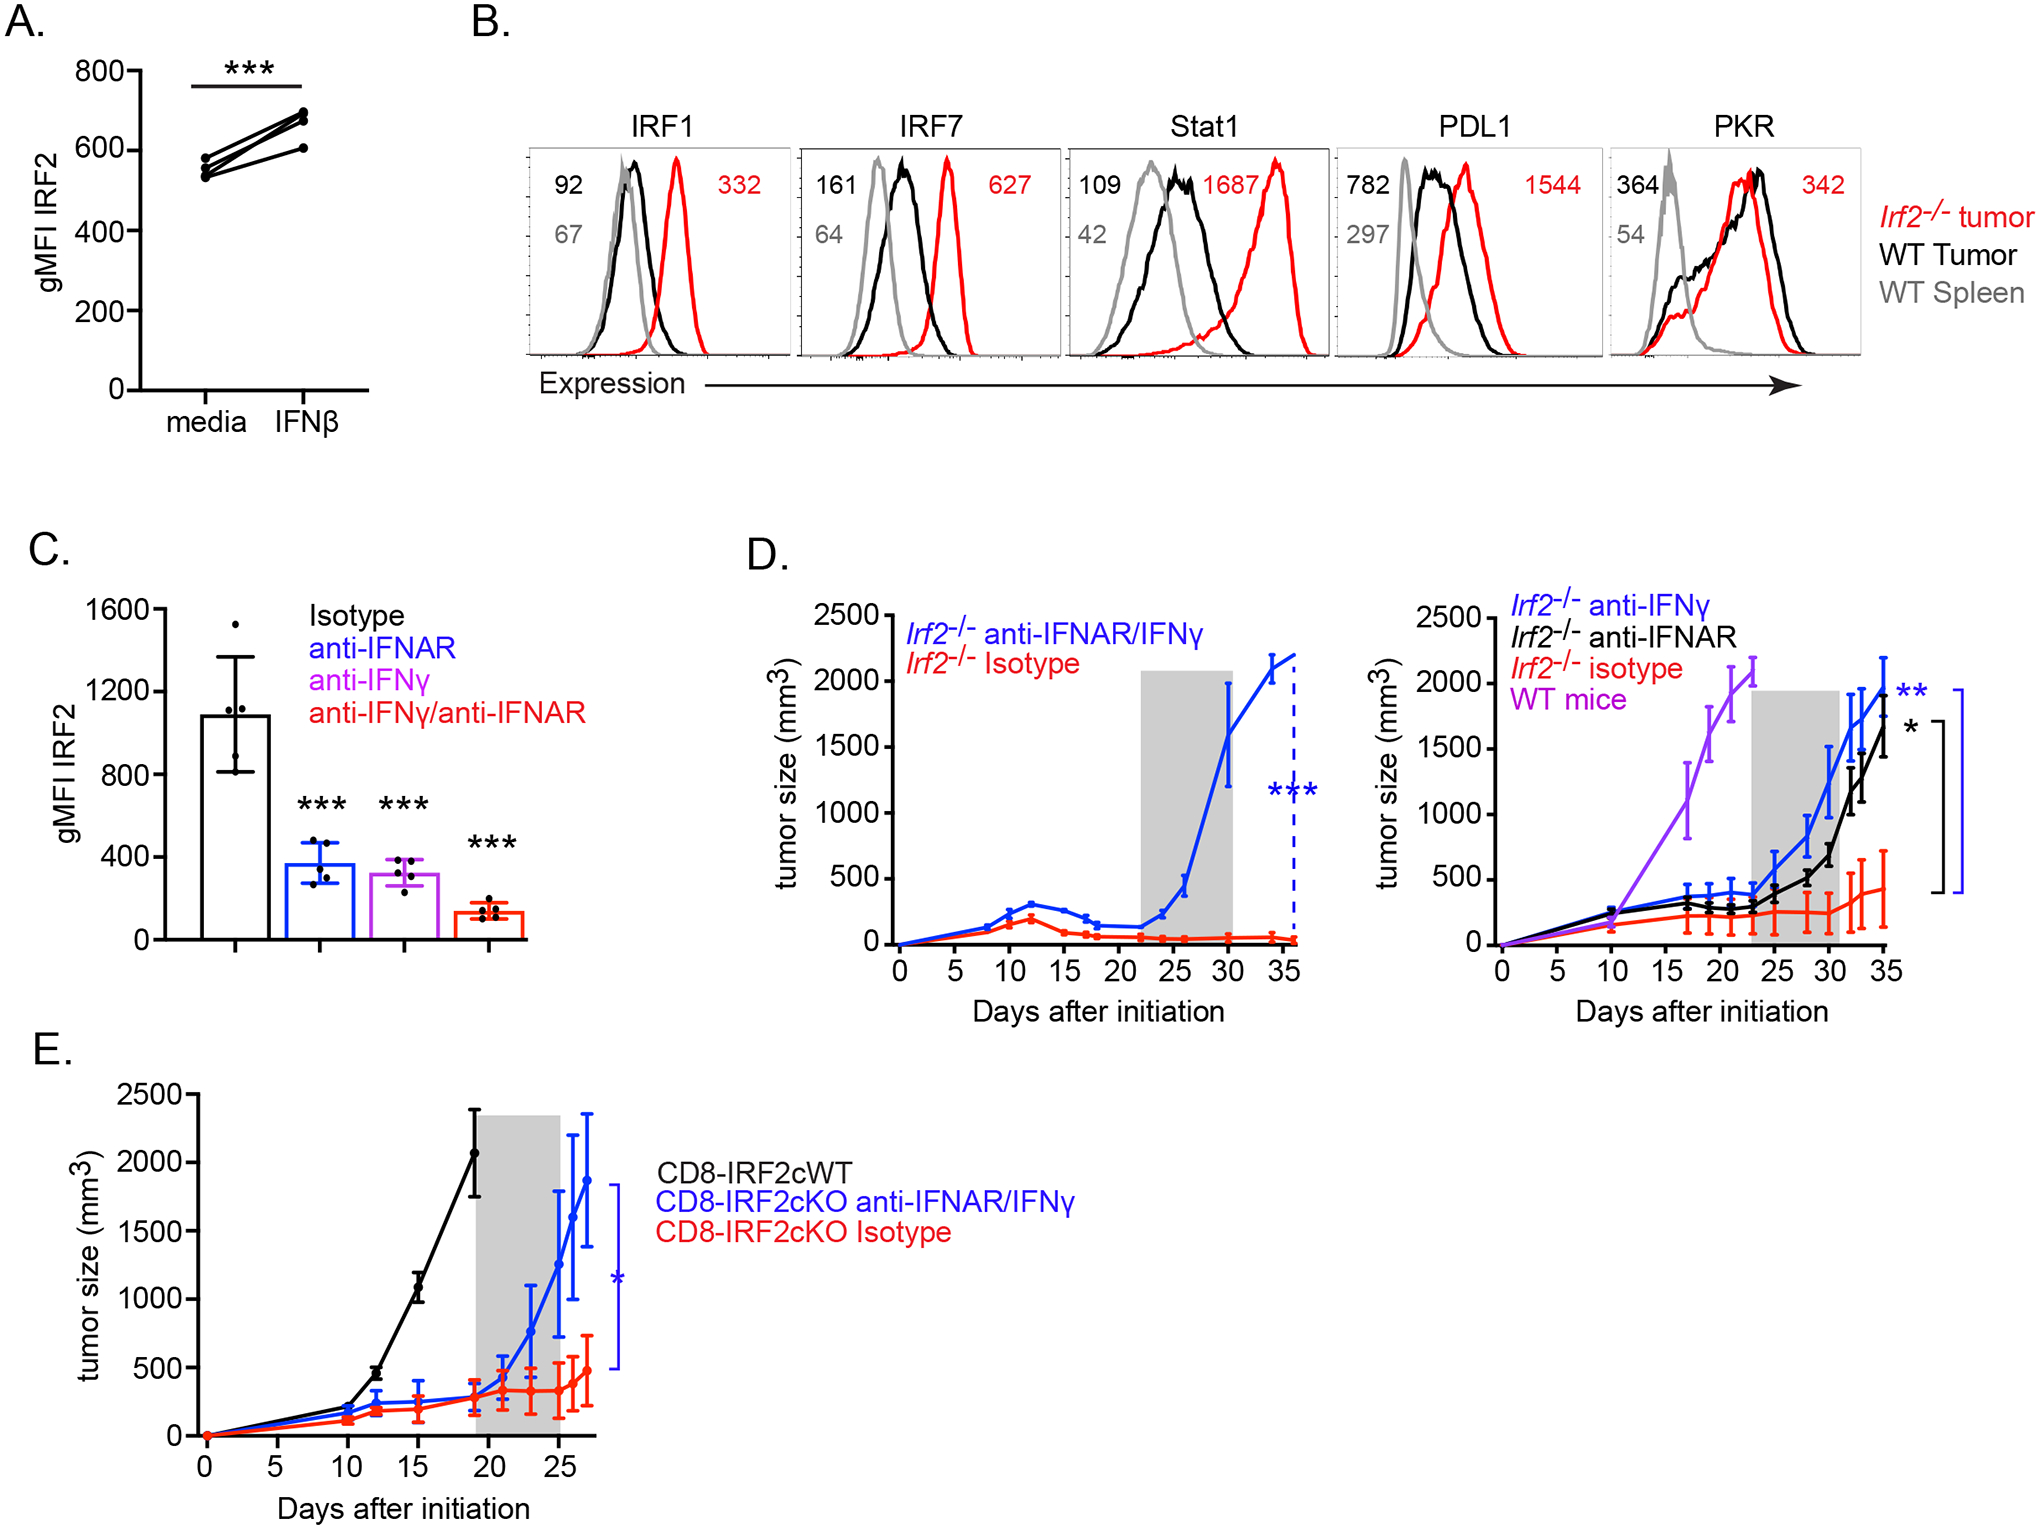
Type I and II interferons (IFNs) stimulate pro-inflammatory programs that are critical for immune activation, but also induce immune-suppressive feedback circuits that impede control of cancer growth. Here, we sought to determine how these opposing programs are differentially induced. We demonstrated that the transcription factor interferon regulatory factor 2 (IRF2) was expressed by many immune cells in the tumor in response to sustained IFN signaling. CD8+ T cell-specific deletion of IRF2 prevented acquisition of the T cell exhaustion program within the tumor and instead enabled sustained effector functions that promoted long-term tumor control and increased responsiveness to immune checkpoint and adoptive cell therapies. The long-term tumor control by IRF2-deficient CD8+ T cells required continuous integration of both IFN-I and IFN-II signals. Thus, IRF2 is a foundational feedback molecule that redirects IFN signals to suppress T cell responses and represents a potential target to enhance cancer control.

Keywords: CD8(+) T cells; CyTOF; IRF2; T cell exhaustion; adoptive cell transfer; cancer; immunotherapy; interferon gamma; interferon regulatory factor 2; type I interferon.


Conflict of interest statement

Declaration of interests The authors declare no competing interests.

Figures

Figure 1.
Figure 1.. IRF2 expression across immune subsets and IRF2 deficiency enables tumor control.
(A) UMAP plots of CyTOF data showing IRF2 expression in PhenoGraph-defined CD45+ tumor-infiltrating immune cell clusters from mouse MC38 adenocarcinoma tumors. (B) Graph showing IRF2 expression (gMFI) in the spleens of naïve (N) mice or from mice with MC38 tumors (T), as well as from tumor-infiltrating immune cells. Numbers next to the cell type indicate the fold change between IRF2 expression in the tumor compared to the spleens from those same mice. * p<0.01. (C) UMAP plots of CyTOF data showing IRF2 expression and distribution in PhenoGraph-defined CD45+ tumor-infiltrating immune cell clusters from human melanoma tumors. (D) Tumor growth kinetics of wildtype (WT, black) and Irf2−/− (red) mice following implantation with MC38 tumor cells. Longitudinal line graphs show the average tumor volumes +/− standard error from the mean (SEM; left) and the tumor volumes of the individual mice (right). (E) Average tumor volumes ± SEM of wildtype (WT, black) and Irf2−/− (red) mice following implantation with B16-F10 cells or PyMT cells.. Data are representative of at least two independent experiments containing 5 or more mice per group in each experiment. A total of 5 human melanoma tumors were assessed for IRF2 expression., *p<0.01, ** p<0.001, *** p< 0.0001. One-way ANOVA for multiple comparisons used for tumor growth kinetics.
Figure 2.
Figure 2.. Tumor control required CD8+ T cell-intrinsic IRF2 expression
Tumor growth kinetics in WT or Irf2−/− mice that received isotype control or anti-CD8 depleting antibody either (A) one day before (early CD8+ T cell depletion) or (B) 21 days after (late CD8+ T cell depletion) MC38 initiation. For late depletion, only Irf2−/− mice were used since WT mice had already reached endpoint by day 21. Shaded region indicates duration of antibody treatment. (C) MC38 tumor growth in WT control (i.e., Irf2+/+, purple), CD8-IRF2cWT (i.e., Irf2+/+ CD8Cre+ mice, black), CD8-IRF2cKO (IRF2-deficient only in CD8+ T cells; blue), or Irf2−/− (red) mice. (D) Tumor size after WT mice received 2×10⁵ naïve WT (black) or Irf2−/− (red) P14 T cells one day prior to receiving MC38-GP tumor. (E) Tumor growth in WT or Irf2−/− mice with orthotopic PyMT breast tumor cells that were treated with isotype or anti-PDL1 blocking antibody beginning on day 15 after tumor implantation. Number in graph indicates the fold change in tumor size between the isotype vs. anti-PDL1 treatment for WT or Irf2−/− mice. Shaded region indicates duration of antibody treatment. (F) MC38-GP tumoresize after WT mice received 2×10⁵ pre-activated WT (black) or Irf2−/− (red) P14 T cells (i.v.) on day 9 after tumor initiation. Data are representative of at least two independent experiments. Error bars represent mean ± SEM. ** p<0.001, *** p< 0.0001. One-way ANOVA for multiple comparisons used for tumor growth kinetics.
Figure 3.
Figure 3.. IRF2-deficient CD8+ T cells resist exhaustion and maintain functionality in the TME.
(A) UMAP plots of CyTOF data showing PhenoGraph-defined clusters of WT and Irf2−/−CD8+ TILs on day 12 after MC38 initiation. The bar graph depicts the proportion of each cluster in WT and Irf2−/− mice. (B) UMAP plots show the single-cell expression of the indicated protein in CD8+ TILs from panel A. (C) The heatmap represents relative expression (normalized z-scores of the arcsinh transformed mean signal intensity; MSI) of the indicated protein in each cluster from panel A compared to the other clusters combined using Wilcoxon rank-sum test. (D) Eexpression of the inhibitory receptors (IR) CD39, PD1 and Lag3 in WT and Irf2−/−CD8+ TILs. Numbers in the plots show the percent of cells in each gate. The graph compares proportions of CD8+ T cells expressing low, intermediate or high levels of IRs combined from 4 independent experiments. Error bars represent SEM. (E) Expression of CD39, PD1 and Lag3 in WT and IRF2−/− tumor-specific CD8+ P14 T cells from mice implanted with MC38-GP tumors. Numbers show percent of cells in each gate. (F) Ki67 expression in WT and Irf2−/−CD8+ TILs. Numbers indicate the percent of cells in each quadrant. (G) Heatmap depicting expression (z-score of median) of the indicated protein in IR-low, IR-int and IR-hi WT (W) or Irf2−/− (K) CD8+ TILs. (H) BATF, Blimp1 and Ki67 expression by IR-int WT and Irf2−/−CD8+ TILs. Numbers indicate the percent of cells in each quadrant. (I and J) PD1, Tox and GzmB expression in WT and Irf2−/−CD8+ TILs. Graphs indicate the proportions of cells expressing and the per-cell expression levels (gMFI) of the indicated protein. (K) Flow plots show IFNγ and TNFα production in ex vivo GP33–41 peptide stimulated CD8+ TILs on day 12 after MC38-GP initiation. Graphs indicate the proportions of cells expressing IFNγ and TNFα. Data are representative of at least three independent experiments. In each experiment, tumors from 4–7 mice were pooled from WT or Irf2−/− mice to obtain sufficient numbers of CD8+ TILs for analysis. * p<0.05, ** p<0.01, *** p<0.001, **** p< 0.0001.
Figure 4.
Figure 4.
IRF2 is highly expressed in activated and ISG-producing mouse and human CD8+ TILs. CD8+ TILs were divided into IRF2 high (upper 30%) and low (lower 30%) levels of IRF2 expression. (A) PhenoGraph-defined clusters divided into IRF2 high and IRF2 low CD8+ T cells from mouse MC38 tumors (day 14). Bar graph depicts the proportion of each cluster in their respective groups. (B) Heatmap represents expression of the indicated protein in each cluster. (C) Expression and distribution of the indicated protein in the IRF2 high and low clusters of MC38-infiltrating CD8+ T cells. (D-F) IRF2 distribution in human melanoma tissue biopsies. (D) CD8+ TILs were divided into IRF2 high and low fractions and then clustered as in panel A. Shown is one representative tumor. Bar graph depicts the proportion of each cluster in their respective groups. (E) Heatmap represents expression of the indicated protein in each cluster. (F) Expression and distribution of the indicated protein in the IRF2 high and low clusters of CD8+ TILs. (G) Heatmaps compare arcsinh transformed z-score of the MSI of the indicated protein in the IRF2 high and low CD8+ TILs in mouse MC38 tumors (top) and human melanoma (bottom). Each row represents CD8+ T cells from a different tumor. The mouse MC38 data are representative of 3 independent experiments, each with at least 4 mice. * p<0.05, ** p<0.01, *** p< 0.0001. Unpaired, two-tailed Student’s t-test used to analyze significance of cluster proportions between IRF2 high and IRF2 low groups.
Figure 5:
Figure 5:. Transcriptional, epigenetic and gene-binding profiling.
(A) WT and Irf2−/−CD8+ TILs derived from scRNA-seq data and clustered using Seurat. Bar graph depicts the proportion of each cluster within their respective group. (B) Heatmap of top 20 up-regulated genes defining the clusters. (C) Heatmap of differentially expressed genes between WT cluster 0 (c0.WT) and Irf2−/− cluster 3 (c3.Irf2−/−). (D) GSEA plot showing enrichment of c0.WT and c3.Irf2−/− CD8+ T cells in gene signatures of effector vs exhausted CD8+ T cell pathway (from ImmuneSigDB). (E) 2D plots showing Gzmb, Ifng, Prf1 and Tox RNA expression by WT and Irf2−/−CD8+ TILs. (F) GSEA plot showing enrichment of c3.Irf2−/− CD8+ T cells in the gene signature of Tox-deficient CD8+ T cells, from (Khan et al., 2019). (G) scATAC-seq analysis indicating the number of accessible peaks in each region of WT and Irf2−/−CD8+ TILs. (H) Open chromatin state at IRF2-binding sites in the Tox promoter of WT (blue) and Irf2−/− (red) CD8+ TILs. Solid vertical line represents predicted IRF2 motif with a p<0.00005. (I) ATAC-seq plot indicating open chromatin state at IRF2-binding sites in the Tox promoter of CD8+ T cells isolated from peripheral blood lymphocytes obtained from (red peaks) three healthy donors; and (blue peaks) PD1hi CD8+ TILs from 2 melanoma patients (tumor 1 and 2) and 1 lung cancer patient (tumor 3). Solid vertical lines represent predicted IRF2 motifs with a p<0.00005. (J) Representative alignments of CUT&Tag peaks depicting IRF2 and IgG control antibody binding to the indicated loci of in vitro activated CD8+ T cells from the spleen and lymph nodes of WT mice. (K) Selective list of pathways (and their respective adjusted P value) based on the genes that interact with IRF2. The size of each dot indicates the number of genes in that pathway.
Figure 6.
Figure 6.. IRF2 re-routes transcriptional networks and programming.
(A) Bar graph depicts z-scores of IPA-predicted upstream regulator molecules from the DEG dataset comparing c3.Irf2−/− to c0.WT CD8+ TILs. Upstream regulators predicted to be most enriched (Activated) in c3.Irf2−/− CD8+ T cells are shown in red and those most activated in c0.WT in blue. (B) SCENIC-based fold changes in average regulon activity indicating whether a regulatory network is more active (red) or inhibited (blue) in c3.Irf2−/− vs c0.WT tumor infiltrating CD8+ T cells. (C) Enrichment map showing biological processes enriched in up-regulated genes in c0.WT (blue) and up-regulated genes in c3.Irf2−/− (red) CD8+ TILs.
Figure 7.
Figure 7.. IFN-I and IFN-II are required for long-term tumor control in Irf2−/− mice.
(A) IRF2 expression (gMFI) following media control and IFNβ stimulation of naïve WT mouse CD8+ T cells. *** p< 0.0001, paired Student’s t-test. (B) Expression of IFN-I and IFN-II signaling-associated molecules in WT and Irf2−/− CD8+ T cells from the spleen and tumor of mice on day 12 after MC38 initiation. Data are representative of two independent experiments, each with at least 5 mice per group pooled. (C) Graph shows IRF2 expression (gMFI) in dLNs of MC38 tumor-bearing WT mice following treatment beginning at day 9 with either isotype control, anti-IFNAR blocking, anti-IFNγ blocking, or dual (anti-IFNγ and IFNAR) blocking antibodies. Data are representative of two independent experiments, each with at least 5 mice per treatment condition. *** p< 0.0001, unpaired, two-tailed Student’s t-test. (D) Tumor growth kinetics of (left) MC38 tumor-bearing Irf2−/− mice treated with either isotype (red line), or a combination of anti-IFNγ and anti-IFNAR (blue line) antibodies. Antibody treatments were initiated at 22 days post tumor implantation, after WT mice had reached endpoint. (Right) Tumor growth kinetics of MC38 tumor-bearing Irf2−/− mice treated with either isotype (red), anti-IFNγ (blue) or anti-IFNAR (black) blocking antibodies. Antibody treatments were initiated at 23 days and after WT mice (purple) had reached endpoint. Shaded area indicates duration of antibody treatment. Data are representative of two independent experiments, each with at least 5 mice per treatment condition. (E) Tumor growth kinetics of MC38 tumor-bearing CD8-IRF2cKO mice treated with either isotype (red line) or a combination of anti-IFNγ and anti-IFNAR (blue line) antibodies, beginning at 19 days post tumor implantation, after CD8-IRF2cWT mice (black) had reached endpoint. Shaded area indicates duration of antibody treatment. Data are representative of three independent experiments. * p<0.05, ** p<0.01, *** p< 0.0001. One-way ANOVA for multiple comparisons used for tumor growth kinetics.

Comment in

Similar articles

Cited by

References

    1. Aibar S, Gonzalez-Blas CB, Moerman T, Huynh-Thu VA, Imrichova H, Hulselmans G, Rambow F, Marine JC, Geurts P, Aerts J, et al. (2017). SCENIC: single-cell regulatory network inference and clustering. Nat Methods 14, 1083–1086. - PMC - PubMed
    1. Alspach E, Lussier DM, and Schreiber RD (2019). Interferon gamma and Its Important Roles in Promoting and Inhibiting Spontaneous and Therapeutic Cancer Immunity. Cold Spring Harb Perspect Biol 11. - PMC - PubMed
    1. Amemiya HM, Kundaje A, and Boyle AP (2019). The ENCODE Blacklist: Identification of Problematic Regions of the Genome. Sci Rep 9, 9354. - PMC - PubMed
    1. Antonczyk A, Krist B, Sajek M, Michalska A, Piaszyk-Borychowska A, Plens-Galaska M, Wesoly J, and Bluyssen HAR (2019). Direct Inhibition of IRF-Dependent Transcriptional Regulatory Mechanisms Associated With Disease. Front Immunol 10, 1176. - PMC - PubMed
    1. Araki K, Morita M, Bederman AG, Konieczny BT, Kissick HT, Sonenberg N, and Ahmed R (2017). Translation is actively regulated during the differentiation of CD8(+) effector T cells. Nat Immunol 18, 1046–1057. - PMC - PubMed

Publication types