Clinical Trial
. 2022 Nov 12;20(1):526.
doi: 10.1186/s12967-022-03737-5.

DNA methylation predicts the outcome of COVID-19 patients with acute respiratory distress syndrome

Affiliations
Clinical Trial

DNA methylation predicts the outcome of COVID-19 patients with acute respiratory distress syndrome

Martina Bradic et al. J Transl Med. .

Abstract

Background: COVID-19 infections could be complicated by acute respiratory distress syndrome (ARDS), increasing mortality risk. We sought to assess the methylome of peripheral blood mononuclear cells in COVID-19 with ARDS.

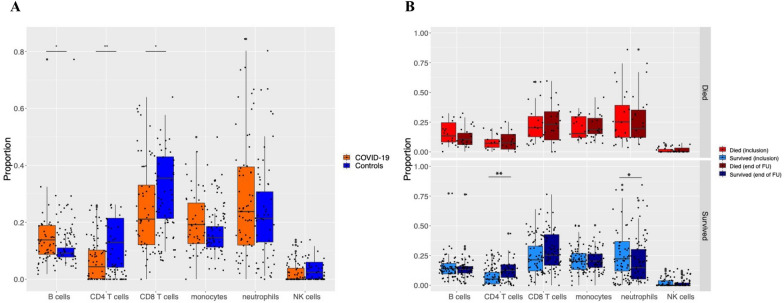
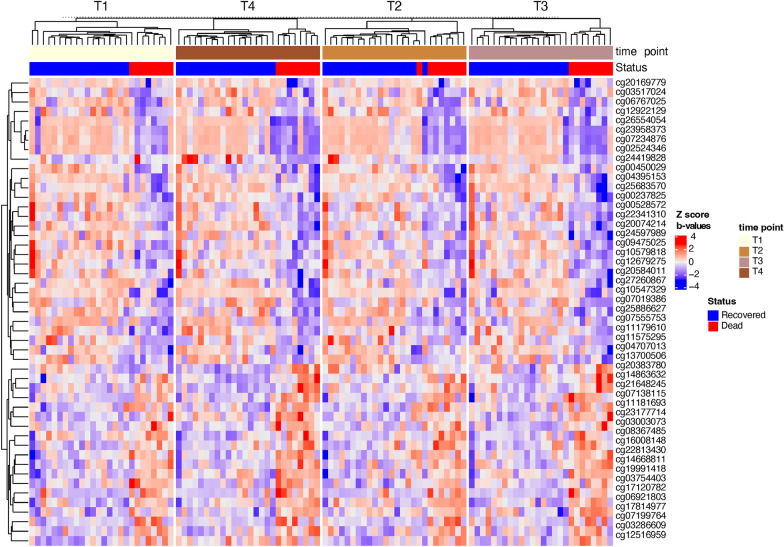
Methods: We recruited 100 COVID-19 patients with ARDS under mechanical ventilation and 33 non-COVID-19 controls between April and July 2020. COVID-19 patients were followed at four time points for 60 days. DNA methylation and immune cell populations were measured at each time point. A multivariate cox proportional risk regression analysis was conducted to identify predictive signatures according to survival.

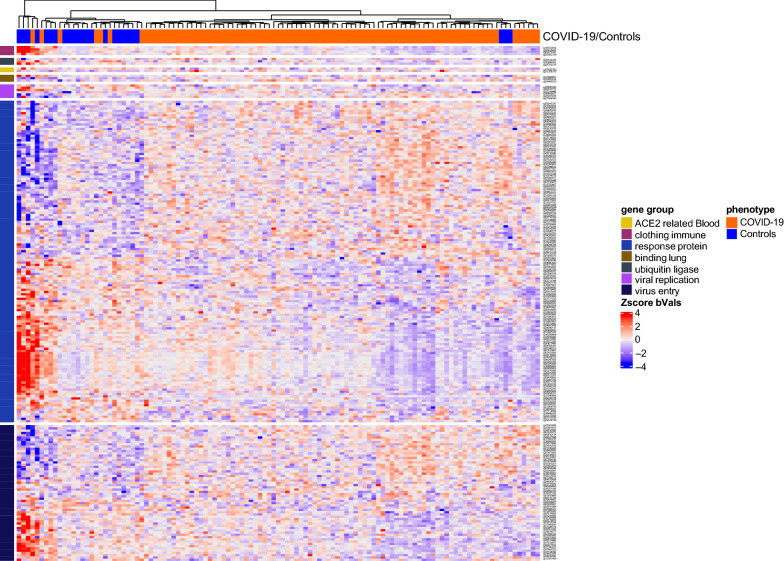
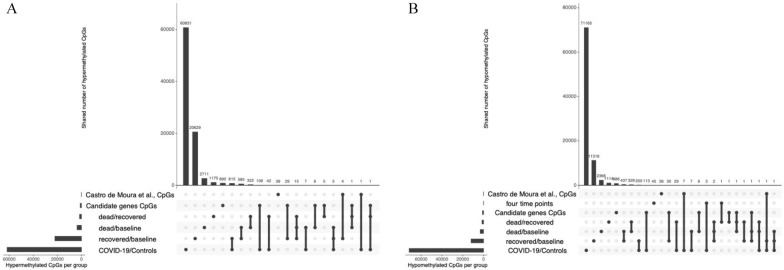
Results: The comparison of COVID-19 to controls at inclusion revealed the presence of a 14.4% difference in promoter-associated CpGs in genes that control immune-related pathways such as interferon-gamma and interferon-alpha responses. On day 60, 24% of patients died. The inter-comparison of baseline DNA methylation to the last recorded time point in both COVID-19 groups or the intra-comparison between inclusion and the end of follow-up in every group showed that most changes occurred as the disease progressed, mainly in the AIM gene, which is associated with an intensified immune response in those who recovered. The multivariate Cox proportional risk regression analysis showed that higher methylation of the "Apoptotic execution Pathway" genes (ROC1, ZNF789, and H1F0) at inclusion increases mortality risk by over twofold.

Conclusion: We observed an epigenetic signature of immune-related genes in COVID-19 patients with ARDS. Further, Hypermethylation of the apoptotic execution pathway genes predicts the outcome.

Trial registration: IMRPOVIE study, NCT04473131.

Keywords: ARDS; Biomarkers; COVID-19; DNA methylation; Epigenetics; Mortality; Survival.


Conflict of interest statement

The authors declare that they have no competing interests.

Figures

Fig. 1
Fig. 1
Flow chart of the study
Fig. 2
Fig. 2
A The proportion of immune cells detected in controls and COVID-19 participants. The X-axis represents different cell types. The Y-axis represents the proportion of cell types derived from the deconvolution methods. The orange color represents COVID-19-patients, while the blue color represents controls. B. The proportion of immune cells detected at baseline and the final time point. Baseline-recovered, Baseline-died, recovered, and died are four different categories by which samples were grouped and compared for immune cell proportion
Fig. 3
Fig. 3
Differentially methylated CpGs between COVID-19 patients and controls. Heatmap represents significant changes in CpGs from 36 out of 40 genes previously associated with COVID-19(13, 30–35). Heatmap represents methylation beta values (b-values) which were Z-score transformed (CD8 T, CD4 T, and B cell covariates were removed for visualization purposes.). Euclidean clustering distance and Ward.D2 clustering methods were used. Details on those genes and CpGs are shown in Additional file 2: Table S2C and D
Fig. 4
Fig. 4
UpSet plot to summarize replication of our results from previous studies. UpSet panels summarize the differentially methylated CpGs that overlap our analysis and published COVID-19 studies. The bottom left horizontal bar graph labeled CpGs per group shows each panel’s total number of differentially methylated CpGs per group. The dots in each panel’s matrix represent unique and overlapping differentially methylated CpGs. Connected dots designate a particular intersection between different groups of CpGs, either by intersecting with published studies or within our research. The top bar graph in each panel recapitulates the number of differentially methylated CpGs for each unique or overlapping combination. A. Hypermethylated CpGs, B. Hypomethylated CpGs
Fig. 5
Fig. 5
Differential methylation between dead and recovered COVID-19 patients. A. Volcano plot showing differences between COVID-19 recovered patients and their baseline. B. Volcano plot showing differences between COVID-19 dead patients and their baseline, C. Volcano plot showing differences between dead and recovered patients at their latest time point. Volcano plots in A, B, and C show differential CpGs methylation over 750874 CpG positions. The red line designates the genome-wide significance threshold of a Benjamini–Hochberg corrected p < 0.05. Green dots represent significantly different CpGs from the previously reported genes associated with COVID-19 [, –35]. Red dots represent hypermethylated CpGs; blue plots represent hypomethylated CpGs. Grey dots represent non-significant CpGs
Fig. 6
Fig. 6
Heatmap representing significant changes in CpGs from genes previously associated with COVID-19 [13]. Heatmap represents methylation beta values which were Z-score transformed (the euclidean clustering distance and Ward.D2 clustering methods were used). Details on these genes and CpGs are shown in Additional file 4: Table S4
Fig. 7
Fig. 7
Summary of immune cells and methylation changes over four time points in COVID-19 patients. A. Spline regression plot of neutrophile changes over four time points in dead (red color) vs. recovered patients (blue color). B. Spline regression plot of significant CpGs (cg00237825) over four time points in recovered vs. dead patients for DEFB115 C. Spline regression plot of significant CpGs (cg13700506) over four time points in recovered vs. dead patients for DEFB116. Spline plots show the spline regression model fitted to the four time points neutrophile proportion data (A) and methylation (B). The blue line represents the fitted model for the recovered, while the red line represents dead patients. Blue and red dots represent the proportion of neutrophils/methylation of the biological replicates for dead and recovered patients. Vertical lines are the endpoints and interior knots representing 0.33 and 0.66 quantiles
Fig. 8
Fig. 8
Heatmap representing significant changes in CpGs between patients who died and those who recovered over four time points. Heatmap represents methylation beta values which were Z-score transformed (the euclidean clustering distance and Ward.D2 clustering methods were used). Details on these CpGs are shown in Additional file 7: Table S7B
Fig. 9
Fig. 9
Kaplan–Meier and ROC analysis of genes that are top predictors of COVID-19 survival showing the three genes that increase mortality (A Kaplan–Meier plot represents the difference in survival probability between high and low methylation associated with CpG within a gene region. High and low methylation represents two groups determined based on the median of methylation Z-score as a cutoff. The X-axis represents time. The Y-axis represents survival probability. The tick marks indicate the censored patients. B ROC curves of the differentially methylated genes were used to demonstrate the sensitivity and specificity in predicting the survival of COVID-19 patients at inclusion. The X-axes show the false positive percentages, while the y-axes show the true positive percentages. P values on the plots represent the significance of logistic regression, where methylation was used as a dependent variable and survival (dead/alive) as an independent variable. The area under the curve (AUC) is shown for each gene showing how good the model is for hazard prediction
Fig. 10
Fig. 10
Kaplan–Meier and ROC analysis of genes that are top predictors of COVID-19 survival showing the five genes that decrease mortality) A Kaplan–Meier plot represents the difference in survival probability between high and low methylation associated with CpG within a gene region. High and low methylation represents two groups determined based on the median of methylation Z-score as a cutoff. The X-axis represents time. The Y-axis represents survival probability. The tick marks indicate the censored patients. B ROC curves of the differentially methylated genes were used to demonstrate the sensitivity and specificity in predicting the survival of COVID-19 patients at inclusion. The X-axes show the false positive percentages, while the y-axes show the true positive percentages. P values on the plots represent the significance of logistic regression, where methylation was used as a dependent variable and survival (dead/alive) as an independent variable. The area under the curve (AUC) is shown for each gene showing how good the model is for hazard prediction

References

    1. Zhu N, Zhang D, Wang W, Li X, Yang B, Song J, et al. A novel coronavirus from patients with pneumonia in China, 2019. N Engl J Med. 2020;382(8):727–733. - PMC - PubMed
    1. Lippi G, Mattiuzzi C, Henry BM. Updated picture of SARS-CoV-2 variants and mutations. Diagnosis (Berl) 2021;9(1):11–17. - PubMed
    1. Egger G, Liang G, Aparicio A, Jones PA. Epigenetics in human disease and prospects for epigenetic therapy. Nature. 2004;429(6990):457–463. - PubMed
    1. Anastasiadi D, Esteve-Codina A, Piferrer F. Consistent inverse correlation between DNA methylation of the first intron and gene expression across tissues and species. Epigenet Chromatin. 2018;11(1):37. - PMC - PubMed
    1. Izquierdo AG, Carreira MC, Boughanem H, Moreno-Navarrete JM, Nicoletti CF, Oliver P, et al. Adipose tissue and blood leukocytes ACE2 DNA methylation in obesity and after weight loss. Eur J Clin Invest. 2022;52(2):e13685. - PubMed

Publication types

Associated data