

Human umbilical cord mesenchymal stromal cell-derived exosomes protect against MCD-induced NASH in a mouse model
- PMID: 36371344
- PMCID: PMC9652856
- DOI: 10.1186/s13287-022-03201-7
Human umbilical cord mesenchymal stromal cell-derived exosomes protect against MCD-induced NASH in a mouse model
Abstract
Background and aims: Human umbilical cord mesenchymal stem cells (hUC-MSCs) are increasingly being studied in clinical trials of end-stage liver disease because of their good tissue repair and anti-inflammatory effects. hUC-MSC exosomes are vesicles with spherical structures secreted by cells that produce them. The diameter of exosomes is much smaller than that of hUC-MSCs, suggesting that exosomes might be a novel and safer therapeutic product of mesenchymal stem cells. As exosomes have been suggested to have biochemical functions similar to those of hUC-MSCs, this study investigated the efficiency of hUC-MSC-derived exosomes in protecting against nonalcoholic steatohepatitis using an MCD-induced mouse model.
Methods: Human umbilical cord mesenchymal stem cell-derived exosomes were extracted and purified. The effect of these exosomes on disease progression in an MCD-induced nonalcoholic steatohepatitis mouse model was investigated.
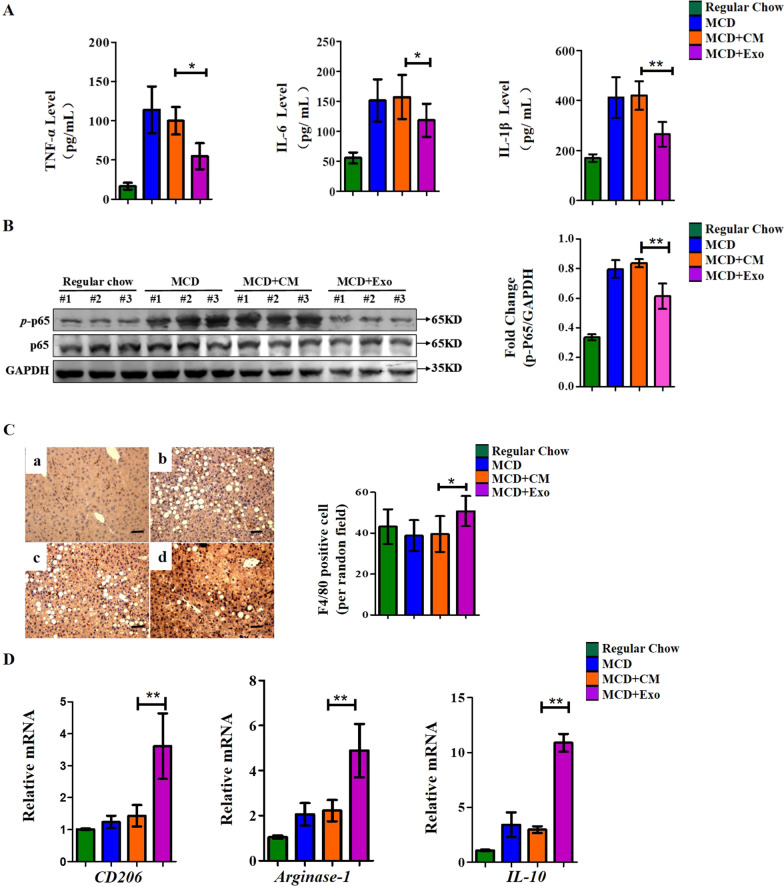
Results: The results showed that UC-MSC exosomes intravenously transplanted into mice with MCD-induced NASH improved MCD-induced body weight loss and liver damage in a mouse model. Additionally, the inflammatory cytokines in liver tissue were reduced, which may be caused by exosome-induced macrophage anti-inflammatory phenotypes both in vitro and in vivo. In addition, UC-MSC exosomes reversed PPARα level in ox-LDL-treated hepatocytes in vitro and in NASH mouse liver, which had been downregulated.
Conclusions: UC-MSC exosomes alleviate MCD-induced NASH in mice by regulating the anti-inflammatory phenotype of macrophages and by reversing PPARα protein expression in liver cells, which holds great potential in NASH therapy.
Keywords: MCD mouse model; Nonalcoholic steatohepatitis; PPARα; hUC-MSC exosomes.
© 2022. The Author(s).
Conflict of interest statement
There are no competing interests.
Figures


Similar articles
-
Exosomes derived from human umbilical cord mesenchymal stem cells ameliorate experimental non-alcoholic steatohepatitis via Nrf2/NQO-1 pathway.Free Radic Biol Med. 2022 Nov 1;192:25-36. doi: 10.1016/j.freeradbiomed.2022.08.037. Epub 2022 Sep 10. Free Radic Biol Med. 2022. PMID: 36096356
-
Mesenchymal Stem Cells-derived Exosomes Ameliorate Lupus by Inducing M2 Macrophage Polarization and Regulatory T Cell Expansion in MRL/lpr Mice.Immunol Invest. 2022 Aug;51(6):1785-1803. doi: 10.1080/08820139.2022.2055478. Epub 2022 Mar 25. Immunol Invest. 2022. PMID: 35332841
-
Huc-MSCs-derived exosomes alleviate non-alcoholic steatohepatitis by regulating macrophages polarization through miR-24-3p/STING axis.Stem Cell Res Ther. 2025 Feb 21;16(1):74. doi: 10.1186/s13287-025-04197-6. Stem Cell Res Ther. 2025. PMID: 39984996 Free PMC article.
-
The therapeutic potential of stem cell-derived exosomes in the ulcerative colitis and colorectal cancer.Stem Cell Res Ther. 2022 Apr 1;13(1):138. doi: 10.1186/s13287-022-02811-5. Stem Cell Res Ther. 2022. PMID: 35365226 Free PMC article. Review.
-
A systematic review of the anti-inflammatory and anti-fibrotic potential of human umbilical cord mesenchymal stem cells-derived exosomes in experimental models of liver regeneration.Mol Biol Rep. 2024 Sep 20;51(1):999. doi: 10.1007/s11033-024-09929-0. Mol Biol Rep. 2024. PMID: 39302506
Cited by
-
Extracellular vesicles: emerging therapeutic agents for liver fibrosis.Extracell Vesicles Circ Nucl Acids. 2025 May 7;6(2):216-244. doi: 10.20517/evcna.2025.08. eCollection 2025. Extracell Vesicles Circ Nucl Acids. 2025. PMID: 40852596 Free PMC article. Review.
-
Mesenchymal stem cells: A promising therapeutic avenue for non-alcoholic fatty liver disease.World J Stem Cells. 2024 Aug 26;16(8):780-783. doi: 10.4252/wjsc.v16.i8.780. World J Stem Cells. 2024. PMID: 39219724 Free PMC article.
-
Current Treatment Regimens and Promising Molecular Therapies for Chronic Hepatobiliary Diseases.Biomolecules. 2025 Jan 14;15(1):121. doi: 10.3390/biom15010121. Biomolecules. 2025. PMID: 39858515 Free PMC article. Review.
-
Emerging role of engineered exosomes in nonalcoholic fatty liver disease.World J Hepatol. 2023 Mar 27;15(3):386-392. doi: 10.4254/wjh.v15.i3.386. World J Hepatol. 2023. PMID: 37034232 Free PMC article. Review.
-
Advances in the treatment of liver injury based on mesenchymal stem cell-derived exosomes.Stem Cell Res Ther. 2024 Dec 18;15(1):474. doi: 10.1186/s13287-024-04087-3. Stem Cell Res Ther. 2024. PMID: 39696473 Free PMC article. Review.
References
-
- Samira R, Bahareh A, Seyed HM. Umbilical cord-derived mesenchymal stem cells in neurodegenerative disorders: from literature to clinical practice. Regen Med. 2020;15(4):1561–1578. - PubMed
-
- Xu W-X, He H-L, Pan S-W, Chen Y-L, Zhang M-L, Zhu S, et al. Combination treatments of plasma exchange and umbilical cord-derived mesenchymal stem cell transplantation for patients with hepatitis b virus-related acute-on-chronic liver failure: a clinical trial in China. Stem Cells Int. 2019;2019:4130757. - PMC - PubMed
-
- Gomes A, Coelho P, Soares R, Costa R. Human umbilical cord mesenchymal stem cells in type 2 diabetes mellitus: the emerging therapeutic approach. Cell Tissue Res. 2021;29:497–518. - PubMed
Publication types
MeSH terms
Substances
LinkOut - more resources
Full Text Sources
Medical
Research Materials
