. 2022 Nov 12;13(1):6889.
doi: 10.1038/s41467-022-34604-y.

A multivesicular body-like organelle mediates stimulus-regulated trafficking of olfactory ciliary transduction proteins

Affiliations

A multivesicular body-like organelle mediates stimulus-regulated trafficking of olfactory ciliary transduction proteins

Devendra Kumar Maurya et al. Nat Commun. .

Abstract

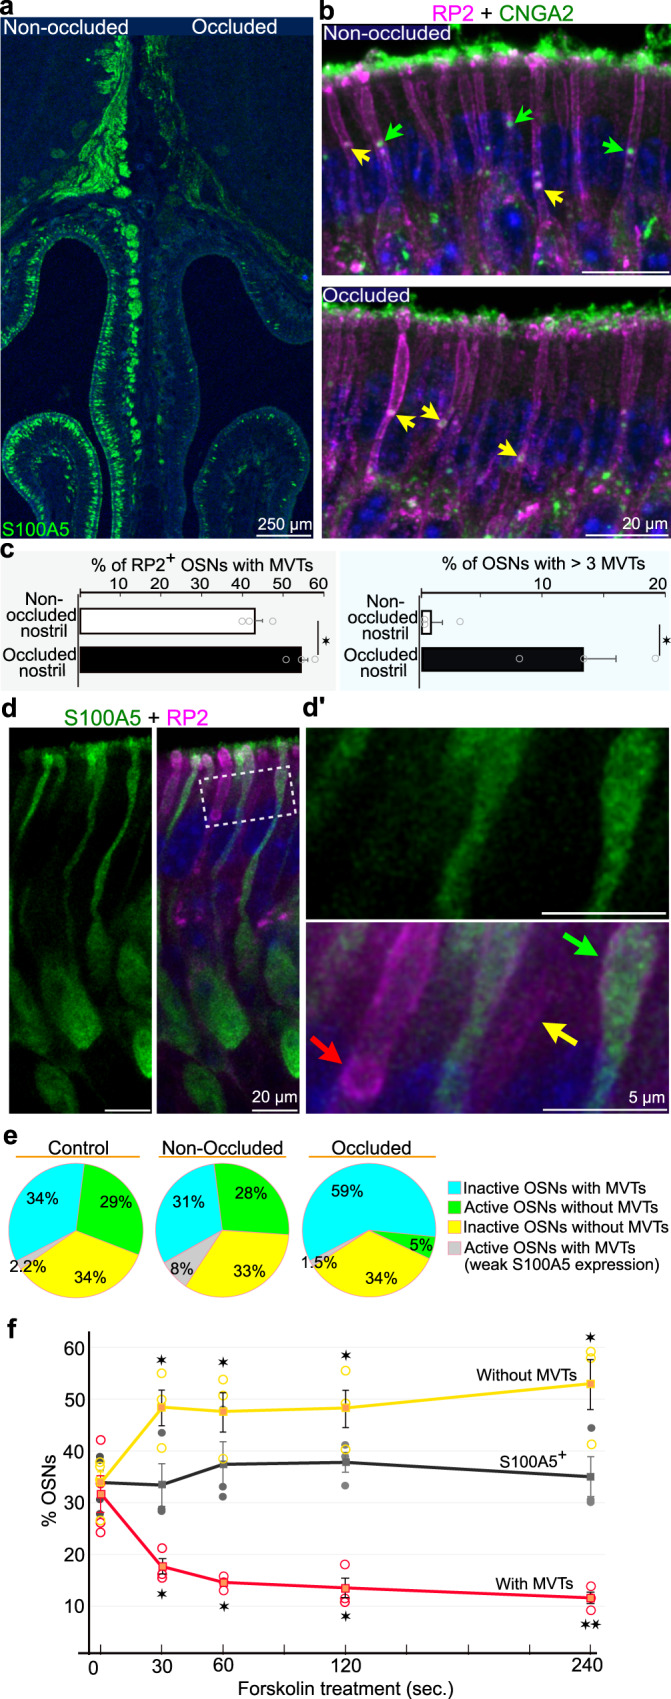
Stimulus transduction in cilia of olfactory sensory neurons is mediated by odorant receptors, Gαolf, adenylate cyclase-3, cyclic nucleotide-gated and chloride ion channels. Mechanisms regulating trafficking and localization of these proteins in the dendrite are unknown. By lectin/immunofluorescence staining and in vivo correlative light-electron microscopy (CLEM), we identify a retinitis pigmentosa-2 (RP2), ESCRT-0 and synaptophysin-containing multivesicular organelle that is not part of generic recycling/degradative/exosome pathways. The organelle's intraluminal vesicles contain the olfactory transduction proteins except for Golf subunits Gγ13 and Gβ1. Instead, Gβ1 colocalizes with RP2 on the organelle's outer membrane. The organelle accumulates in response to stimulus deprivation, while odor stimuli or adenylate cyclase activation cause outer membrane disintegration, release of intraluminal vesicles, and RP2/Gβ1 translocation to the base of olfactory cilia. Together, these findings reveal the existence of a dendritic organelle that mediates both stimulus-regulated storage of olfactory ciliary transduction proteins and membrane-delimited sorting important for G protein heterotrimerization.


Conflict of interest statement

The authors declare no competing interests.

Figures

Fig. 1
Fig. 1. Identification of MVB-like organelles containing several ciliary olfactory transduction proteins.
a Representative image showing AC3 immunofluorescence in a coronal OE section imaged by confocal microscopy. The OE cell layers are indicated in the margin. The soma, nucleus, axon, dendrite, knob and cilia of one OSN are outlined. AC3 immunofluorescence is present in cilia (arrowhead), the soma (asterisk) and dendritic puncta (arrows). b, c Images of triple (2 mice; 18 OSNs) and double immunohistochemistry (3 mice; 30 OSNs) showing colocalization of M71/72, AC3 and CNGA2 (b) as well as M71/72 and Gαolf (c) in three dendritic puncta (arrows). In some puncta located in the soma and close to the dendritic origin, the fluorescence did not overlap (arrowheads). d Results of double immunohistochemistry (2 mice; >30 OSNs) showing colocalization of Gβ1 and AC3 in dendritic puncta (arrow). Gβ1 but not AC3 was also present in the plasma membrane of the distal dendritic segment (arrowhead). e Images of double immunohistochemistry (2 mice; >25 OSNs) showing colocalization of CNGA2 and TMEM16B in dendritic puncta (arrow). fh Representative images (4 mice; 17 OSNs) showing AC3 immunofluorescence (f) and CLEM images (g) of ultrathin (75 nm) sections through an OSN dendrite. The outlined area in (f), which contains two immunofluorescent puncta, is enlarged in f´ and g´. h TEM images showing that the two AC3-positive puncta (h, ) corresponded to MVB-like organelles. One MVB-like organelle lacked ILVs in the center (h), whereas the other was densely packed with ILVs (h´). An enlarge overview of (g) is shown in supplementary fig. 2d.
Fig. 2
Fig. 2. Characterization of MVTs and analysis of lectin staining by CLEM.
a High-resolution TEM images showing the limiting membrane (LM) and ILV membranes with magenta and blue distance markers crossing the membranes in ultrathin section. b Boxplots showing the diameter, limiting membrane thickness and ILV membrane thickness as well as the number of ILVs per section of MVB-like organelles. Data is from 97 OSNs (N = 7 mice). Sample sizes were n = 137 (LM diameter), n = 144 (ILV diameter), n = 66 (LM membrane thickness), n = 443 (ILV membrane thickness) and n = 135 (ILV number per MVB section). The box in plots denotes the interquartile range (IQR) i.e. median (line within box) ± 25–75 percentiles. Whiskers show rest of the data distribution (±1.5 × IQR) and outliers are indicated by circles. Data is in source data file. Density of ILVs per MVB-like organelle section, falling within the IQR, is 112 ± 6 ILVs/µm2 (n = 70). Estimates of ILVs from four individual MVB-like organelles within this IQR, by analysis of 2-3 serial sections (representing about a third of the total volume), yielded the following numbers: 223, 175, 161 and 152 ILVs/MVB-like organelle. c, d Representative images of CNGA2 double immunohistochemical staining with DBA (c; 2 mice, 8 OSNs) and WFA (d; 2 mice, 16 OSNs) are shown. Both lectins colocalized with CNGA2 in dendrites (arrows). e AC3 immunohistochemical staining/WFA staining analysis showing that AC3 and WFA were colocalized in dendrites (arrow). f AC3+ and WFA+ dendritic vesicles, a CLEM image and a TEM image showing close ups of three vesicles (f´, f´´, f´´´) with MVB-like morphology are shown. e, f Representative images for 5 mice; >27 OSNs are shown. g AC3 immunohistochemical staining/DBA staining analysis showing that AC3 and DBA were colocalized in dendrites (arrow). A representative CLEM image and a TEM image showing a close up of an MVB-like body organelle with AC3 and DBA fluorescence (3 mice, 13 OSNs).
Fig. 3
Fig. 3. Each OSN contains a few MVTs in a defined dendritic region.
a Immunohistochemical analysis of ORs in individual OSNs are shown. Each OSN usually harbored 1-3 MVTs (arrows) localized to the proximal part of the dendrite. Above and below these puncta were many small and faintly stained M71/72+ puncta. The dotted line indicates the dendritic origin. b Boxplot showing the distance from M71/72+ puncta to the dendritic origin normalized to the percentage of the total length of the dendrite. The mean distance of MVTs distal to the dendritic origin shown in (a) (arrows) was 37% of the dendritic length. c, d Boxplot showing the fluorescent area (c) and intensity (d) of M71/72+ puncta at different distances from the dendritic origin. bd Boxplots are representing N = 5 mice; n = 166 OSNs. The box in plots denotes the IQR i.e. median (line within box) ± 25–75 percentiles. Whiskers show rest of the data distribution (±1.5 × IQR) and outliers are indicated by circles. The mean fluorescent area and intensity of the MVTs shown in (a) (arrows) were 1.41 µm2 and 87.32 (arbitrary units, a.u.), respectively.
Fig. 4
Fig. 4. The MVT is associated with RP2.
ac Representative double immunohistochemistry images (5 mice) showing colocalization of RP2/CNGA2 (a, b) and RP2/ M71/72 (c; 4 mice, >50 OSNs) in the limiting membrane of MVTs (arrows). CNGA2 and M71/72 fluorescent puncta partly overlapping with or lacking RP2 fluorescence are also shown (arrowheads). These puncta were located in the distal dendritic segment, in which RP2 fluorescence in the plasma membrane gradually increased (yellow lines in ac) toward the dendritic knob (d). e Representative (5 mice, >20 scans) immunohistochemical image showing RP2 fluorescence in MVTs (arrowheads), the plasma membrane and the dendritic knob. The dashed line shows the border between intense and less intense RP2 fluorescence in the distal and proximal dendritic segments, respectively. f, Results of CLEM analysis (4 mice, >20 OSNs) of a dendrite showing a cluster of ILVs* (i.e., AC3+ vesicles without a limiting membrane). A close up of area outlined in f´ is shown in f´´. g, h Double immunohistochemistry showing colocalization of CNGA2/RP2 (g) and M71/72/RP2 (h) in the soma (arrows). The white and green arrowheads indicate CNGA2+/RP2- and CNGA2-/RP2+ puncta, respectively. Shown are representative images (5 mice, >50 OSNs).
Fig. 5
Fig. 5. The MVT is associated with ESCRT-0 but not downstream ESCRT complexes.
a, b Double immunohistochemistry showing M71/72+ puncta colocalized with the ESCRT-0 proteins HGS (5 mice, >60 OSNs) (a) and STAM1 (3 mice, >40 OSNs) (b) (arrows) in dendrites and the soma. The soma also contained M71/72+/HGS-, and M71/72+/STAM1- puncta (green arrowheads) as well as M71/72-/HGS+, and M71/72-/STAM1+ puncta (red arrowheads). c, d Enhanced exposure of M71/72/HGS (c) and M71/72/STAM1 (d) immunohistochemical signals showing MVTs with ESCRT-0 fluorescence (arrows) and MVTs lacking colocalization of M71/72/ESCRT-0 in the dendritic knob, plasma membrane and ILVs* in the distal dendritic segment (arrowheads). eh Double immunohistochemistry showing that ESCRT-I (TSG101) (e), ESCRT-III (CHMP1A, CHMP4B) (f, g), and ESCRT-IV (VPS4) (h) did not colocalize with MVTs (arrows). However, M71/72/ESCRT-III colocalization was evident in the soma (yellow arrows in f and g). The soma also contained M71/72+/ESCRT-III- and M71/72+/ESCRT-IV- puncta (green arrowheads) as well as M71/72-/ESCRT-III+ and M71/72-/ESCRT-IV+ puncta (red arrowheads) (fh). eh Shown are representative images (3 mice, >15 OSNs).
Fig. 6
Fig. 6. Gβ1/RP2 colocalization and MVT-independent Gγ13 trafficking.
a Double immunohistochemistry showing Gβ1/RP2 colocalization in the limiting membrane (arrow), plasma membrane (arrowhead) and dendritic knob (asterisk). b Line scans of the plasma and limiting membranes showing a high degree of overlap between Gβ1 (green) and RP2 (magenta) immunofluorescence in areas of the dendrite that are indicated in (a) (#1–5). c Double CNGA2 (green)/Gγ13 (magenta) immunohistochemistry showing that Gγ13 and CNGA2 were colocalized in cilia (arrowhead) but not in the soma or dendrites (arrows). Representative images are shown (2 mice, >30 OSNs).
Fig. 7
Fig. 7. Disintegration of the RP2+-limiting membrane is inhibited by naris occlusion and stimulated by the AC3 activator forskolin.
a S100A5 immunohistochemistry in OSN cell bodies and axons after unilateral naris occlusion is shown. The expression level of S100A5 (green) was reduced in OSNs located ipsilateral to the occluded naris (occluded) compared to OSNs located contralateral to the occluded naris (non-occluded). b, Double immunohistochemistry for RP2 (magenta) and CNGA2 (green) in OSNs in the OE of the non-occluded and occluded naris. MVTs (RP2+/CNGA2+ puncta) and ILVs* (RP2-/CNGA2+ puncta) are indicated by yellow and green arrows, respectively. c, The bar graphs show the percentage of OSNs with MVTs and the percentage of OSNs with > 3 MVTs in OE on the non-occluded and occluded side. Sample sizes were 509 and 539 OSNs for non-occluded and occluded nasal cavity, respectively. Two-sided unpaired Student’s t-test gave p = 0.020 (left) and p = 0.020 (right) (n = 3 mice per condition). The values represent the mean ± SEM. d Double immunohistochemistry for RP2 (magenta) and S100A5 (green). d´ Close-up of the area outlined in d. the red and yellow arrows indicate inactive (S100A5) OSNs with and without an MVT, respectively. The green arrow indicates an active (S100A5+) OSN without an MVT. e Pie graphs showing the percentages of active/inactive OSNs with/without MVTs in OE of control (unoperated) mice and on the non-occluded and occluded side of unilateral naris occluded mice. Sample sizes were 630, 338 and 441 OSNs for control, non-occluded and occluded nasal cavities, respectively (3 mice per condition). f Graph showing the change in the number of inactive (S100A5-) OSNs with (red curve) and without (yellow curve) MVTs seconds after administration of forskolin to the OE ex vivo. The black curve indicates the number of S100A5+ OSNs. Sample sizes at 0, 30, 60, 120 and 240 s were; 1289 OSNs (4 mice), 957 OSNs (3 mice), 1095 OSNs (3 mice), 1164 OSNs (3 mice) and 1315 OSNs (3 mice), respectively. The values represent the mean ± SEM. Two-sided unpaired Student’s t-test of data for 0 s compared to each of the time point indicated in the plot (not adjusted for multiple comparisons), gave the following p values from left to right: 0.026, 0.039, 0.029, 0.021 (curve in yellow) and 0.039, 0.017, 0.017, 0.009 (curve in red). *p < 0.05, **p < 0.01.
Fig. 8
Fig. 8. Odorant-evoked disintegration of the RP2+-limiting membrane.
a Double RP2 (magenta)/M71/72 (green) immunohistochemistry in OE obtained after exposure of awake and freely behaving mice to DMSO or acetophenone/DMSO for 5 min. a1a2 Close-up of areas outlined in (a). An intact MVT, i.e. RP2 and M71/72 colocalization, is shown in (a), a1 (arrow). Two M71/72+ puncta that do not colocalize with RP2 are shown in (a), a2 (arrowheads). b Line graph showing the time course of percentage decrease and increase of M71/72 OSNs with and without MVTs after acetophenone exposure. For each time point 0, 60, 180 and 600 s sample sizes were 420, 393, 421 and 381, respectively, from 3 mice in each group. The values represent mean ± SEM. Two-sided unpaired Student’s t-test of data for 0 s compared to each of the time points indicated in the plot (not adjusted for multiple comparisons), gave the following p values from left to right: 0.016, 0.018, 0.013 and 0.00068 for both curves. *p < 0.05, **p < 0.01.

References

    1. Roizin L, Nishikawa K, Koizumi J, Keoseian S. The fine structure of the multivesicular body and their relationship to the ultracellular constituents of the central nervous system. J. Neuropathol. Exp. Neurol. 1967;26:223–249. - PubMed
    1. Von Bartheld CS, Altick AL. Multivesicular bodies in neurons: distribution, protein content, and trafficking functions. Prog. Neurobiol. 2011;93:313–340. - PMC - PubMed
    1. Hanson PI, Cashikar A. Multivesicular body morphogenesis. Annu Rev. Cell Dev. Biol. 2012;28:337–362. - PubMed
    1. Reggiori F, Pelham HR. Sorting of proteins into multivesicular bodies: ubiquitin-dependent and -independent targeting. EMBO J. 2001;20:5176–5186. - PMC - PubMed
    1. Katzmann DJ, Odorizzi G, Emr SD. Receptor downregulation and multivesicular-body sorting. Nat. Rev. Mol. Cell Biol. 2002;3:893–905. - PubMed

Publication types

MeSH terms

Supplementary concepts