. 2022 Nov 12;13(1):6881.
doi: 10.1038/s41467-022-34660-4.

IL-33 induces thymic involution-associated naive T cell aging and impairs host control of severe infection

Affiliations

IL-33 induces thymic involution-associated naive T cell aging and impairs host control of severe infection

Lei Xu et al. Nat Commun. .

Abstract

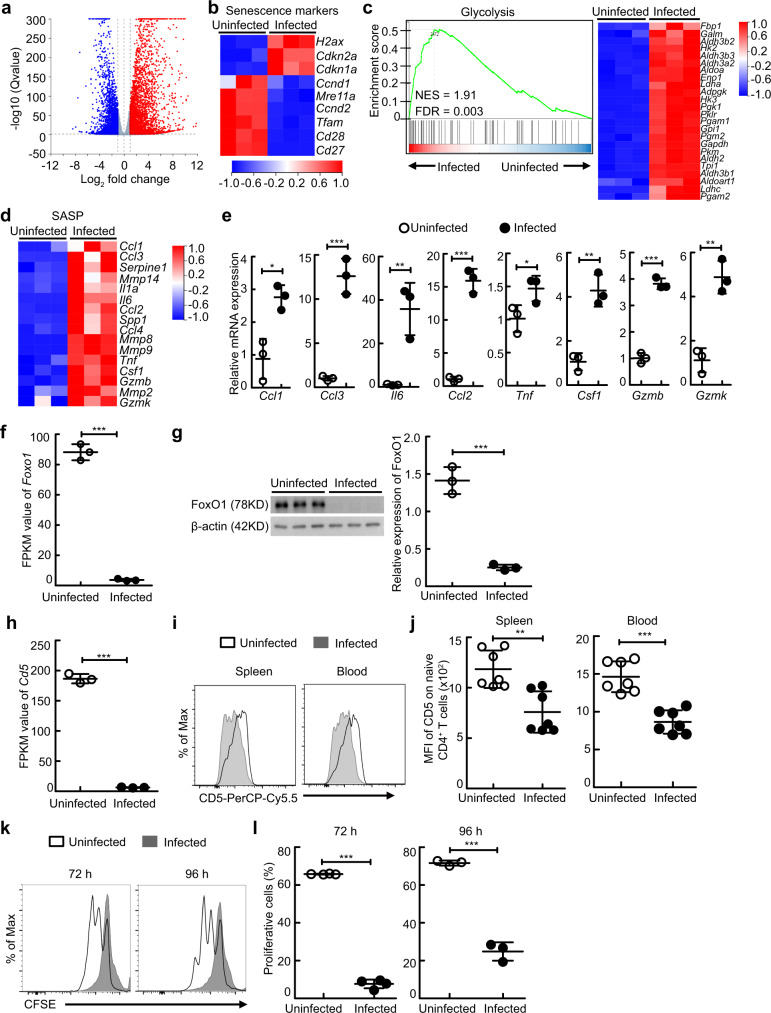
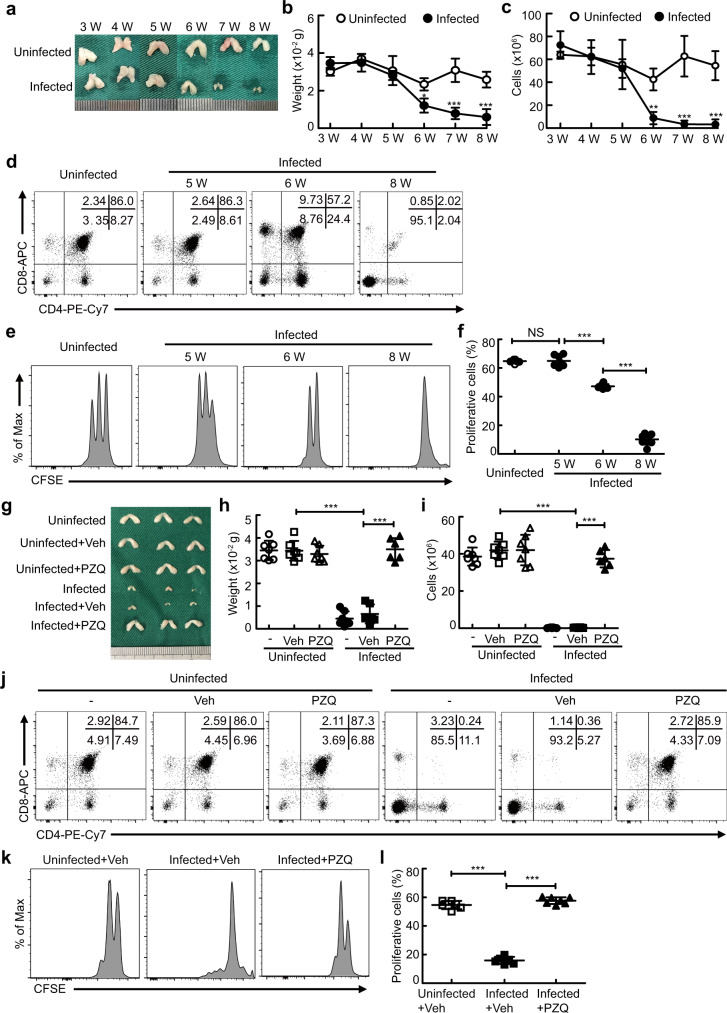
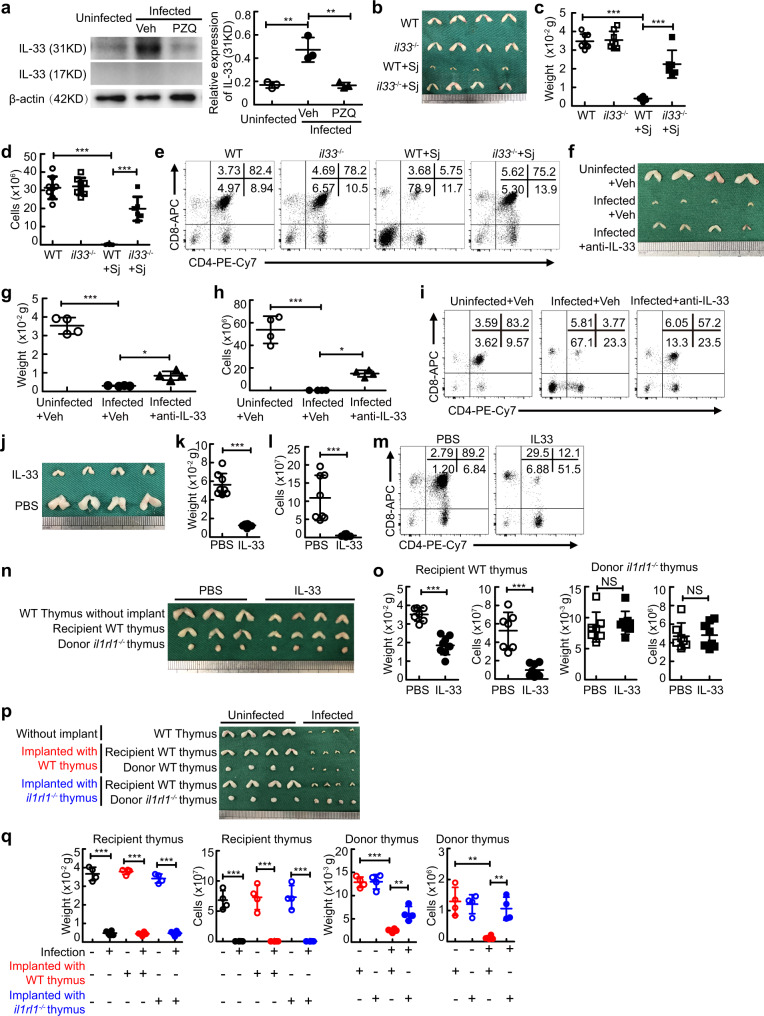
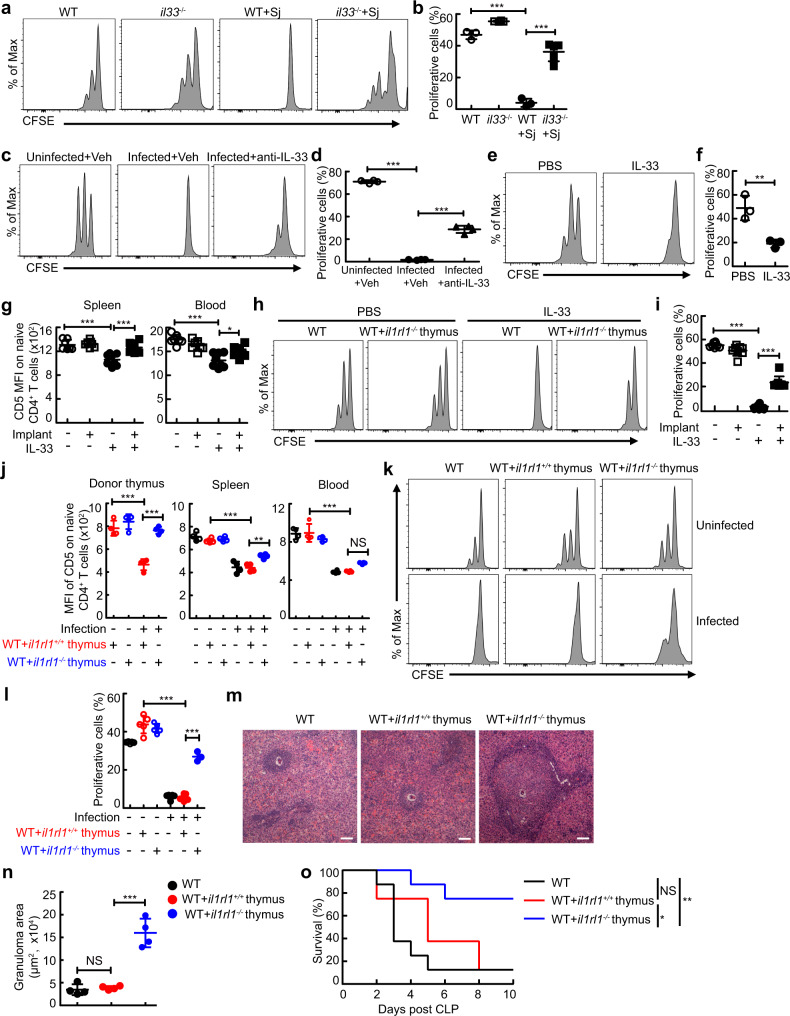
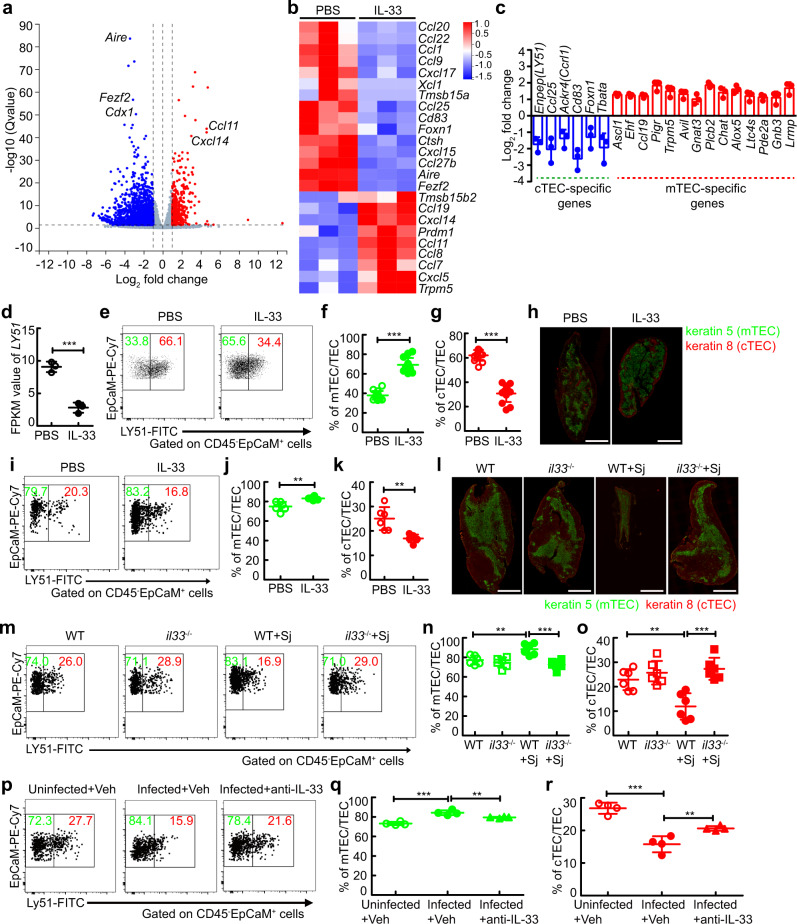
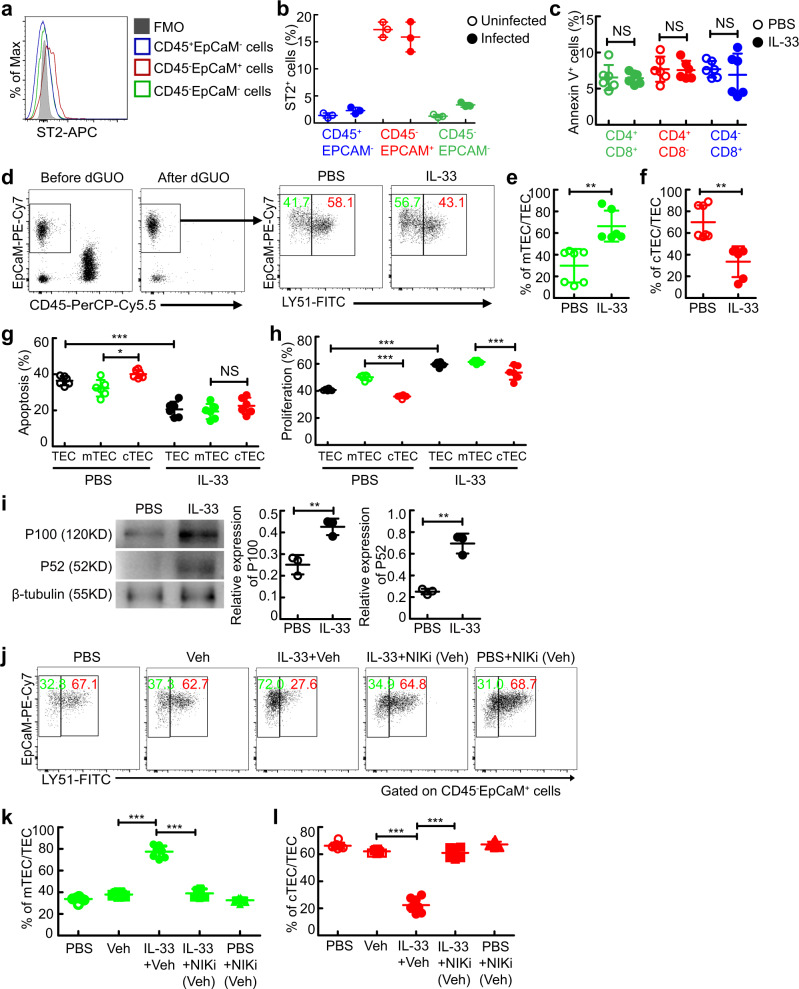
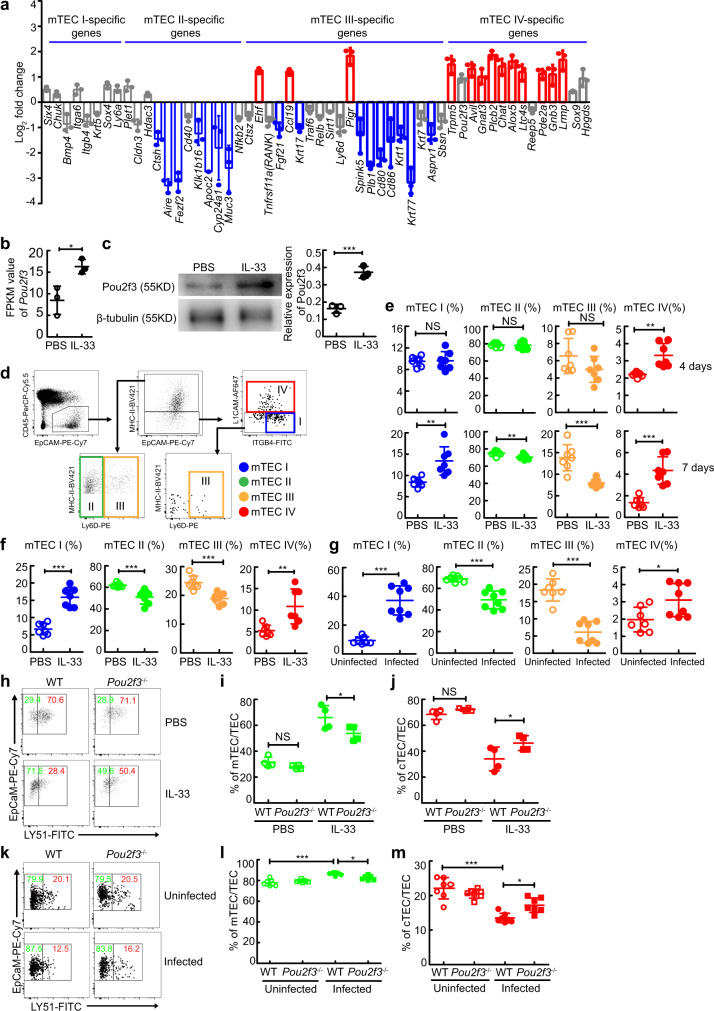
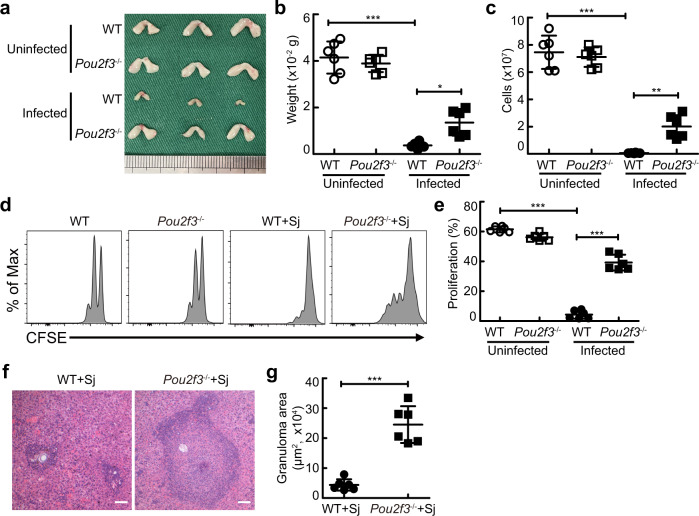
Severe infection commonly results in immunosuppression, which leads to impaired pathogen clearance or increased secondary infection in both humans and animals. However, the exact mechanisms remain poorly understood. Here, we demonstrate that IL-33 results in immunosuppression by inducing thymic involution-associated naive T cell dysfunction with aberrant expression of aging-associated genes and impairs host control of infection in mouse disease models of schistosomiasis or sepsis. Furthermore, we illustrate that IL-33 triggers the excessive generation of medullary thymic epithelial cell (mTEC) IV (thymic tuft cells) in a Pou2f3-dependent manner, as a consequence, disturbs mTEC/cortical TEC (cTEC) compartment and causes thymic involution during severe infection. More importantly, IL-33 deficiency, the anti-IL-33 neutralizing antibody treatment, or IL-33 receptor ST2 deficient thymus transplantation rescues T cell immunity to better control infection in mice. Our findings not only uncover a link between severe infection-induced IL-33 and thymic involution-mediated naive T cell aging, but also suggest that targeting IL-33 or ST2 is a promising strategy to rejuvenate T cell immunity to better control severe infection.


Conflict of interest statement

The authors declare no competing interests.

Figures

Fig. 1
Fig. 1. Schistosome infection induces T cell aging in mice.
ad, f, j Naive CD4+ T cells were sorted from uninfected or schistosome-infected mice (n = 3 mice) to perform RNA-seq analysis. a Volcano plot shows genes differentially expressed in naive CD4+ T cells. b Heat map shows the genes of senescence markers. c Gene set enrichment analysis (GSEA) of glycolysis pathway-associated genes in naive CD4+ T cells (left) and heat map of selected genes (right). d Heat map shows the genes of senescence-associated secretory phenotype (SASP). e Ccl1, Ccl3, Il6, Ccl2, Tnf, Csf1, Gzmb, and Gzmk gene expressions of naive CD4+ T cells were determined by RT-PCR (n = 3 mice). Ccl1, P = 0.0104; Ccl3, P = 0.0006; Il6, P = 0.0075; Ccl2, P = 0.0002; Tnf, P = 0.0481; Csf1, P = 0.0025; Gzmb, P < 0.0001; Gzmk, P = 0.0021. f FPKM value of Foxo1 gene of naive CD4+ T cells (n = 3 mice); P < 0.0001. g Representative and quantified western blots of FoxO1 in naive CD4+ T cells (n = 3 mice); P < 0.0001. h FPKM value of Cd5 gene of naive CD4+ T cells (n = 3 mice); P < 0.0001. il Cells were from uninfected mice or mice 8 weeks after schistosome infection. i, j Representative and quantified flow cytometry of the mean fluorescence intensity (MFI) of CD5 on naive CD4+ T cells from the spleen or peripheral blood (n = 7 mice, pool of two independent experiments); Spleen, P = 0.0016; Blood, P < 0.0001. k, l Representative and quantified flow cytometry of the CFSE MFI of CFSE-labeled naive CD4+ T cells from spleen stimulated with anti-CD3 and anti-CD28 antibodies for 72 or 96 h (n = 4 mice for 72 h; n = 3 mice for 96 h); 72 h or 96 h, P < 0.0001. All data are shown as the mean ± s.d. *P < 0.05, **P < 0.01, ***P < 0.001, Unpaired two-tailed Student’s t-test. Source data are provided as a Source Data file.
Fig. 2
Fig. 2. Schistosome infection-induced thymic involution links to T cell aging in mice.
ac Representative morphology and quantified weight and cellularity of thymus from uninfected mice or mice 3, 4, 5, 6, 7, or 8 weeks after infection (n = 4 mice). 6 W, P = 0.0265 (weight) or 0.0091 (cells); 7 W, P < 0.0001 (weight) or <0.0001 (cells); 8 W, P < 0.0001 (weight) or <0.0001 (cells); Two-way ANOVA with Tukey’s multiple comparisons. d Representative flow cytometry of thymocytes. e, f Representative and quantified flow cytometry of the CFSE MFI of naive CD4+ T cells stimulated with anti-CD3 and anti-CD28 antibodies (5 W, n = 7 mice; other groups, n = 8 mice; pool of two independent experiments). 5 W versus uninfected, P = 0.9995; 6 W versus 5 W, P < 0.0001; 8 W versus 6 W, P < 0.0001; One-way ANOVA with Tukey’s multiple comparisons. gl Mice were treated with PZQ at week 8 after infection and sacrificed 7 weeks after PZQ treatment. gi Representative morphology and quantified weight and cellularity of thymus (Infected+Veh or PZQ, n = 6 mice; Uninfected, Uninfected+Veh, Uninfected+PZQ, or Infected, n = 7 mice; pool of two independent experiments). Infected+Veh versus uninfected+Veh, P < 0.0001 (weight), P < 0.0001 (cells); Infected+PZQ versus Infected+Veh, P < 0.0001 (weight), P < 0.0001 (cells); One-way ANOVA with Tukey’s multiple comparisons. j Representative flow cytometry of thymocytes. k, l Representative and quantified flow cytometry of the CFSE MFI of CFSE-labeled naive CD4+ T cells stimulated with anti-CD3 and anti-CD28 antibodies (Uninfected+Veh or Infected+Veh, n = 6 mice; Infected+PZQ, n = 7 mice; pool of two independent experiments). Infected+Veh versus uninfected+Veh, P < 0.0001; Infected+PZQ versus Infected+Veh, P < 0.0001; One-way ANOVA with Tukey’s multiple comparisons. All data are shown as the mean ± s.d; *P < 0.05, **P < 0.01, ***P < 0.001, NS, not significant. Source data are provided as a Source Data file.
Fig. 3
Fig. 3. IL-33 causes thymic involution during schistosome infection.
a Representative and quantified western blots of IL-33 (n = 3 mice). Infected+Veh versus uninfected or Infected+PZQ, P = 0.0029 or P = 0.0027. bd Representative morphology and quantified weight and cellularity of the thymus (il33−/−+Sj, n = 6 mice; other groups, n = 8 mice; pool of two independent experiments), P < 0.0001. e Representative flow cytometry of thymocytes. fi Mice were treated with anti-IL-33 at week 3 every other day until week 8 after infection. fh Representative morphology and quantified weight and cellularity of thymus (n = 4 mice). Infected+Veh versus Uninfected+Veh or Infected+anti-IL-33, P < 0.0001 (weight or cells) or P = 0.0461 (weight), P = 0.0411 (cells). i Representative flow cytometry of thymocytes. jm Mice were injected with IL-33 for six consecutive days. jl Representative morphology and quantified weight and cellularity of the thymus (n = 8 mice, pool of two independent experiments). P < 0.0001 (weight), P = 0.0003 (cells). m Representative flow cytometry of thymocytes. n, o Representative morphology (n) and quantified weight and cellularity (o) of thymus (PBS, n = 7 mice; IL-33, n = 8 mice; pool of two independent experiments). Recipient WT thymus, P < 0.0001 (weight or cells); Donor il1rl1−/− thymus, P = 0.5391 (weight), P = 0.8775 (cells). p, q Representative morphology (p) and quantified weight and cellularity (q) of thymus (n = 4 mice). Infected versus Uninfected, P < 0.0001 (weight or cells) for recipient thymus; Infected+WT thymus versus Uninfected+ WT thymus, P < 0.0001 (weight or cells) for recipient thymus, P < 0.0001 (weight) or P = 0.0016 (cells) for donor thymus; Infected+il1rl1−/− thymus versus Uninfected+il1rl1−/− thymus, P < 0.0001 (weight or cells) for recipient thymus, P = 0.0071 (weight) or P = 0.0085 (cells) for donor thymus. All data are shown as the mean ± s.d; *P < 0.05, **P < 0.01, ***P < 0.001, NS, not significant. a, c, d, g, h, q One-way ANOVA with Tukey’s multiple comparisons; k, l, o Unpaired two-tailed Student’s t-test. Source data are provided as a Source Data file.
Fig. 4
Fig. 4. Loss of IL-33-mediated thymic involution rescues effective T-cell immunity to control severe infection.
a, b CFSE MFI of naive CD4+ T cells from schistosome-infected mice (WT or WT + Sj, n = 3 mice; il33−/−, n = 4 mice; il33−/−+Sj, n = 5 mice), P < 0.0001. c, d CFSE MFI of naive CD4+ T cells from schistosome-infected mice treated with anti-IL-33 (n = 4 mice), P < 0.0001. e, f CFSE MFI of naive CD4+ T cells from mice treated with IL-33 (n = 3 mice). P = 0.0008, Unpaired two-tailed Student’s t-test. go Mice were transplanted with il1rl1+/+ or il1rl1−/− thymus. g CD5 MFI on naive CD4+ T (il1rl1−/−thymus+PBS, n = 7 mice; other groups, n = 8 mice; pool of two independent experiments). IL-33 versus PBS, P < 0.0001 (Spleen or Blood); il1rl1−/−thymus+IL-33 versus IL-33, P = 0.0003 (Spleen), P = 0.0205 (Blood). h, i CFSE MFI of naive CD4+ T cells (n = 8 mice, pool of two independent experiments), P < 0.0001. j CD5 MFI on naive CD4+ T (n = 4 mice). WT thymus+Infected versus WT thymus+Uninfected, P < 0.0001 (Donor thymus, Spleen, or Blood); il1rl1−/−thymus+Infected versus WT thymus+Infected, P < 0.0001 (Donor thymus), P = 0.0035 (Spleen), P = 0.0899 (Blood). k, l CFSE MFI of naive CD4+ T cells (il1rl1−/−thymus+Infected, n = 3 mice; other groups, n = 5 mice), P < 0.0001. m Representative image of histology of liver, Scale bar, 100 μm. n The areas of granulomas around a single egg (n = 4 mice). il1rl1+/+ thymus+Infected versus Infected or il1rl1−/− thymus+Infected, P = 0.9535 or P < 0.0001. o Survival curves of CLP-operated mice (n = 8 mice). WT + il1rl1+/+ thymus versus WT or WT + il1rl1−/− thymus, p = 0.3181 or P = 0.0205; WT + il1rl1−/− thymus versus WT, P = 0.0038; Log-rank (Mantel-Cox) test. All data are shown as the mean ± s.d. *P < 0.05, **P < 0.01, ***P < 0.001, NS, not significant. b, d, g, i, j, l, n One-way ANOVA with Tukey’s multiple comparisons. Source data are provided as a Source Data file.
Fig. 5
Fig. 5. IL-33 perturbs the function and compartment of thymic epithelial cells.
ad TECs from thymus cultured in FTOC treated with IL-33 (n = 3 biologically independent samples of fetal thymic lobes) to perform RNA-seq analysis. a Volcano plot shows genes differentially expressed in TECs. b Heat map shows TEC function-associated genes. c cTEC or mTEC-specific genes. d FPKM value of Enpep gene (encoding LY51) of TECs (n = 3 biologically independent samples of fetal thymic lobes), P = 0.0006. eg Representative and quantified flow cytometry of mTECs and cTECs from thymus cultured in FTOC treated with IL-33 (n = 13 biologically independent samples of fetal thymic lobes, pool of three independent experiments), P < 0.0001 (mTEC or cTEC). h Histology of the thymus from mice treated with IL-33 or PBS; Green, Keratin 5; Red, Keratin 8; Scale bar, 1000 μm. ik Representative and quantified flow cytometry of cTECs or mTECs in the thymus from mice treated with IL-33 (n = 6 mice, pool of two independent experiments), P = 0.0025 (mTEC), P = 0.0025 (cTEC). l Histology of the thymus from WT or il33−/− mice 8 weeks after infection; Green, Keratin 5; red, Keratin 8; Scale bar, 1000 μm. mo Representative and quantified flow cytometry of cTECs or mTECs in the thymus from WT or il33−/− mice 8 weeks after infection (n = 6 mice, pool of two independent experiments). WT + Sj versus WT, P = 0.0057 (mTEC), P = 0.0038 (cTEC); WT + Sj versus il33−/−+Sj, P = 0.0002 (mTEC), P = 0.0001 (cTEC). pr Representative and quantified flow cytometry of cTECs or mTECs in the thymus from schistosome-infected mice treated with anti-IL-33 (n = 4 mice). Infected+Veh versus Uninfected+Veh, P < 0.0001 (mTEC), P < 0.0001 (cTEC); Infected+Veh versus Infected+anti-IL-33, P = 0.0099 (mTEC), P = 0.0099 (cTEC). All data are shown as the mean ± s.d. *P < 0.05, **P < 0.01, ***P < 0.001, NS, not significant. d, f, g, j, k Unpaired two-tailed Student’s t-test; n, o, q, r One-way ANOVA with Tukey’s multiple comparisons. Source data are provided as a Source Data file.
Fig. 6
Fig. 6. IL-33 leads to aberrant accumulation of mTECs independently of thymocytes.
a, b Representative and quantified flow cytometry of ST2+ cells gated on CD45+EpCaM-, CD45-EpCaM+, or CD45-EpCaM- cells in the thymus (n = 3 mice). c Quantification of flow cytometry of annexin V+ cells from the purified thymocytes treated with IL-33 for 3 days (n = 6 mice, pool of two independent experiments). P = 0.9057 (CD4+CD8+), P = 0.8832 (CD4+CD8-), P = 0.5614 (CD4-CD8+). df Representative and quantified flow cytometry of cTECs or mTECs from the thymus in dGUO-treated FTOCs treated with IL-33 (PBS or IL-33, n = 7 or 6 biologically independent samples of fetal thymic lobes, pool of two independent experiments). P = 0.0011 (mTEC), P = 0.0011 (cTEC). g, h Quantification of flow cytometry of annexin V+ cells or Ki67+ cells, gated on TEC, cTEC, or mTEC from the thymus cultured in FTOC treated with IL-33 (n = 6 biologically independent samples of fetal thymic lobes, pool of two independent experiments). IL-33+TEC versus PBS + TEC, P < 0.0001 (Apoptosis), P < 0.0001 (Proliferation); PBS + mTEC versus PBS + cTEC, P = 0.0156 (Apoptosis), P < 0.0001 (Proliferation); IL-33+mTEC versus IL-33+cTEC, P = 0.7150 (Apoptosis), P = 0.0001 (Proliferation). i Representative and quantified western blots of P100/P52 in TECs from the thymus cultured in FTOCs treated with IL-33 (n = 3 biologically independent samples of fetal thymic lobes). P = 0.0067 (P100), P = 0.0013 (P52). jl Representative and quantified flow cytometry of mTECs or cTECs from the thymus in FTOCs treated with IL-33 and/or NIK inhibitor (NIKi; n = 8 biologically independent samples of fetal thymic lobes, pool of two independent experiments). IL-33+Veh versus Veh, P < 0.0001 (mTEC or cTEC); IL-33+Veh versus IL-33+NIKi (Veh), P < 0.0001 (mTEC or cTEC). c, e, f, i Unpaired two-tailed Student’s t-test; g, h, k, l One-way ANOVA with Tukey’s multiple comparisons. All data are shown as the mean ± s.d; *P < 0.05, **P < 0.01, ***P < 0.001, NS, not significant. Source data are provided as a Source Data file.
Fig. 7
Fig. 7. IL-33 promotes the excessive generation of thymic tuft cells and acute thymic involution in a Pou2f3-dependent manner.
a RNA-seq analysis of mTEC subset-specific genes in TECs in FTOCs treated with IL-33. b FPKM values of Pou2f3 genes (n = 3 biologically independent samples of fetal thymic lobes), P = 0.0212. c Representative and quantified western blots of Pou2f3 in TECs in FTOCs treated with IL-33 for 4 days (n = 3 biologically independent samples of fetal thymic lobes), P = 0.001. d Gating strategy of mTEC subsets. e mTEC subset percentages in FTOCs treated with IL-33 for 4 days or 7 days (n = 7 biologically independent samples of fetal thymic lobes, pool of two independent experiments). 4 days or 7 days, P = 0.886 or 0.0027 (mTEC I), P = 0.7789 or 0.0094 (mTEC II), P = 0.1266 or 0.0004 (mTEC III), P = 0.0013 or <0.0001 (mTEC IV). f, g mTEC subset percentages in IL-33-treated or schistosome-infected mice (Infected, n = 8 mice, other groups, n = 7 mice, pool of two independent experiments). IL-33 versus PBS or Infected versus Uninfected, P < 0.0001 or <0.0001 (mTEC I), P = 0.0008 or P < 0.0001 (mTEC II), P = 0.0004 or <0.0001 (mTEC III), P = 0.0043 or 0.0238 (mTEC IV). hj The percentages of mTECs or cTECs in FTOCs treated with IL-33 for 4 days (n = 4 biologically independent samples of fetal thymic lobes). PBS, P = 0.7988 (mTEC or cTEC); IL-33, P = 0.0474 (mTEC or cTEC). km The percentages of cTECs or mTECs in schistosome-infected mice (n = 7 mice, pool of two independent experiments). Infected WT versus Uninfected WT or Infected pou2f3−/−, P < 0.0001 (mTEC or cTEC) or P = 0.0146 (mTEC or cTEC). b, c, e, f, g Unpaired two-tailed Student’s t-test; (i, j, l, m) One-way ANOVA with Tukey’s multiple comparisons. All data are shown as the mean ± s.d. *P < 0.05, **P < 0.01, ***P < 0.001, NS, not significant. Source data are provided as a Source Data file.
Fig. 8
Fig. 8. Pou2f3 deficiency abolishes thymic involution-mediated T cell aging during schistosome infection.
ac Representative morphology and quantified weight and cellularity of thymus from WT or Pou2f3−/− mice 8 weeks after schistosome infection (n = 6 mice, pool of two independent experiments). Infected WT versus Uninfected WT, P < 0.0001 (weight), P < 0.0001 (cells); Infected WT versus Infected Pou2f3−/−, P = 0.0112 (weight), P = 0.0031 (cells); One-way ANOVA with Tukey’s multiple comparisons. d, e Representative and quantified flow cytometry of CFSE MFI of CFSE-labeled naive CD4+ T cells from uninfected or infected WT or Pou2f3−/− mice stimulated with anti-CD3 and anti-CD28 antibodies (n = 6 mice, pool of two independent experiments). Infected WT versus Uninfected WT, P < 0.0001; Infected WT versus Infected Pou2f3−/−, P < 0.0001; One-way ANOVA with Tukey’s multiple comparisons. f Representative image of histology of liver from WT or Pou2f3−/− mice after schistosome infection; Scale bar, 100 μm. g The areas of granulomas around a single egg (n = 6 mice, pool of two independent experiments), P < 0.0001, Unpaired two-tailed Student’s t-test. All data are shown as the mean ± s.d. **P < 0.01, ***P < 0.001. Source data are provided as a Source Data file.

References

    1. Stelekati E, Wherry EJ. Chronic bystander infections and immunity to unrelated antigens. Cell Host Microbe. 2012;12:458–469. - PMC - PubMed
    1. Elliott AM, et al. Effects of maternal and infant co-infections, and of maternal immunisation, on the infant response to BCG and tetanus immunisation. Vaccine. 2010;29:247–255. - PMC - PubMed
    1. Salgame P, Yap GS, Gause WC. Effect of helminth-induced immunity on infections with microbial pathogens. Nat. Immunol. 2013;14:1118–1126. - PMC - PubMed
    1. Chertow DS, Memoli MJ. Bacterial coinfection in influenza: a grand rounds review. JAMA. 2013;309:275–282. - PubMed
    1. Zhou F, et al. Clinical course and risk factors for mortality of adult inpatients with COVID-19 in Wuhan, China: a retrospective cohort study. Lancet. 2020;395:1054–1062. - PMC - PubMed

Publication types

Substances